
Price Action Analysis Toolkit Development (Part 61): Structural Slanted Trendline Breakouts with 3-Swing Validation

Contents
Introduction
The previous article established a structured approach to drawing slanted trendlines as a practical way of interpreting market direction and understanding how price behaves within evolving structure. Anchoring trendlines to validated swing points grounds the analysis directly in market structure, improving consistency while removing discretionary line placement.
Building on that foundation, this article takes the concept further by introducing an enhanced analytical tool that extends slanted trendlines into a breakout-based signal framework. Trendline breakouts remain one of the most important and widely used strategies in price action trading, as they reveal moments when accumulated pressure resolves into directional expansion. With this approach, the system performs the structural analysis on behalf of the trader, systematically identifying valid trendlines and signaling only meaningful breaks—making trendline breakout trading clearer, more disciplined, and significantly easier to execute.
This tool is developed using the MQL5 programming language. The sections that follow outline the strategy logic first, then demonstrate how that structure is translated into an MQL5 implementation. Testing and observed outcomes are then examined, before concluding with final observations.
Strategy Overview
Trendline breakouts are among the earliest concepts introduced in price action trading, forming a foundational tool for understanding directional bias, market structure, and momentum development. Over time, many traders drift away from these principles, often in pursuit of increasingly complex strategies that promise precision but introduce unnecessary noise. This shift frequently results in over-analysis and inconsistent execution. Rather than adding complexity, this approach re-centers trendline breakouts around clear structural rules and disciplined execution, focusing on what price is objectively doing rather than what is anticipated to happen next.
Trendlines as Dynamic Support and Resistance
Trendlines function as structural representations of support and resistance. Most traders are familiar with horizontal support and resistance levels, which are drawn at price zones where the market has repeatedly reacted in the past. These levels are particularly effective in ranging or consolidating conditions, where price oscillates between relatively fixed boundaries.
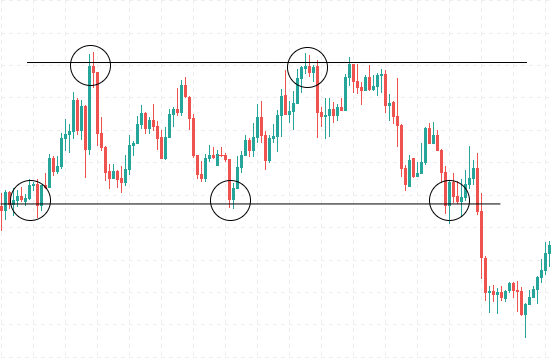
Figure 1: Horizontal Support and Resistance in Consolidation
Figure 1 shows horizontal support and resistance within a consolidating market. The circled areas highlight repeated price reactions at the same levels, confirming these zones as technically significant. In this environment, support and resistance remain relatively static because price oscillates sideways rather than advancing directionally. Consolidation, however, is a temporary state. As price transitions into a trend, it begins to form higher highs and higher lows in an uptrend, or lower highs and lower lows in a downtrend. Under these conditions, support and resistance no longer remain fixed; they adapt to directional pressure and evolve with price.
Slanted trendlines capture this dynamic behavior by connecting key swing points within the trend. In an uptrend, a slanted support line links rising swing lows, marking areas where buying pressure consistently enters the market. In a downtrend, a slanted resistance line connects falling swing highs, identifying zones where selling pressure repeatedly emerges. Beyond marking price levels, these trendlines convey the angle, strength, and persistence of the trend, offering a clearer view of how price develops over time rather than reacting to isolated horizontal zones.
Illustrating a Slanted Trendline Breakout
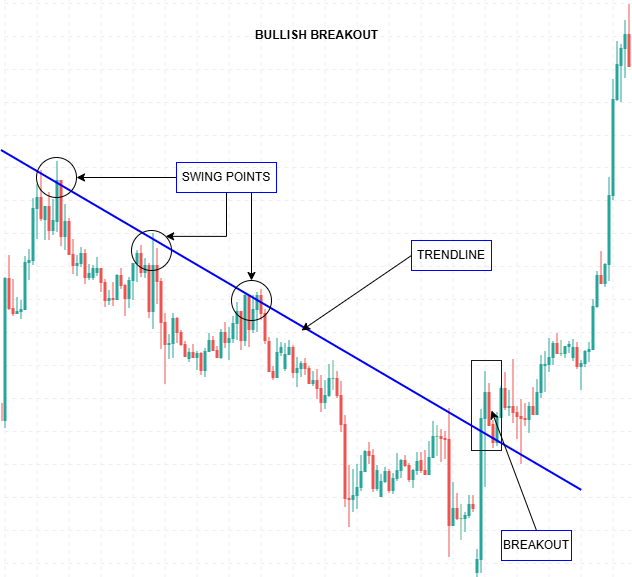
Figure 2: Bullish Slanted Trendline Breakout
Figure 2 shows a bullish slanted trendline breakout derived from validated swing points. The circled areas mark the swings used to construct a descending slanted trendline, which functions as dynamic resistance within the prevailing bearish trend. As price continues to interact with the line, repeated reactions confirm its relevance. The breakout is identified only when price decisively crosses above the slanted trendline, indicating that selling pressure has weakened and directional control is shifting.
This example highlights how swing validation, trendline construction, and breakout confirmation combine to produce a clear, rule-based signal within the strategy.
The Importance of Trendline Breakouts
Slanted trendlines represent evolving support and resistance within a trending market. When price decisively breaks a well-established trendline, it signals that the directional pressure sustaining the trend has weakened. Such breaks often precede a meaningful shift in market behavior, whether through a reversal, a deeper corrective move, or an acceleration in the opposing direction.
In practice, the weakness of trendline breakout trading lies not in the concept itself, but in how breakouts are identified. Many failed setups originate from trendlines that lack structural justification or from interpreting minor price intrusions as valid breaks. These premature signals introduce noise, lead to poor timing, and undermine consistency. To counter this, the strategy enforces strict construction and confirmation rules. Trendlines must be derived from clear swing structure, and breakouts are recognized only when price performs a decisive cross from one side of the line to the other, rather than briefly touching or piercing it.
To further strengthen reliability, trendlines are validated using three swing points. While two points are sufficient to define a line geometrically, they offer no proof that price respects it. The third swing provides that confirmation, demonstrating repeated interaction with the same slanted level. This requirement filters out coincidental alignments and ensures that breakout analysis is performed only on trendlines that carry genuine structural relevance.
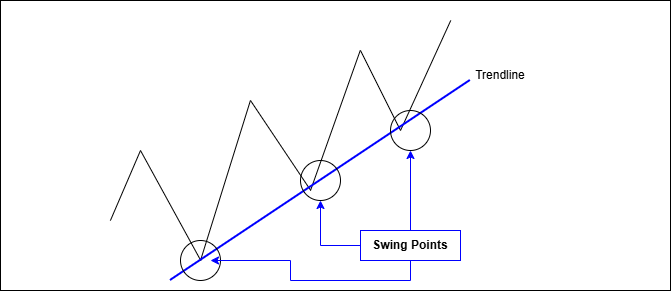
Figure 3: Three-Swing Trendline Validation
The diagram illustrates how a third swing confirms trendline relevance by demonstrating repeated price interaction along the same slanted structure.
Strategy Logic and Signal Generation
Within this tool, trendlines are constructed strictly from validated swing points, ensuring that each line reflects genuine market behavior. Additional confirmation is introduced by requiring multiple swing interactions with the same trendline, reinforcing its relevance before it is used for signal generation.
Once a valid slanted trendline has been established:
- Buy signal: price decisively breaks above a validated slanted resistance trendline
- Sell signal: price decisively breaks below a validated slanted support trendline
Breakouts are confirmed using price crossing logic rather than simple touches, which helps filter noise and reduces false signals. With swing detection, trendline construction, and breakout validation handled systematically, the analysis remains consistent and free from discretionary line placement, while staying fully aligned with pure price action principles.
The following section shows how this structure is implemented in MQL5, translating the analytical rules into code that manages swing identification, trendline validation, and breakout confirmation in a unified workflow.
MQL5 Implementation
This section outlines how the strategy logic is translated into an MQL5 implementation. The code is organized into modular components that handle swing detection, trendline validation, and breakout confirmation, keeping the logic clear and extensible. Follow the implementation steps below to see how everything comes together.
Input Parameters Configuration
The EA begins by defining a comprehensive set of input parameters that enable you to customize its behavior according to your trading preferences. These include options for swing detection, such as the number of bars to look back (SwingLookback) and the minimum swing size (MinSwingSize), which can be set based on ATR or a fixed value. You can choose whether to use ATR filtering (UseATRFiltering) for dynamic swing sizing and decide whether to display swing points and labels on the chart (ShowSwingPoints, ShowSwingLabels). The trendline settings allow you to specify whether to draw resistance and support lines (DrawResistanceLine, DrawSupportLine), whether to extend these lines to the right edge of the chart (ExtendToRightEdge), and the minimum number of touches needed for a line to be considered significant (MinTouchPointsRequired).
input int    SwingLookback = 5;
input double MinSwingSize = 0.0003;
input bool   UseATRFiltering = true;
input bool   ShowSwingPoints = true;
input bool   ShowSwingLabels = false;

input bool   DrawResistanceLine = true;
input bool   DrawSupportLine = true;
input bool   ExtendToRightEdge = true;
input int    MinTouchPointsRequired = 3;

input double ThirdSwingToleranceATR = 0.15;
input bool   RequireThirdSwingAfterAnchor2 = true;

input bool   EnableBreakoutSignals = true;
input bool   BreakoutUseClose = true;
input int    BreakoutBufferPoints = 5;
input bool   AlertOnBreakout = false;
input bool   PermanentArrows = true;

input color  BullArrowColor = clrLimeGreen;
input color  BearArrowColor = clrRed;
For validating the trendlines with a third swing point, parameters include the ATR-based tolerance (ThirdSwingToleranceATR) and whether the third swing must occur after the second (RequireThirdSwingAfterAnchor2) for increased reliability. Breakout detection options include enabling or disabling signals (EnableBreakoutSignals), choosing whether to base detection on closing prices or candlestick wicks (BreakoutUseClose), setting a buffer in points beyond the trendline for confirmation (BreakoutBufferPoints), toggling alerts (AlertOnBreakout), and whether to place permanent visual arrows on the chart (PermanentArrows). Additionally, visual customization options such as colors, line width, style, and arrow size allow you to tailor the chart appearance to your liking.
Global Variables and Data Structures
To support this logic, the implementation maintains a small set of global variables and data structures. An indicator handle for ATR (atrHandle) is initialized, along with a variable (currentATR) to store the latest ATR value. Arrays are created to hold swing points (significantHighs, significantLows) and breakout information (breakoutsArray).
int    atrHandle = INVALID_HANDLE;
double currentATR = 0.0001;

struct SwingPoint
{
   datetime          time;
   double            price;
   int               barIndex;
   double            size;
   bool              isHigh;
   int               order;
};

struct BreakoutInfo
{
   datetime          time;
   double            price;
   bool              isBullish;
   string            lineType;  // "RES" or "SUP"
   int               touchCount;
};
Two structures are defined: SwingPoint, which holds details like time, price, bar index, size, whether it's a high or low, and order; and BreakoutInfo, which records the timestamp, price, line type, and number of touches for each confirmed breakout.
SwingPoint significantHighs[10], significantLows[10];
BreakoutInfo breakoutsArray[];
int breakoutsCount = 0;
These structures help organize data logically, making it easier to process swing points, validate trendlines, and record breakout events systematically.
Utility Functions
Utility functions provide essential supportive operations for the core analysis. DeleteObjectsByPrefix scans the chart and removes all objects with a specific prefix, helping to clear outdated trendlines and points before redrawing new ones. BreakoutBufferPrice and ThirdSwingTolerancePrice calculate buffer zones based on the number of points and ATR, used for confirming breakouts and swing point proximity to trendlines.
void DeleteObjectsByPrefix(const string prefix)
{
   int total = ObjectsTotal(0, -1, -1);
   for(int i = total - 1; i >= 0; i--)
   {
      string name = ObjectName(0, i, -1, -1);
      if(StringLen(name) >= StringLen(prefix) && StringSubstr(name, 0, StringLen(prefix)) == prefix)
         ObjectDelete(0, name);
   }
}
LinePriceAtTime computes the interpolated price of a trendline at a specific time, which is fundamental for visualizing and validating sloped lines.
double LinePriceAtTime(const SwingPoint &a, const SwingPoint &b, datetime t)
{
   double dt = (double)(b.time - a.time);
   if(dt == 0.0)
      return a.price;
   double slope = (b.price - a.price) / dt;
   return a.price + slope * (double)(t - a.time);
}
The ThirdSwingConfirms function checks if a third swing point (high or low) falls within the tolerance zone of the trendline, confirming its validity. DrawPermanentArrow creates a visual arrow marker at breakout points, indicating whether a bullish or bearish breakout has occurred, and stores this event in the breakoutsArray. RedrawPermanentArrows iterates through stored breakout data to redraw arrows, ensuring visual persistence. The OnInit, OnDeinit, and OnTick functions handle initialization, cleanup, and updating procedures, such as updating ATR values, clearing old objects, and orchestrating analysis routines for each new candle.
bool ThirdSwingConfirms(const SwingPoint &a, const SwingPoint &b, const SwingPoint &c)
{
   double lp = LinePriceAtTime(a, b, c.time);
   return (MathAbs(c.price - lp) <= ThirdSwingTolerancePrice());
}
Finding Swing Points
The FindSignificantSwings function systematically scans recent bars to identify potential swing highs and lows. It iterates through the bars, starting from the SwingLookback offset to avoid boundary issues. For each bar, it checks whether the high is greater than neighboring bars to identify swing highs and, similarly, whether the low is less than neighbors for swing lows. It calculates the swing size (the difference between high and low extremes) and compares it against the minimum size threshold, which is either ATR-based or fixed. When a swing point qualifies, its details—including time, price, bar index, size, and type—are stored in the respective array. This process ensures only significant swings are considered for trendline drawing, filtering out minor price fluctuations.
void FindSignificantSwings(const MqlRates &rates[], int totalBars,
                           SwingPoint &highs[], int &highCount,
                           SwingPoint &lows[], int &lowCount)
{
   highCount = 0;
   lowCount  = 0;

   double minSize = UseATRFiltering ? (currentATR * 0.8) : MinSwingSize;

   for(int i = SwingLookback; i < totalBars - SwingLookback; i++)
   {
      // Swing high detection
      bool isSwingHigh = true;
      double currentHigh = rates[i].high;
      for(int j = 1; j <= SwingLookback; j++)
      {
         if(rates[i-j].high >= currentHigh || rates[i+j].high >= currentHigh)
         {
            isSwingHigh = false;
            break;
         }
      }
      if(isSwingHigh)
      {
         // Save swing high info
         ...
      }

      // Swing low detection
      bool isSwingLow = true;
      double currentLow = rates[i].low;
      for(int j = 1; j <= SwingLookback; j++)
      {
         if(rates[i-j].low <= currentLow || rates[i+j].low <= currentLow)
         {
            isSwingLow = false;
            break;
         }
      }
      if(isSwingLow)
      {
         // Save swing low info
         ...
      }
   }
}
Assigning Swing Order
Once swing points are detected, the AssignSwingOrder function sorts them chronologically from the oldest to the newest based on their timestamps. This ordering is crucial because trendlines are drawn between specific swing points in sequence. After sorting, each swing point is assigned an order number, starting from 1 for the oldest. This numerical order helps to maintain consistency when selecting points for trendline construction and validation, especially when analyzing multiple swings over time.
void AssignSwingOrder(SwingPoint &swings[], int count)
{
   if(count <= 0)
      return;
   // Sorting by time ascending
   for(int i = 0; i < count-1; i++)
   {
      for(int j = i+1; j < count; j++)
      {
         if(swings[i].time > swings[j].time)
         {
            SwingPoint tmp = swings[i];
            swings[i] = swings[j];
            swings[j] = tmp;
         }
      }
   }
   for(int i = 0; i < count; i++)
      swings[i].order = i + 1;
}
Drawing Swing Points
The DrawSwingPoints function visualizes the identified swing highs and lows on the chart. For each high or low swing point, it creates an arrow object—OBJ_ARROW_THUMB_DOWN for highs and OBJ_ARROW_THUMB_UP for lows—placing it at the corresponding time and price level. Visual properties like color, width, and anchor point are set to improve clarity. If enabled, labels such as "H1", "L1" are added near the swing points, slightly offset by ATR to avoid overlapping with the candles. These visual markers help traders easily recognize significant swings and understand the structure of the price action.
void DrawSwingPoints(const SwingPoint &highs[], int highCount,
                     const SwingPoint &lows[], int lowCount)
{
   for(int i = 0; i < highCount; i++)
   {
      string pointName = TL_PREFIX + "H_" + IntegerToString(highs[i].order);
      if(ObjectFind(0, pointName) < 0)
         ObjectCreate(0, pointName, OBJ_ARROW_THUMB_DOWN, 0, highs[i].time, highs[i].price);
      else
         ObjectMove(0, pointName, 0, highs[i].time, highs[i].price);
      ObjectSetInteger(0, pointName, OBJPROP_COLOR,  SwingHighColor);
      ObjectSetInteger(0, pointName, OBJPROP_WIDTH,  2);
      ObjectSetInteger(0, pointName, OBJPROP_ANCHOR, AnchorPoint);
      ObjectSetInteger(0, pointName, OBJPROP_BACK,   false);
      // Labels if enabled
      if(ShowSwingLabels)
      {
         ...
      }
   }
   // Similar for lows
}
Finding the Best Resistance and Support Lines
The functions FindBestResistanceLine3 and FindBestSupportLine3 analyze the previously identified swing points to select the most significant resistance and support trendlines. They systematically examine pairs of swing points, checking for descending resistance patterns (older high higher than newer high) or ascending support patterns (older low lower than newer low). For each pair, the slope of the potential trendline is computed, and the number of candles intersecting the line within a deviation threshold is counted. The functions also verify the presence of a third swing point that confirms the trendline's validity, using the ThirdSwingConfirms function. Each candidate line is scored based on the number of touches, deviation, recency (how recent the line is), and whether it is confirmed by a third swing. The highest-scoring lines are selected as the most significant, representing the strongest resistance or support levels in the current chart context.
void FindBestResistanceLine3(const SwingPoint &highs[], int highCount,
                             const MqlRates &rates[], int totalBars,
                             SwingPoint &bestAnchor1, SwingPoint &bestAnchor2, SwingPoint &bestAnchor3,
                             int &bestTouchCount, double &bestScore)
{
   ...
   for(int a = 0; a < highCount-1; a++)
   {
      for(int b = a+1; b < highCount; b++)
      {
         if(!(pts[a].price > pts[b].price))
            continue;
         ...
         // Count touches and confirm third swing
         ...
         // Calculate score and update best line
      }
   }
}
Drawing the Trendlines
The DrawTrendline3 function creates or updates trendline objects connecting the selected swing points. It assigns a unique name to the trendline based on whether it’s resistance or support and sets its visual properties—color, width, style, and extension—according to user preferences. The trendline is drawn between the first two anchor points, and a label indicating the number of swing points used for validation is placed near the third swing point, with a slight vertical offset for visibility. This visual representation helps traders see the sloped support/resistance levels that have been validated through multiple swings, providing context for potential breakouts.
void DrawTrendline3(const SwingPoint &anchor1, const SwingPoint &anchor2, const SwingPoint &anchor3,
                    bool isResistance, int touchCount)
{
   string lineName  = TL_PREFIX + (isResistance ? "RESISTANCE" : "SUPPORT");
   string labelName = TL_PREFIX + (isResistance ? "RES_LABEL"  : "SUP_LABEL");

   if(ObjectFind(0, lineName) < 0)
   {
      ObjectCreate(0, lineName, OBJ_TREND, 0,
                   anchor1.time, anchor1.price,
                   anchor2.time, anchor2.price);
   }
   else
   {
      ObjectMove(0, lineName, 0, anchor1.time, anchor1.price);
      ObjectMove(0, lineName, 1, anchor2.time, anchor2.price);
   }

   ObjectSetInteger(0, lineName, OBJPROP_COLOR,     lineColor);
   ObjectSetInteger(0, lineName, OBJPROP_WIDTH,     LineWidth);
   ObjectSetInteger(0, lineName, OBJPROP_STYLE,     LineStyle);
   ObjectSetInteger(0, lineName, OBJPROP_RAY_RIGHT, ExtendToRightEdge);
   ObjectSetInteger(0, lineName, OBJPROP_BACK,      false);

   // Label near 3rd swing
   ...
}
Breakout Check (Cross Logic for Slanted Lines)
The CheckBreakouts function monitors recent candles to detect when the price crosses above resistance or below support trendlines, indicating a potential breakout. It calculates the expected trendline price at the last two closed candles and compares it with the actual close or wick prices, considering a buffer zone to avoid false signals. If the price crosses above the resistance line (bullish breakout) or below the support line (bearish breakout), and no prior breakout has been recorded on that bar, the function records the event, draws a permanent arrow, and optionally sends an alert message. The system ensures only one breakout per side per bar by tracking timestamps, preventing multiple signals for the same event.
void CheckBreakouts(const MqlRates &rates[],
                    bool haveRes, const SwingPoint &resA, const SwingPoint &resB, int resTouches,
                    bool haveSup, const SwingPoint &supA, const SwingPoint &supB, int supTouches)
{
   ...
   if(haveRes)
   {
      double line1 = LinePriceAtTime(resA, resB, t1);
      double line2 = LinePriceAtTime(resA, resB, t2);
      double p1 = BreakoutUseClose ? rates[1].close : rates[1].high;
      double p2 = BreakoutUseClose ? rates[2].close : rates[2].high;
      bool crossedUp = (p2 <= line2 + buf) && (p1 > line1 + buf);
      if(crossedUp && t1 != g_lastBuyBarTime)
      {
         g_lastBuyBarTime = t1;
         // Draw arrow and alert
      }
   }
   // Similar for support line
}
Chart Event Handling and Main Loop
The OnChartEvent function is included as a placeholder for manual control or hotkey triggers if needed but remains empty in this implementation. The primary execution occurs in the OnTick function, which runs on every price tick. It first checks whether a new candle has formed by comparing bar timestamps. If so, it updates the ATR value, clears previous trendline objects, and initiates the main analysis sequence via DrawMostSignificantTrendlines. This sequence involves identifying swing points, selecting the best resistance and support lines, drawing trendlines, and checking for breakouts. Permanent arrows are redrawn for confirmed breakouts, ensuring the chart reflects the latest technical situation. This continuous process allows the EA to adapt dynamically to changing market conditions and provide timely signals.
void OnTick()
{
   static datetime lastBarTime = 0;
   datetime currentBarTime = iTime(_Symbol, _Period, 0);
   if(currentBarTime == lastBarTime && lastBarTime != 0)
      return;
   lastBarTime = currentBarTime;

   if(UseATRFiltering && atrHandle != INVALID_HANDLE)
   {
      double atrBuffer[1];
      if(CopyBuffer(atrHandle, 0, 0, 1, atrBuffer) > 0)
         currentATR = atrBuffer[0];
   }

   DeleteObjectsByPrefix(TL_PREFIX);
   DrawMostSignificantTrendlines();

   RedrawPermanentArrows();
}
After implementation, the code is compiled and validated to confirm a clean build before testing. Any compiler messages are treated as structural feedback, guiding corrections to syntax, declarations, or function usage until the implementation compiles without errors and is ready for evaluation within the MetaTrader 5 environment.
Testing and Outcomes
After successfully compiling the tool, the next step is testing. This can be done on a live chart; however, it is strongly recommended to begin with a demo account rather than a real account. Testing on a demo environment allows the strategy to be observed under real market conditions without unnecessary risk.
In addition to live chart testing, the tool can be evaluated using the MetaTrader 5 Strategy Tester. This form of historical testing, commonly referred to as backtesting, makes it possible to assess how the strategy would have behaved under past market conditions. Backtesting also helps identify strengths, weaknesses, and areas where parameter adjustments may be required, especially since different symbols often exhibit different price behavior.
Further refinement can be achieved through optimization within MetaTrader 5, where input parameters are systematically tested to improve performance. This process can be computationally intensive and typically benefits from a powerful computer.
In this section, I present the outcomes observed during the testing phase, highlighting how the tool performed under different conditions and what insights were gained from the results.
First Outcome

Figure 4: Backtest Example on EURUSD (H1)
Figure 4 shows a backtest example captured in the MetaTrader 5 Strategy Tester using visual mode. In this scenario, the tool identifies and constructs a slanted resistance trendline (shown in red) by connecting three validated swing points. As price advances, a decisive break above the trendline occurs. The breakout is confirmed by the tool and marked with a green upward arrow, signaling a bullish breakout. Signals are generated only after a clear price crossing, rather than in response to minor touches or temporary intrusions. This example demonstrates how the tool behaves during historical testing: trendlines are derived from validated swing structure, and breakout signals appear only when meaningful breakout conditions are met, resulting in clear and disciplined signals aligned with price action logic.
Second Outcome
The diagram below shows a second test conducted on Gold (XAUUSD) on the H1 timeframe, captured during historical testing using the MetaTrader 5 Strategy Tester in visual mode. This example illustrates how the tool operates in a more volatile market environment, where price movements are larger and conditions change more rapidly. In this test, the tool automatically identifies both slanted resistance and slanted support trendlines based on validated swing points.
The red descending trendline represents resistance constructed from three confirmed swing highs, while the blue ascending trendline represents support formed from multiple swing lows. As price develops, the resistance trendline remains intact until a decisive interaction occurs. Rather than reacting to brief violations or volatility-driven spikes, the tool waits for a clear price crossing relative to the slanted trendline before evaluating any breakout condition. This restraint is particularly important on instruments such as Gold, where false breakouts are common due to heightened volatility.

Figure 5: Backtest Example on XAUUSD (H1)
A key observation from this test is how the tool adapts to Gold’s price behavior without manual intervention. Swing detection, trendline construction, and validation remain consistent, despite the wider price ranges and sharper movements. This confirms that the strategy logic is not symbol-specific, but driven by consistent price behavior. Overall, this test reinforces the robustness of the tool under different market conditions. The same structural rules applied to Forex pairs also hold on commodities such as Gold, allowing trendline breakouts to be identified objectively and consistently during historical testing. As with all price action tools, performance depends on market conditions, timeframe selection, and disciplined interpretation of signals.
Conclusion
This article outlined a structure-driven approach to slanted trendline breakouts and demonstrated how core price action principles can be translated into a disciplined MQL5 analytical tool. By enforcing clear structural rules, the tool removes much of the ambiguity that commonly undermines trendline breakout analysis.
The testing examples confirm that this structure-first logic behaves consistently across different instruments and market conditions. Rather than adapting the rules to suit the market, the analysis remains anchored to swing structure and price behavior, allowing breakout signals to emerge naturally from the chart.
Within this framework, trendline breakouts become easier to identify, evaluate, and integrate into a disciplined price action workflow—without relying on subjective interpretation or discretionary line placement.
This tool is intended strictly for analysis and signal confirmation, not automated trading. Thorough testing is strongly recommended using historical backtesting and live demo accounts before applying it to real capital. When used alongside an existing trading approach, the tool can act as an additional layer of confirmation, helping reinforce disciplined decision-making rather than replacing it.
Warning: All rights to these materials are reserved by MetaQuotes Ltd. Copying or reprinting of these materials in whole or in part is prohibited.
This article was written by a user of the site and reflects their personal views. MetaQuotes Ltd is not responsible for the accuracy of the information presented, nor for any consequences resulting from the use of the solutions, strategies or recommendations described.

- Free trading apps
- Over 8,000 signals for copying
- Economic news for exploring financial markets
You agree to website policy and terms of use