
Price Action Analysis Toolkit Development (Part 60): Objective Swing-Based Trendlines for Structural Analysis

Contents
Introduction
In Part 19 of this series, I introduced an analysis tool that relied on the ZigZag indicator to identify swing points, using them as a basis for drawing trendlines to interpret evolving price structure. That work laid an important foundation: demonstrating that trendlines are not merely visual aids, but vital structural references that help frame how price may behave ahead of time. Building on that concept, this article approaches the same core idea from a more deliberate and refined perspective. Instead of depending on an indicator to define swings, the current tool derives swing points directly from raw price action. By working solely with observed price behavior, the analysis becomes more transparent and controllable, reducing the instability often associated with indicator-based pivots.
The main objective remains to enhance and simplify structural price analysis. Trendlines serve a crucial role in this process because they dynamically identify potential future support and resistance levels—particularly when the market respects sloped, angled structures rather than flat, horizontal ones. While horizontal levels are widely recognized and easy to define, slanted trendlines often carry equally significant insights but are more challenging to draw consistently, leading to their underutilization in many trading systems. This tool aims to fill that gap. By objectively detecting significant swing points and constructing clear, rule-based trendlines from these, it becomes easier to work with sloped structures in a consistent and repeatable manner. The focus is not on prediction or signal generation but on preserving the market’s structural integrity and observing price action within a well-defined, visual framework.
In the sections that follow, we will explore the core principles behind this approach, then walk through the detailed implementation in MQL5. Afterward, we’ll review the outcomes and behavior of the tool on the chart, before concluding with key insights and how this methodology complements broader technical analysis strategies.
Understanding the Concept
The fundamental idea behind this tool is rooted in a simple yet powerful observation: price often reveals its intentions through structure long before any explicit move occurs. When the market consistently reacts along a slanted path, that behavior is not coincidental. It reflects underlying directional pressure, active participation, and a shifting balance of control between buyers and sellers. Trendlines provide a practical way to capture and interpret this behavior, offering a structural framework that enhances market structure interpretation. The key benefit is a shift in perspective—moving away from isolated candles and instead viewing price within the context of the evolving structure it continues to respect over time.
Trendlines as Structural References
In this framework, trendlines are treated strictly as structural reference points rather than predictive tools. A meaningful trendline is not defined by how easily it can be drawn, but by how consistently price interacts with it. When price repeatedly respects a slanted boundary, that boundary becomes an active and dynamic form of support or resistance, adapting naturally as time progresses. This approach is particularly relevant in trending or compressing markets, where structure is often expressed diagonally rather than horizontally.
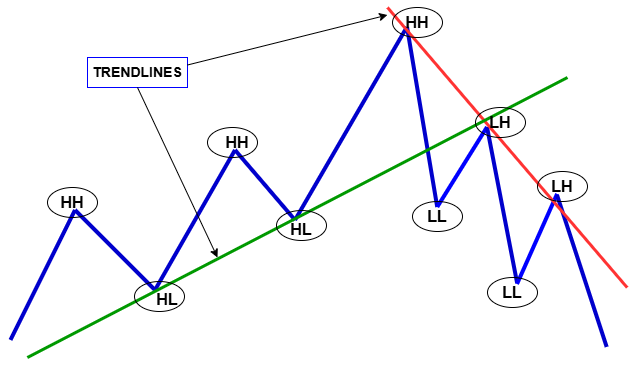
The following diagram illustrates how trendlines are derived from ordered swing highs and lows. Ascending swing lows define support, while descending swing highs define resistance, allowing structure to guide trendline formation.
While horizontal levels remain valuable, they do not always capture the full picture. Many market phases unfold along angled or slanted structures, yet such trendlines are often difficult to draw objectively and are frequently applied subjectively. This tool is designed to make working with slanted trendlines more objective, consistent, and repeatable, allowing them to be integrated more reliably into the analysis process.
Logical Flow of the Tool
At a high level, the tool follows a disciplined and structured process:
- Identifying Significant Swings
The process begins by detecting meaningful swing points directly from raw price data, without relying on indicator-defined pivots. These swings represent points of local dominance, where price shows temporary exhaustion or acceleration.
- Filtering and Validating Swings
To reduce noise, each detected swing is evaluated against size and significance criteria. This ensures that only genuine shifts in market behavior are retained, while minor fluctuations are ignored.
- Building Structural Relationships
The validated swings are then assessed to determine whether they can form coherent support or resistance structures. Highs and lows are handled independently: descending swing highs are evaluated for potential resistance trendlines, while ascending swing lows are evaluated for potential support trendlines.
- Forming and Extending Trendlines
When a valid structural relationship is identified, the trendline is constructed using the selected swings, preserving the exact slope defined by the market. The line is then extended forward using a ray, maintaining structural continuity without smoothing, averaging, or regression. The goal is not to predict future price movement, but to preserve structure and observe how price continues to interact with it.
- Selective and Focused Output
Only the most significant trendlines on each side are retained. This intentional limitation keeps the chart clean and focused on the dominant structural levels rather than overwhelming it with redundant geometry.
Constructing Swings from Raw Price Action
The foundation of this approach lies in the direct derivation of swing points from raw price action, avoiding reliance on auxiliary indicators. A swing high is identified when a bar demonstrates local dominance over its surrounding bars, signaling a temporary exhaustion of buying pressure. Conversely, a swing low reflects a point where selling pressure subsides and price begins to stabilize.
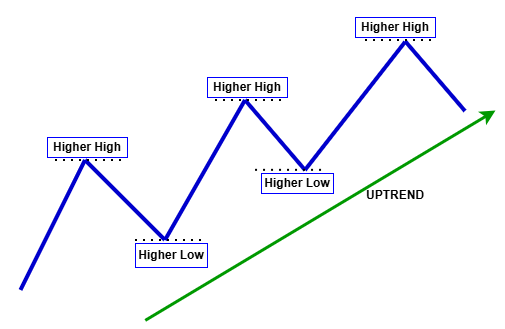
The figure above illustrates an example of price structure forming higher highs and higher lows, establishing an ascending structural framework from which a support trendline can be derived.
To ensure structural relevance, each swing is further qualified by its magnitude relative to market volatility. Only swings that exceed a defined size threshold are considered. This combination of local dominance and size filtering ensures that the resulting structure reflects meaningful market behavior rather than short-lived noise.
Connecting Swings into Trendlines
Once swings are validated and ordered chronologically, the tool evaluates their structural relationships. Not every pair of swings is suitable for forming a trendline. Only those that adhere to clear directional rules—descending highs for resistance and ascending lows for support—are considered. This prevents the creation of forced or misleading geometry that contradicts the market’s actual behavior.
When a valid pair is identified, the trendline is constructed using the exact slope defined by those swings. Extending the line as a ray preserves structural integrity over time, allowing price action to be observed against a stable reference. At this stage, the focus remains purely analytical: the trendline is maintained to observe structure, not to forecast outcomes.
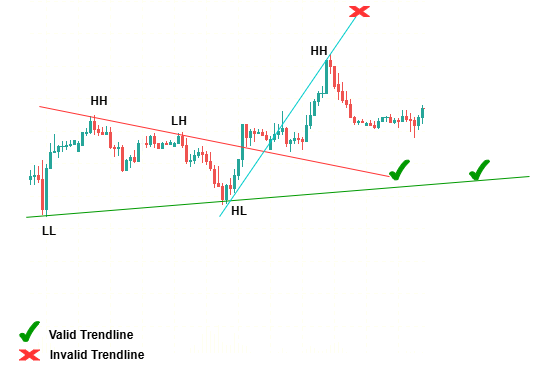
With this conceptual and logical foundation established, the next section shifts from theory to practice, detailing how these ideas are translated into a concrete, rule-based MQL5 implementation. The diagram below contrasts valid and invalid trendlines derived from swings on the same side of the price structure. Valid trendlines align with consistent swing relationships, while invalid examples result from mixing opposing structural sides or violating directional continuity.
MQL5 Implementation
This section provides a comprehensive explanation of how the conceptual framework for structural trendline analysis is translated into an actual, rule-based MQL5 program. The primary goal is to faithfully embody the core principles—such as objective swing detection, structural validation, and disciplined trendline drawing—in a manner that ensures the system remains stable, transparent, and consistent across both historical and live market data. The implementation is organized into distinct stages, each corresponding directly to a fundamental part of the conceptual model. This one-to-one mapping simplifies understanding and makes the code easier to verify, extend, or modify. By maintaining a clear correspondence between ideas and code, the approach guarantees that the system operates with integrity, providing a reliable structural analysis tool for traders.
Initialization and Environment Setup
The first step in the implementation involves setting up the environment to perform robust and accurate analysis. During the OnInit() function, the code prepares necessary indicators and clears previous analysis artifacts. If ATR filtering is enabled (UseATRFiltering), the system creates an indicator handle through iATR(), which calculates the current market volatility. This allows subsequent swing detection and qualification processes to adapt dynamically to changing market conditions, ensuring that the thresholds for significant swings are relevant regardless of volatility regime.
Additionally, the system calls DeleteObjectsByPrefix() to remove any existing trendlines or swing point objects from previous runs. This step guarantees a clean chart, free of residual objects that could cause visual clutter or misinterpretation. The initialization process establishes a controlled environment, ensuring that each analysis session starts with a consistent, clear visual and data state, which is essential for producing reliable and meaningful structural insights.
int OnInit()
{
    if(UseATRFiltering)
        atrHandle = iATR(_Symbol, _Period, 14);

    DeleteObjectsByPrefix(OBJECT_PREFIX);
    return(INIT_SUCCEEDED);
}
Real-Time Data Processing and Tick Handling
The core operational logic runs within the OnTick() function, which is invoked on every new market tick. Its purpose is to keep the analysis synchronized with live market data and ensure the visual output reflects the most recent price action. The process begins by checking if a new bar has formed, using iTime() to compare the current bar’s timestamp with the last processed one. If a new bar is detected, the code updates the ATR value by copying the latest data from the ATR indicator handle via CopyBuffer(). This step ensures that volatility-based thresholds for swing qualification are current and relevant.
After updating volatility information, the system deletes all previous trendline and swing point objects using DeleteObjectsByPrefix() to clear the chart. This prevents overlapping or outdated objects from cluttering the visual. Finally, the function DrawMostSignificantTrendlines() is called to analyze the latest data, detect significant swings, evaluate their structural importance, and draw new trendlines accordingly. This cycle ensures the visual and analytical framework remains up-to-date, reliable, and reflective of the current market environment.
void OnTick()
{
    static datetime lastBarTime = 0;
    datetime currentBarTime = iTime(_Symbol, _Period, 0);

    if(currentBarTime == lastBarTime && lastBarTime != 0)
        return; // No new bar, skip

    lastBarTime = currentBarTime;

    if(UseATRFiltering && atrHandle != INVALID_HANDLE)
    {
        double atrBuffer[1];
        if(CopyBuffer(atrHandle, 0, 0, 1, atrBuffer) > 0)
            currentATR = atrBuffer[0];
    }

    DeleteObjectsByPrefix(OBJECT_PREFIX);
    DrawMostSignificantTrendlines();
}
Swing Detection: Extracting Structural Points from Raw Price Action
Swing detection is implemented by identifying significant structural points directly from raw price data, implemented within FindSignificantSwings(). This process emphasizes transparency and objectivity by avoiding reliance on indicator-generated pivots, instead basing the analysis solely on the price series. The algorithm iterates through recent bars, starting from an index defined by SwingLookback to prevent boundary issues. For each bar, it assesses whether it qualifies as a swing high by comparing its high with neighboring bars within the lookback window. A swing high is confirmed if the current high exceeds all those of the surrounding bars, indicating a temporary peak. Conversely, swing lows are identified when a bar’s low is lower than those of neighboring bars, signaling a potential support point.
To ensure these swings reflect meaningful market reactions, each candidate’s size is calculated as the difference between the swing point and the maximum or minimum of adjacent lows or highs. This size is then compared against thresholds—either a fixed minimum (MinSwingSize) or a volatility-adjusted value (currentATR * 0.8)—to filter out insignificant fluctuations. Only swings surpassing these thresholds are retained, which guarantees that the analysis focuses on genuine structural shifts rather than minor noise.
void FindSignificantSwings(const MqlRates &rates[], int totalBars,
                           SwingPoint &highs[], int &highCount,
                           SwingPoint &lows[], int &lowCount)
{
    // Loop through bars starting from SwingLookback
    for(int i = SwingLookback; i < totalBars - SwingLookback; i++)
    {
        // Detect swing high
        bool isSwingHigh = true;
        double currentHigh = rates[i].high;
        for(int j = 1; j <= SwingLookback; j++)
        {
            if(rates[i - j].high >= currentHigh || rates[i + j].high >= currentHigh)
            {
                isSwingHigh = false;
                break;
            }
        }
        if(isSwingHigh)
        {
            // Calculate swing size and validate
            double leftLow  = MathMin(rates[i - 1].low, rates[i - 2].low);
            double rightLow = MathMin(rates[i + 1].low, rates[i + 2].low);
            double swingSize = currentHigh - MathMax(leftLow, rightLow);
            if(swingSize >= (UseATRFiltering ? currentATR * 0.8 : MinSwingSize))
            {
                // Store swing high
                // ...
            }
        }
        // Detect swing low (similar logic)
        // ...
    }
}
Assigning Chronological Order to Swings for Structural Consistency
Once the significant swings are identified and validated, it is essential to maintain their chronological order to preserve the logical integrity of the analysis. This is achieved through the AssignSwingOrder() function, which sorts the swing points based on their timestamps from oldest to newest. This ordering ensures that subsequent trendline construction respects the actual temporal progression of market activity. Maintaining a strict chronological sequence prevents logical inconsistencies, such as constructing support or resistance lines from swings that appear to shift in time, which could lead to misleading interpretations.
Additionally, this ordering safeguards against repainting—where historical levels appear to change as new data arrives—by fixing the sequence of swings in the analysis. The approach guarantees that the structural relationships depicted on the chart are stable, reliable, and truly reflect how the market has evolved. It provides traders with a consistent, trustworthy foundation for interpreting price action.
void AssignSwingOrder(SwingPoint swings[], int count)
{
    // Simple bubble sort by timestamp
    for(int i = 0; i < count - 1; i++)
    {
        for(int j = i + 1; j < count; j++)
        {
            if(swings[i].time > swings[j].time)
            {
                SwingPoint tmp = swings[i];
                swings[i] = swings[j];
                swings[j] = tmp;
            }
        }
    }
    // Assign order indices
    for(int i = 0; i < count; i++)
        swings[i].order = i + 1;
}
Constructing and Validating Support and Resistance Trendlines
The process of identifying and validating trendlines involves systematically evaluating pairs of swings to determine their suitability as structural support or resistance levels. Functions such as FindBestResistanceLine() and FindBestSupportLine() analyze all possible pairs that meet the directional criteria—descending pairs for resistance and ascending pairs for support. For each pair, the algorithm calculates the slope based on the vertical difference in prices divided by the horizontal difference in time, ensuring the line accurately reflects the market’s directional movement. The quality of each candidate line is then assessed by counting how many bars between the anchor points respect the line within a permissible deviation, often set to values like 0.2 or -0.3, to account for minor fluctuations.
The lines are scored based on multiple criteria: the number of touchpoints, how recent the anchors are, and whether the line meets a minimum touch threshold (MinTouchPointsRequired). Only the lines that achieve a high score are selected for visualization. This rigorous validation process ensures that only the most stable, well-respected support and resistance levels are represented, providing a clear and meaningful structural framework for analysis.
void FindBestResistanceLine(const SwingPoint &highs[], int highCount, /*...*/)
{
    // Loop through pairs of swing highs
    for(int a = 0; a < highCount - 1; a++)
    {
        for(int b = a + 1; b < highCount; b++)
        {
            // Check directional and recency criteria
            // Calculate slope
            // Count touches and evaluate deviation
            // Score candidate line
            // Keep track of best score and pair
        }
    }
}
Drawing and Extending Trendlines for Visual Clarity
Once the best candidate pairs are identified, the DrawTrendline() function visualizes these levels on the chart. Each trendline is created using ObjectCreate() with the OBJ_TREND object type, anchored at the respective swing points. The trendlines are extended into the future using the OBJPROP_RAY_RIGHT property, which maintains the original slope and projects support or resistance levels forward in time. This extension allows traders to observe how these levels might interact with future price action, offering a stable visual reference that adapts naturally to ongoing market changes.
Labels denoting the line type ("R" for resistance, "S" for support) along with touch counts are added for clarity. Visual parameters such as color, width, and line style are customizable through input settings, allowing traders to tailor the visual presentation to their preferences. This disciplined drawing approach guarantees that the support and resistance levels are both accurate and stable, reflecting the actual market structure rather than transient price movements or visual artifacts.
void DrawTrendline(const SwingPoint &anchor1, const SwingPoint &anchor2, bool isResistance, int touchCount, const MqlRates &rates[])
{
    // Create or update trendline object
    // Set properties: color, width, style, extend
    // Add label with touch count
}
Ensuring Structural Integrity and Preventing Repainting
Throughout the implementation, mechanisms are employed to ensure the stability of the structural analysis and prevent visual artifacts such as repainting. Swings are processed in the order they occurred, using the AssignSwingOrder() function, which sorts swings chronologically and assigns an order index. Trendlines are constructed only from validated swing pairs that meet strict criteria regarding their directional consistency and fit quality. Before each analysis cycle, all existing trendline and swing point objects are deleted with DeleteObjectsByPrefix(), ensuring that only the latest, most accurate levels are displayed. This disciplined approach prevents the dynamic shifting of levels that can mislead traders and ensures that the depicted support and resistance levels are consistent over time.
The result is a robust, reliable framework for structural analysis that aids traders in understanding the evolving market landscape with confidence. It also facilitates backtesting and forward testing, as the structural relationships are fixed, logical, and based solely on actual market data.
// Function to delete all trendline and swing point objects before each analysis cycle
void DeleteObjectsByPrefix(const string prefix)
{
    int totalObjects = ObjectsTotal(0, -1, -1);
    for(int i = totalObjects - 1; i >= 0; i--)
    {
        string name = ObjectName(0, i);
        if(StringFind(name, prefix) == 0) // Object name starts with prefix
        {
            ObjectDelete(0, name);
        }
    }
}

// Usage within OnTick() to clear previous objects
void OnTick()
{
    // ... existing code to process new bar and update ATR
    DeleteObjectsByPrefix(OBJECT_PREFIX);
    DrawMostSignificantTrendlines();
}
Outcomes
This section presents observations from live testing of the structural trendline tool. The illustration below shows an example captured on EURUSD, H1, where the tool was monitored over a period of approximately twelve hours to evaluate how price interacted with a pre-established structural resistance line.
During this observation window, price approached the descending resistance trendline multiple times before eventually moving above it. After this move, price returned to the same area and interacted with the level again, allowing the behavior around the former resistance to be examined in a live environment. No signals were generated and no directional intent was assigned; the focus remained strictly on observing structural interaction rather than anticipating outcomes.
As price continued to develop, the tool re-evaluated the evolving structure and identified a more recent trendline on the opposite side of price. This line was constructed from swings on the same structural side, incorporating a confirmed lower low followed by a developing higher low. These elements satisfy the minimum structural conditions required for trendline formation within the tool’s logic, illustrating how the framework adapts as new structure becomes available.
This example illustrates how the tool preserves existing structural references while tracking emerging ones, allowing trendlines to remain active reference levels as price evolves.
The diagram below extends the analysis by presenting a historical test of the same EURUSD H1 structure. This backtesting view applies the same structural logic—swing detection, ordering, and trendline construction—without modification, ensuring consistency between live and historical evaluation.
In this example, the descending resistance trendline is derived from swings on the same structural side, while an ascending support trendline emerges from ordered swings below price. Both lines are constructed strictly from validated structure and extended forward as rays, preserving their original slope and alignment. The interaction between price and these levels demonstrates how multiple structural references can coexist and evolve as market conditions change.
Rather than focusing on outcomes or trade scenarios, this illustration emphasizes how the tool maintains structural continuity across time. By applying identical rules in both live observation and historical replay, the behavior of price relative to established trendlines can be examined objectively, setting the stage for further discussion on structural persistence and adaptability as additional market data unfolds.

These observations reinforce the role of structure-driven trendlines as stable reference levels derived directly from price behavior. By relying on validated swings and disciplined construction rules, the tool preserves structural clarity while remaining adaptable to both live and historical market conditions.
Conclusion
This article formalizes the construction of slanted trendlines using price structure alone. By grounding derivation in ordered swings and strict validation rules, the approach reduces subjectivity while preserving structural consistency across market conditions.
The tool is intended primarily for analytical and educational use, complementing existing, confirmed tools and strategies by providing additional structural context rather than acting as a standalone decision framework.
Warning: All rights to these materials are reserved by MetaQuotes Ltd. Copying or reprinting of these materials in whole or in part is prohibited.
This article was written by a user of the site and reflects their personal views. MetaQuotes Ltd is not responsible for the accuracy of the information presented, nor for any consequences resulting from the use of the solutions, strategies or recommendations described.

- Free trading apps
- Over 8,000 signals for copying
- Economic news for exploring financial markets
You agree to website policy and terms of use