
MetaTrader 5 Machine Learning Blueprint (Part 2): Labeling Financial Data for Machine Learning

Table of Contents
- Introduction
- Overview of Labeling Methods
- Implementation: Triple-Barrier Labeling Method
- Meta-Labeling Reports: Bollinger Band Strategy
- Conclusion
Introduction
Picture this: You're training to become an elite sniper. Would you rather practice shooting at perfect circles on a paper target, or train with human-silhouette targets that mimic real combat scenarios? The answer is obvious—you need targets that reflect the reality you'll face.
The same principle applies to machine learning in finance. Most academic research uses what's called "fixed-time horizon labeling", the equivalent of shooting at those perfect circles. This approach asks a simple question: "Will the price be higher or lower in exactly X days?" But here's the problem: real traders don't just care about where the price ends up. They care about the journey, that being when their stop-loss gets hit, when they should take profits, and how the price moves along the way.
Welcome back to our MetaTrader 5 Machine Learning Blueprint series. In Part 1, we solved the critical "timestamp trap" that silently destroys most trading algorithms. Now we're tackling an equally important challenge: how to create labels that actually reflect how you trade in the real world.
Think of it this way: if you're building a model to predict whether someone will have a heart attack, you wouldn't just look at whether they're alive or dead in exactly 365 days. You'd want to know about warning signs, early interventions, and the sequence of events that are relevant for medical decisions. Financial markets work the same way.
This article assumes you already know your way around Python and have a basic grasp of machine learning concepts. We'll be diving deep into practical code and real-world applications that you can implement immediately.
Recap of Part 1: Data Leakage and Timestamp Fixes
In the first installment in the series, we addressed a critical but often overlooked issue that can silently undermine machine learning models in financial markets: the "timestamp trap" and data leakage problems inherent in the MetaTrader 5 default data structure. We laid the critical groundwork by addressing data integrity, emphasizing the necessity of constructing clean, unbiased bars from raw tick data. This foundation is non-negotiable for developing reliable financial machine learning models. If you haven't reviewed Part 1, we strongly recommend doing so before proceeding.
The foundation laid there ensures:
- Data Integrity: All timestamps reflect when information was actually available.
- Statistical Soundness: Activity-driven bars provide better statistical properties for ML models.
- Real-world Alignment: Bar construction matches actual market information flow.
With these fundamental data quality issues resolved, we now have clean, unbiased datasets ready for the next critical step in our machine learning pipeline—labeling techniques that truly capture market dynamics.
Overview of Labeling Methods
Most machine learning models in finance fail for a surprisingly mundane reason—not because of bad algorithms or insufficient computing power, but because of terrible labels. When I started building trading models, I spent months optimizing features and trying different neural network architectures, only to discover that my labeling scheme was fundamentally flawed. I was essentially teaching my model to hit a bullseye when I really needed it to hit a moving target in a hurricane.
Financial markets are relentlessly noisy. Every tick contains some mix of genuine information and random chaos, and our job is to extract the signal while acknowledging that most price movements are just market participants changing their minds or algorithms reacting to microsecond-level fluctuations. Good labeling doesn't just tell us what happened—it helps us understand what matters for actual trading decisions.
The simplest approach, and where most people start, is fixed-time horizon labeling. You pick a period—say five days—and ask whether the price will be higher or lower at the end of that period. If Apple closes at $150 on Monday and hits $155 by Friday, Monday gets labeled as a "buy" signal. It's clean, intuitive, and fundamentally wrong for how real trading works. When was the last time you bought a stock thinking, "I'll check back in exactly five days no matter what happens"? If the stock crashes 20% on Tuesday, you're not waiting until Friday to reassess. If it jumps 15% on Wednesday, you might take profits immediately.
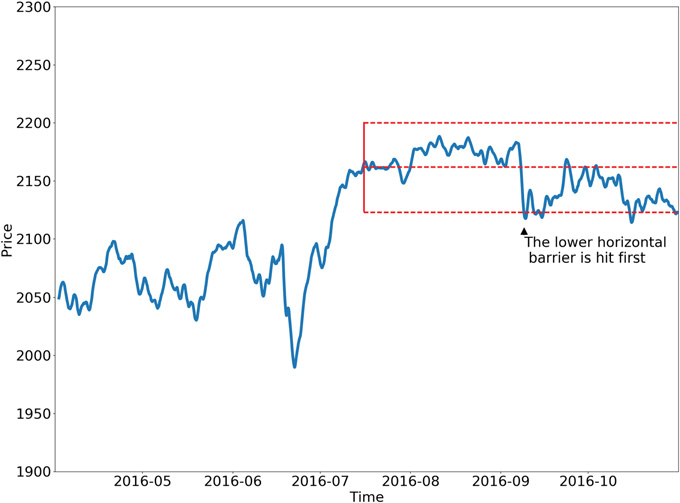
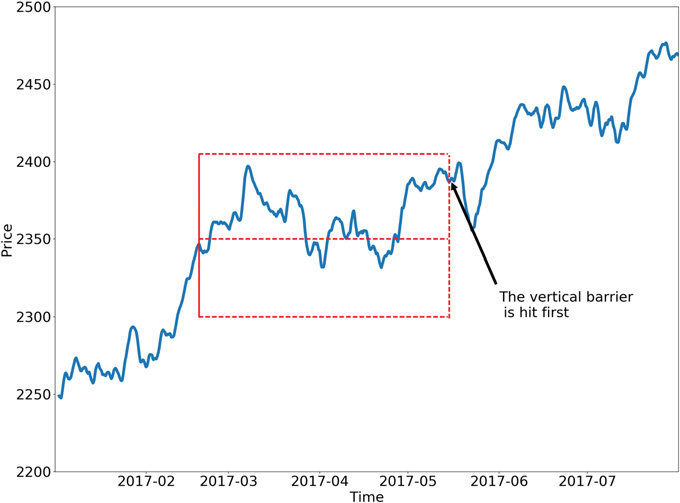
This brings us to the triple-barrier method, which changed how serious practitioners think about financial ML. Instead of arbitrary time horizons, you set up three barriers around each potential trade, just like a professional trader would. There's your profit target—maybe 5% above your entry price. There's your stop loss—perhaps 3% below where you bought. And there's a time limit because you don't want to hold losing positions forever. Your label depends on which barrier gets hit first. Suddenly, your model isn't learning abstract price movements; it's learning whether specific trade setups are likely to hit profit targets before hitting stop losses.
The beauty of this approach is that it mirrors actual trading psychology. Real traders don't care if a stock eventually goes up if it first drops enough to trigger their risk management rules. The path matters as much as the destination, and the triple-barrier method captures this path dependency naturally. You can even make the barriers dynamic—wider stops during volatile periods, tighter ones when markets are calm.
For markets where trends vary dramatically in length, trend-scanning methods offer an elegant solution. Instead of imposing a fixed timeframe, these algorithms test multiple forward-looking periods and identify the most statistically significant trend. Maybe the 5-day trend is weak, the 10-day trend is strong, and the 15-day trend is moderate. The method picks the strongest signal and labels accordingly. It's like having the algorithm itself determine the optimal prediction horizon for each market condition.
Then there's meta-labeling, which tackles an entirely different problem. Instead of predicting market direction, it asks: "When should I trust my other predictions?" Imagine you already have a trading strategy generating buy and sell signals. Meta-labeling builds a second model that evaluates whether each signal is likely to be profitable. Your main strategy might say "buy," but the meta-model considers additional factors—recent performance, market volatility, time since the last major news event—and outputs a confidence score. High confidence means you size the position aggressively. Low confidence means you pass or bet small.
This approach recognizes a crucial insight: knowing when you're likely to be right is often more valuable than trying to be right more often. It's the difference between being a good forecaster and being a profitable trader. Many strategies fail not because their directional predictions are poor, but because they bet the same amount on high-confidence and low-confidence signals.
Each labeling method teaches your model different lessons. Fixed-horizon methods focus on pure price direction. Triple-barrier methods incorporate risk management and path dependency. Trend-scanning adapts to varying market conditions. Meta-labeling optimizes conviction and position sizing. The method you choose fundamentally shapes what your model learns and how it behaves in live trading.
Key Considerations when Working with Financial Data
- Avoid Hindsight Bias: Ensure your labels are based only on information available up to the point of decision. For example, when labeling a data point for 'today', you can only use information from 'today' or earlier to determine features, and information from the 'future' (relative to 'today') to determine the label.
- Balance Your Classes: If you're labeling for 'buy', 'sell', and 'hold', you might find that 'hold' signals (or small movements) are far more frequent. Highly imbalanced classes can make it harder for ML models to learn the minority classes. Techniques exist to handle this (e.g., oversampling, undersampling, or using appropriate evaluation metrics).
- Volatility is Key: Financial markets have changing volatility. A 2% price move might be huge in a calm market but insignificant during a volatile period. Consider using volatility-adjusted thresholds for your labels (as in the Triple-Barrier Method).
- Stationarity: Financial time series are often non-stationary (their statistical properties like mean and variance change over time). While labeling itself doesn't directly make data stationary, the choice of labeling (e.g., labeling returns, which are often more stationary than prices) and subsequent feature engineering are crucial.
- Iterate and Refine: Your first labeling approach might not be the best. Be prepared to experiment with different methods, horizons, and thresholds to see what works best for your specific goals and the assets you're analysing.
Implementation: Triple-Barrier Labeling Method
Setting Dynamic Barriers
As argued in the previous section, in practice we want to set profit taking and stop-loss limits that are a function of the risks involved in a bet. Otherwise, sometimes we will be aiming too high (𝜏 ≫ 𝜎ti,0), and sometimes too low (𝜏 ≪ 𝜎ti,0), considering the prevailing volatility.
The code below calculates the daily volatility at intraday estimation points, applying a span of lookback days to an exponentially weighted moving standard deviation. This volatility will be used to set the profit-taking and stop-loss barriers.
def get_daily_vol(close, lookback=100):
    """
    Advances in Financial Machine Learning, Snippet 3.1, page 44.

    Daily Volatility Estimates

    Computes the daily volatility at intraday estimation points.

    In practice we want to set profit taking and stop-loss limits that are a function of the risks involved
    in a bet. Otherwise, sometimes we will be aiming too high (tao ≫ sigma_t_i,0), and sometimes too low
    (tao ≪ sigma_t_i,0), considering the prevailing volatility. Snippet 3.1 computes the daily volatility
    at intraday estimation points, applying a span of lookback days to an exponentially weighted moving
    standard deviation.

    See the pandas documentation for details on the pandas.Series.ewm function.
    Note: This function is used to compute dynamic thresholds for profit taking and stop loss limits.

    :param close: (pd.Series) Closing prices
    :param lookback: (int) Lookback period to compute volatility
    :return: (pd.Series) Daily volatility value
    """
    # Find previous valid trading day for each date
    prev_idx = close.index.searchsorted(close.index - pd.Timedelta(days=1))
    prev_idx = prev_idx[prev_idx > 0]  # Drop indices before the start

    # Align current and previous closes
    curr_idx = close.index[close.shape[0] - prev_idx.shape[0] :]
    prev_close = close.iloc[prev_idx - 1].values  # Previous day's close
    ret = close.loc[curr_idx] / prev_close - 1
    vol = ret.ewm(span=lookback).std()
    return vol
Setting Vertical Barriers
To set the vertical barriers we use the following function. When using activity-driven bars, it makes more sense to the barriers based on the number of bars to expiration rather than a fixed period as their can be extreme variability within a time horizon.
# Snippet 3.4 page 49, Adding a Vertical Barrier
def add_vertical_barrier(t_events, close, num_bars=0, **time_delta_kwargs):
    """
    Advances in Financial Machine Learning, Enhanced Implementation.

    Adding a Vertical Barrier

    For each event in t_events, finds the timestamp of the next price bar at or immediately after:
    - A fixed number of bars (for activity-based sampling), OR
    - A time delta (for time-based sampling)

    This function creates a series of vertical barrier timestamps aligned with the original events index.
    Out-of-bound barriers are marked with NaT for downstream handling.

    :param t_events: (pd.Series) Series of event timestamps (e.g., from symmetric CUSUM filter)
    :param close: (pd.Series) Close price series with DateTimeIndex
    :param num_bars: (int) Number of bars for vertical barrier (activity-based mode).
                     Takes precedence over time delta parameters when > 0.
    :param time_delta_kwargs: Time components for time-based barrier (mutually exclusive with num_bars):
        :param days: (int) Number of days
        :param hours: (int) Number of hours
        :param minutes: (int) Number of minutes
        :param seconds: (int) Number of seconds
    :return: (pd.Series) Vertical barrier timestamps with same index as t_events.
             Out-of-bound events return pd.NaT.

    Example:
        # Activity-bar mode (tick/volume/dollar bars)
        vertical_barriers = add_vertical_barrier(t_events, close, num_bars=10)

        # Time-based mode
        vertical_barriers = add_vertical_barrier(t_events, close, days=1, hours=3)
    """
    # Validate inputs
    if num_bars and time_delta_kwargs:
        raise ValueError("Use either num_bars OR time deltas, not both")

    # BAR-BASED VERTICAL BARRIERS
    if num_bars > 0:
        indices = close.index.get_indexer(t_events, method="nearest")
        t1 = []
        for i in indices:
            if i == -1:  # Event not found
                t1.append(pd.NaT)
            else:
                end_loc = i + num_bars
                t1.append(close.index[end_loc] if end_loc < len(close) else pd.NaT)
        return pd.Series(t1, index=t_events)

    # TIME-BASED VERTICAL BARRIERS
    td = pd.Timedelta(**time_delta_kwargs) if time_delta_kwargs else pd.Timedelta(0)
    barrier_times = t_events + td

    # Find next index positions
    t1_indices = np.searchsorted(close.index, barrier_times, side="left")
    t1 = []
    for idx in t1_indices:
        if idx < len(close):
            t1.append(close.index[idx])
        else:
            t1.append(pd.NaT)  # Mark out-of-bound for downstream

    return pd.Series(t1, index=t_events)
Applying Triple-Barrier Labeling
The triple-barrier method is inherently path-dependent, meaning we can't just look at the final price to determine our label. Instead, we need to track the entire price journey from when we enter a position until we exit, whether that's due to hitting a profit target, stop loss, or time limit.
When we apply the triple-barrier method, we're essentially asking: "Starting from time ti,0, what happens first as we move forward in time?" The process continues until we reach ti,1, which represents the moment the first barrier gets touched. This could be our profit target, our stop loss, or our maximum holding period (the vertical barrier set at ti,0 + h). The return we use for labeling is calculated from our entry point ti,0 to this first touch time ti,1.
The function apply_pt_sl_on_t1() implements this logic and requires several inputs to work properly. First, it needs the close price series so it can track the actual price path. The events dataframe contains the essential information for each potential trade: the t1 column specifies when each trade should expire (the vertical barrier), while the trgt column defines how wide our horizontal barriers should be.
The pt_sl parameter is particularly important. It's a two-element list that controls the barrier widths. The first element (pt_sl[0]) sets how many multiples of the target width to use for the profit-taking barrier, while the second element (pt_sl[1]) does the same for the stop-loss barrier. If either value is zero, that particular barrier is disabled. This flexibility allows you to create asymmetric risk/reward setups. For example, you might set a tight stop loss but let profits run further.
The function processes these barriers systematically, tracking price movements bar by bar until one of the barriers is breached, giving us the precise timing and return information needed for accurate labeling.
# Snippet 3.2, page 45, Triple Barrier Labeling Method
def apply_pt_sl_on_t1(close, events, pt_sl, molecule):
    """
    Advances in Financial Machine Learning, Snippet 3.2, page 45.

    Triple Barrier Labeling Method

    This function applies the triple-barrier labeling method. It works on a set of
    datetime index values (molecule). This allows the program to parallelize the processing.

    Mainly it returns a DataFrame of timestamps regarding the time when the first barriers were reached.

    :param close: (pd.Series) Close prices
    :param events: (pd.Series) Indices that signify "events" (see cusum_filter function for more details)
    :param pt_sl: (np.array) Element 0, indicates the profit taking level; Element 1 is stop loss level
    :param molecule: (an array) A set of datetime index values for processing
    :return: (pd.DataFrame) Timestamps of when first barrier was touched
    """
    # Apply stop loss/profit taking, if it takes place before t1 (end of event)
    events = events.loc[molecule].copy()
    out = events[["t1"]].copy(deep=True)

    profit_taking_multiple = pt_sl[0]
    stop_loss_multiple = pt_sl[1]

    # Profit taking active
    if profit_taking_multiple > 0:
        profit_taking = np.log(1 + profit_taking_multiple * events["trgt"])
    else:
        profit_taking = pd.Series(index=events.index)  # NaNs

    # Stop loss active
    if stop_loss_multiple > 0:
        stop_loss = np.log(1 - stop_loss_multiple * events["trgt"])
    else:
        stop_loss = pd.Series(index=events.index)  # NaNs

    # Use dictionary to collect barrier hit times
    barrier_dict = {"sl": {}, "pt": {}}

    # Get events
    for loc, vertical_barrier in events["t1"].fillna(close.index[-1]).items():
        closing_prices = close[loc:vertical_barrier]  # Path prices for a given trade
        cum_returns = np.log(closing_prices / close[loc]) * events.at[loc, "side"]  # Path returns
        barrier_dict["sl"][loc] = cum_returns[
            cum_returns < stop_loss[loc]
        ].index.min()  # Earliest stop loss date
        barrier_dict["pt"][loc] = cum_returns[
            cum_returns > profit_taking[loc]
        ].index.min()  # Earliest profit taking date

    # Convert dictionary to DataFrame and join to `out`
    barrier_df = pd.DataFrame(barrier_dict)
    out = out.join(barrier_df)  # Join on index (loc)

    return out
The triple-barrier method offers eight possible configurations, depending on which barriers you activate. Think of each setup as [profit_target, stop_loss, time_limit], where 1 means active and 0 means disabled.
- Most practical trading strategies use one of three configurations:
- [1,1,1] - The Complete Setup: All three barriers active. You're seeking profits while managing both downside risk and holding period. This mirrors how most professional traders actually operate.
- [0,1,1] - Let Winners Run: No profit target, but you'll exit after X periods unless stopped out first. Perfect for momentum strategies where you want to ride trends.
- [1,1,0] - No Time Pressure: Profit target and stop loss active, but no time limit. You'll hold until one of the price barriers is hit, however long that takes.
- Three technically possible but less realistic configurations:
- [0,0,1] - Fixed Horizon: Just time-based exits. This is essentially fixed-time horizon labeling, though it can work with activity-driven bars.
- [1,0,1] - Ignore Losses: Hold until profitable or time runs out, regardless of intermediate losses. Dangerous for risk management.
- [1,0,0] - Hold Forever: No stop loss or time limit. Keep losing positions until they eventually become profitable—a recipe for portfolio destruction.
- Two essentially useless configurations:
- [0,1,0] - Expecting Failure: Hold positions until they hit the stop loss. Why enter trades expecting only losses?
- [0,0,0] - No Exit: All barriers disabled. Positions never close and no labels are generated.
Below are two possible configurations of the triple-barrier method.
Learning for Side and Size
The functions in this section utilize the triple-barrier method to either learn the side, {1, 0, -1}, when side_prediction=None in get_events(), or to learn the size from the meta-labeled data when the side is known. Learning the side of the bet implies that there are no horizontal barriers, or that the horizontal barriers are symmetric. This is because we cannot differentiate between the profit-taking and stop-loss barriers at this point. Once side is known, we can optimize the barriers to find what combination results in the most performant model. We get the dates of the first barrier touched by running get_events().
# Snippet 3.3 -> 3.6 page 50, Getting the Time of the First Touch, with Meta Labels
def get_events(close, t_events, pt_sl, target, min_ret, num_threads, vertical_barrier_times=False,
               side_prediction=None, verbose=True):
    """
    Advances in Financial Machine Learning, Snippet 3.6 page 50.

    Getting the Time of the First Touch, with Meta Labels

    This function is orchestrator to meta-label the data, in conjunction with the Triple Barrier Method.

    :param close: (pd.Series) Close prices
    :param t_events: (pd.Series) of t_events. These are timestamps that will seed every triple barrier.
        These are the timestamps selected by the sampling procedures discussed in Chapter 2, Section 2.5.
        E.g.: CUSUM Filter
    :param pt_sl: (list) Element 0, indicates the profit taking level; Element 1 is stop loss level.
        A non-negative float that sets the width of the two barriers. A 0 value means that the respective
        horizontal barrier (profit taking and/or stop loss) will be disabled.
    :param target: (pd.Series) of values that are used (in conjunction with pt_sl) to determine the width
        of the barrier. In this program this is daily volatility series.
    :param min_ret: (float) The minimum target return required for running a triple barrier search.
    :param num_threads: (int) The number of threads concurrently used by the function.
    :param vertical_barrier_times: (pd.Series) A pandas series with the timestamps of the vertical barriers.
        We pass a False when we want to disable vertical barriers.
    :param side_prediction: (pd.Series) Side of the bet (long/short) as decided by the primary model
    :param verbose: (bool) Flag to report progress on asynch jobs
    :return: (pd.DataFrame) Events
            -events.index is event's starttime
            -events['t1'] is event's endtime
            -events['trgt'] is event's target
            -events['side'] (optional) implies the algo's position side
            -events['pt'] is profit taking multiple
            -events['sl']  is stop loss multiple
    """

    # 1) Get target
    target = target.reindex(t_events)
    target = target[target > min_ret]  # min_ret

    # 2) Get vertical barrier (max holding period)
    if vertical_barrier_times is False:
        vertical_barrier_times = pd.Series(pd.NaT, index=t_events, dtype=t_events.dtype)

    # 3) Form events object, apply stop loss on vertical barrier
    if side_prediction is None:
        side_ = pd.Series(1.0, index=target.index)
        pt_sl_ = [pt_sl[0], pt_sl[0]]
    else:
        side_ = side_prediction.reindex(target.index)  # Subset side_prediction on target index.
        pt_sl_ = pt_sl[:2]

    # Create a new df with [v_barrier, target, side] and drop rows that are NA in target
    events = pd.concat({'t1': vertical_barrier_times, 'trgt': target, 'side': side_}, axis=1)
    events = events.dropna(subset=['trgt'])

    # Apply Triple Barrier
    first_touch_dates = mp_pandas_obj(func=apply_pt_sl_on_t1,
                                      pd_obj=('molecule', events.index),
                                      num_threads=num_threads,
                                      close=close,
                                      events=events,
                                      pt_sl=pt_sl_,
                                      verbose=verbose)

    for ind in events.index:
        events.at[ind, 't1'] = first_touch_dates.loc[ind, :].dropna().min()

    if side_prediction is None:
        events = events.drop('side', axis=1)

    # Add profit taking and stop loss multiples for vertical barrier calculations
    events['pt'] = pt_sl[0]
    events['sl'] = pt_sl[1]

    return events
We use get_bins() to return a dataframe events where:
- events.index is event's start time
- events['t1'] is event's end time
- events['trgt'] is event's target
- events['side'] (optional) implies the strategy's position side
- Case 1: If 'side' not in events → bin ∈ {-1, 1} (label by price action)
- Case 2: If 'side' is present → bin ∈ {0, 1} (label by PnL — meta-labeling)
# Snippet 3.4 -> 3.7, page 51, Labeling for Side & Size with Meta Labels
def get_bins(triple_barrier_events, close, vertical_barrier_zero=False, pt_sl=[1, 1]):
    """
    Advances in Financial Machine Learning, Snippet 3.7, page 51.

    Labeling for Side & Size with Meta Labels

    Compute event's outcome (including side information, if provided).
    events is a DataFrame where:

    Now the possible values for labels in out['bin'] are {0,1}, as opposed to whether to take the bet or pass,
    a purely binary prediction. When the predicted label the previous feasible values {−1,0,1}.
    The ML algorithm will be trained to decide is 1, we can use the probability of this secondary prediction
    to derive the size of the bet, where the side (sign) of the position has been set by the primary model.

    :param triple_barrier_events: (pd.DataFrame) Events DataFrame with the following structure:
    - **index**: pd.DatetimeIndex of event start times
    - **t1**: (pd.Series) Event end times
    - **trgt**: (pd.Series) Target returns
    - **side**: (pd.Series, optional) Algo's position side
      Labeling behavior depends on the presence of 'side':
        - Case 1: If 'side' not in events → `bin ∈ {-1, 1}` (label by price action)
        - Case 2: If 'side' is present    → `bin ∈ {0, 1}`  (label by PnL — meta-labeling)
    :param close: (pd.Series) Close prices
    :param vertical_barrier_zero: (bool) If True, set bin to 0 for events that touch vertical barrier, else bin is the sign of the return.
    :param pt_sl: (list) Take-profit and stop-loss multiples
    :return: (pd.DataFrame) Meta-labeled events
    :returns index: Event start times
    :returns t1: Event end times
    :returns trgt: Target returns
    :returns side: Optional. Algo's position side
    :returns ret: Returns of the event
    :returns bin: Labels for the event, where 1 is a positive return, -1 is a negative return, and 0 is a vertical barrier hit
    """

    # 1. Align prices with their respective events
    events = triple_barrier_events.dropna(subset=["t1"])
    all_dates = events.index.union(other=events["t1"].array).drop_duplicates()
    prices = close.reindex(all_dates, method="bfill")

    # 2. Create out DataFrame
    out_df = events[["t1"]].copy()
    out_df["ret"] = np.log(prices.loc[events["t1"].array].array / prices.loc[events.index])
    out_df["trgt"] = events["trgt"]

    # Meta labeling: Events that were correct will have pos returns
    if "side" in events:
        out_df["ret"] *= events["side"]  # meta-labeling

    if vertical_barrier_zero:
        # Label 0 when vertical barrier reached
        out_df["bin"] = barrier_touched(
            out_df["ret"].values,
            out_df["trgt"].values,
            np.array(pt_sl, dtype=float),
        )
    else:
        # Label is the sign of the return
        out_df["bin"] = np.where(out_df["ret"] > 0, 1, -1).astype("int8")

    # Meta labeling: label incorrect events with a 0
    if "side" in events:
        out_df.loc[out_df["ret"] <= 0, "bin"] = 0

    # Add the side to the output. This is useful for when a meta label model must be fit
    if "side" in triple_barrier_events.columns:
        out_df["side"] = triple_barrier_events["side"].astype("int8")

    out_df["ret"] = np.exp(out_df["ret"]) - 1  # Convert log returns to simple returns
    return out_df
NOTE: mp_pandas_obj() as used above is a helper function that facilitates parallel processing when working with pandas objects (pandas always runs on a single CPU). The attachment multiprocess.py contains this function, and other multiprocessing helpers.
To set the label to zero when a vertical barrier is touched, we call barrier_touched() inget_bins().
# Snippet 3.9, page 55, Question 3.3
def barrier_touched(ret, target, pt_sl):
    """
    Advances in Financial Machine Learning, Snippet 3.9, page 55, Question 3.3.

    Adjust the getBins function (Snippet 3.7) to return a 0 whenever the vertical barrier is the one touched first.

    Top horizontal barrier: 1
    Bottom horizontal barrier: -1
    Vertical barrier: 0

    :param ret: (np.array) Log-returns
    :param target: (np.array) Volatility target
    :param pt_sl: (ArrayLike) Take-profit and stop-loss multiples
    :return: (np.array) Labels
    """
    N = ret.shape[0]  # Number of events
    store = np.empty(N, dtype=np.int8)  # Store labels in an array

    profit_taking_multiple = pt_sl[0]
    stop_loss_multiple = pt_sl[1]

    # Iterate through the DataFrame and check if the vertical barrier was reached
    for i in range(N):
        pt_level_reached = ret[i] > np.log(1 + profit_taking_multiple * target[i])
        sl_level_reached = ret[i] < np.log(1 - stop_loss_multiple * target[i])

        if ret[i] > 0.0 and pt_level_reached:
            # Top barrier reached
            store[i] = 1
        elif ret[i] < 0.0 and sl_level_reached:
            # Bottom barrier reached
            store[i] = -1
        else:
            # Vertical barrier reached
            store[i] = 0

    return store
When to Label as Zero or as Sign of Return
Labeling a non‐touch event as zero makes sense when you want your model to focus strictly on clear risk‐managed outcomes, whereas using the return’s sign at the horizon captures all directional drift, even if your risk thresholds are not breached.
Label as zero if:
- You’re building a three‐class classifier (up, down, neutral) and want “neutral” to mean “no decisive move” within your risk limits.
- You prefer to filter out ambiguous signals—small drifts that never touch either barrier—from training.
- You want to measure event success purely by hitting your predefined profit or loss thresholds, ignoring all other cases.
Label as sign of return if:
- You need every sample to carry a binary direction (up/down) for a two‐class problem and want to avoid an over-abundance of neutral labels.
- You’re modeling momentum or time-horizon returns rather than strictly risk-controlled exits.
- You believe price movement—no matter how small—is informative and should influence your estimator.
Beyond this choice, consider how it affects class balance and label noise. If you see too many zeros, you might undersample neutrals or raise your horizontal barriers, and if your sign-of-return labels are too noisy, you could apply a minimum return threshold before assigning +1/−1.
Event-Based Sampling
As traders, we don't just randomly decide when to buy or sell securities. Instead, we wait for specific things to happen in the market before making their moves. These "trigger events" might include:
- When important economic data gets released (like employment numbers or inflation reports)
- When market prices suddenly become very unstable
- When the price difference between related investments moves far away from what's normally expected
Once one of these events happens, we treat it as a signal that something important might be occurring in the market. We can then let our ML algorithms figure out if their is an accurate prediction function under those circumstances.
The key idea is to learn whether there's an accurate way to predict market movements specifically when these events occur. If the algorithm shows that a particular type of event doesn't lead to accurate predictions, then we need to either change how we define what counts as a significant event, or try again using different features as inputs to the model.
The CUSUM Filter
A powerful technique for event-based sampling is the CUSUM filter, a quality-control method used to detect shifts in the mean value of a measured quantity. In finance, we can adapt this filter to sample data points whenever a significant deviation in a market variable, like price, occurs. The CUSUM filter works by accumulating deviations from an expected value and triggering a sampling event when this accumulation surpasses a certain threshold.
The symmetric CUSUM filter is defined as follows:
-
S⁺ = max(0, S⁺ + ΔP)
-
S⁻ = min(0, S⁻ + ΔP)
Where ΔP is the price change. An event is triggered when either S⁺ surpasses a positive threshold h or S⁻ falls below a negative threshold -h. When an event is triggered, the corresponding accumulator is reset. This method avoids triggering multiple events when the price hovers around a threshold, a flaw common in popular market signals such as Bollinger bands. By using a CUSUM filter, we can create a feature matrix X that is sampled at moments of significant market activity, providing more relevant data for our ML models.
# Snippet 2.4, page 39, The Symmetric CUSUM Filter.
def cusum_filter(raw_time_series, threshold, time_stamps=True):
    """
    Advances in Financial Machine Learning, Snippet 2.4, page 39.

    The Symmetric Dynamic/Fixed CUSUM Filter.

    The CUSUM filter is a quality-control method, designed to detect a shift in the mean value of a measured quantity
    away from a target value. The filter is set up to identify a sequence of upside or downside divergences from any
    reset level zero. We sample a bar t if and only if S_t >= threshold, at which point S_t is reset to 0.

    One practical aspect that makes CUSUM filters appealing is that multiple events are not triggered by raw_time_series
    hovering around a threshold level, which is a flaw suffered by popular market signals such as Bollinger Bands.
    It will require a full run of length threshold for raw_time_series to trigger an event.

    Once we have obtained this subset of event-driven bars, we will let the ML algorithm determine whether the occurrence
    of such events constitutes actionable intelligence. Below is an implementation of the Symmetric CUSUM filter.

    Note: As per the book this filter is applied to closing prices but we extended it to also work on other
    time series such as volatility.

    :param raw_time_series: (pd.Series) Close prices (or other time series, e.g. volatility).
    :param threshold: (float or pd.Series) When the abs(change) is larger than the threshold, the function captures
                      it as an event, can be dynamic if threshold is pd.Series
    :param time_stamps: (bool) Default is to return a DateTimeIndex, change to false to have it return a list.
    :return: (datetime index vector) Vector of datetimes when the events occurred. This is used later to sample.
    """

    t_events = []
    s_pos = 0
    s_neg = 0

    # log returns
    raw_time_series = pd.DataFrame(raw_time_series)  # Convert to DataFrame
    raw_time_series.columns = ['price']
    raw_time_series['log_ret'] = raw_time_series.price.apply(np.log).diff()
    if isinstance(threshold, (float, int)):
        raw_time_series['threshold'] = threshold
    elif isinstance(threshold, pd.Series):
        raw_time_series.loc[threshold.index, 'threshold'] = threshold
    else:
        raise ValueError('threshold is neither float nor pd.Series!')

    raw_time_series = raw_time_series.iloc[1:]  # Drop first na values

    # Get event time stamps for the entire series
    for tup in raw_time_series.itertuples():
        thresh = tup.threshold
        pos = float(s_pos + tup.log_ret)
        neg = float(s_neg + tup.log_ret)
        s_pos = max(0.0, pos)
        s_neg = min(0.0, neg)

        if s_neg < -thresh:
            s_neg = 0
            t_events.append(tup.Index)

        elif s_pos > thresh:
            s_pos = 0
            t_events.append(tup.Index)

    # Return DatetimeIndex or list
    if time_stamps:
        event_timestamps = pd.DatetimeIndex(t_events)
        return event_timestamps

    return t_events
Let us analyze how a mean-reverting Bollinger band strategy performs when we use unfiltered versus CUSUM-filtered entry signals. We will use EURUSD 5-minute time-bars from 2018-01-01 to 2021-12-31 for training and validation, and data from 2022-01-01 to 2024-12-31 for out-of-sample testing.
For the purposes of this demonstration, we will use a deliberately sensitive Bollinger Band configuration (20-period, 1.5 standard deviations) to generate a high volume of trade signals for the meta-model to evaluate. While this would be overly noisy for a standalone strategy, it provides an ideal stress test for our labeling and filtering pipeline.
To ensure consistency and interoperability across all strategies, I prefer to structure them using Python’s object-oriented design—specifically through a shared interface or base class. This approach allows each strategy to expose the same core functionality (e.g., signal generation, event filtering), making it easier to compare, extend, and integrate them within broader workflows. Using TA-Lib and Pandas TA for the generation of commonly used signals is beneficial as it implements industry-standard formulas, is built on a highly optimized C backend, making it 2–4x faster than equivalent Python implementations, and ensures outputs are standardized and edge cases are handled consistently, which simplifies downstream tasks like labeling, filtering, or visualization. This library can sometimes be challenging to install, so I suggest following the instructions in this article.
import pandas as pd
from typing import Tuple, Union
import logging

from abc import ABC, abstractmethod
from typing import Dict, Tuple, Union

import numpy as np
import pandas as pd
import talib
from loguru import logger

class BaseStrategy(ABC):
    """Abstract base class for trading strategies"""

    @abstractmethod
    def generate_signals(self, data: pd.DataFrame) -> pd.Series:
        """Generate trading signals (1 for long, -1 for short, 0 for no position)"""
        pass

    @abstractmethod
    def get_strategy_name(self) -> str:
        """Return strategy name"""
        pass

    @abstractmethod
    def get_objective(self) -> str:
        """Return strategy objective"""
        pass

class BollingerMeanReversionStrategy(BaseStrategy):
    """Bollinger Bands mean reversion strategy"""

    def __init__(self, window: int = 20, num_std: float = 2.0, objective: str = "mean_reversion"):
        self.window = window
        self.num_std = num_std
        self.objective = objective

    def generate_signals(self, data: pd.DataFrame) -> pd.Series:
        """Generate mean-reversion signals using Bollinger Bands"""
        close = data["close"]

        # Calculate Bollinger Bands
        upper_band, _, lower_band = talib.BBANDS(
            close, timeperiod=self.window, nbdevup=self.num_std, nbdevdn=self.num_std
        )

        # Generate signals
        signals = pd.Series(0, index=data.index, dtype="int8", name="side")
        signals[(close >= upper_band)] = -1  # Sell signal (mean reversion)
        signals[(close <= lower_band)] = 1  # Buy signal (mean reversion)
        return signals

    def get_strategy_name(self) -> str:
        return f"Bollinger_w{self.window}_std{self.num_std}"

    def get_objective(self) -> str:
        return self.objective

def get_entries(
    strategy: 'BaseStrategy',
    data: pd.DataFrame,
    filter_events: bool = False,
    filter_threshold: Union[float, pd.Series] = None,
    on_crossover: bool = True,
) -> Tuple[pd.Series, pd.DatetimeIndex]:
    """Get timestamps and position information for entry events.

    This function processes signals from a given `BaseStrategy` to identify trade
    entry points. It can apply a CUSUM filter to isolate significant events or,
    by default, detect entries at signal crossover points.

    Args:
        strategy (BaseStrategy): The trading strategy object that generates the
            primary signals.
        data (pd.DataFrame): A pandas DataFrame containing the input data, expected
            to have a 'close' column if `filter_events` is True.
        filter_events (bool, optional): If True, a CUSUM filter is applied to the
            signals to identify significant events. Defaults to False.
        filter_threshold (Union[float, pd.Series], optional): The threshold for the
            CUSUM filter. Must be a float or a pandas Series. Defaults to None.
        on_crossover (bool, optional): If True, only events where the signal changes
            from the previous period are considered entry points. Defaults to True.

    Raises:
        ValueError: If `filter_events` is True and `filter_threshold` is not a
            `float` or `pd.Series`.

    Returns:
        Tuple[pd.Series, pd.DatetimeIndex]: A tuple containing:
            side (pd.Series): A Series with the same index as the input data,
                where each value represents the trading position (-1 for short,
                1 for long, 0 for no position).
            t_events (pd.DatetimeIndex): A DatetimeIndex of the timestamps for
                each detected entry event.
    """
    primary_signals = strategy.generate_signals(data)
    signal_mask = primary_signals != 0

    # Vectorized CUSUM filter application
    if filter_events:
        try:
            close = data.close
        except AttributeError as e:
            logger.error(f"Dataframe must have a 'close' column: {e}")
            raise e

        if not isinstance(filter_threshold, (pd.Series, float)):
            raise ValueError("filter_threshold must be a Series or a float")
        elif isinstance(filter_threshold, pd.Series):
            filter_threshold = filter_threshold.copy().dropna()
            close = close.reindex(filter_threshold.index)

        # Assuming cusum_filter is a function that takes a Series and a threshold
        filtered_events = cusum_filter(close, filter_threshold)
        signal_mask &= primary_signals.index.isin(filtered_events)
    else:
        # Vectorized signal change detection
        if on_crossover:
            signal_mask &= primary_signals != primary_signals.shift()

    t_events = primary_signals.index[signal_mask]

    side = pd.Series(index=data.index, name="side")
    side.loc[t_events] = primary_signals.loc[t_events]
    side = side.ffill().fillna(0).astype("int8")

    if filter_events:
        s = " generated by CUSUM filter"
    elif on_crossover:
        s = " generated by crossover"
    else:
        s = ""

    logger.info(f"Generated {len(t_events):,} trade events{s}.")

    return side, t_events
Feature Engineering for Meta-Labeling
To capture the nuanced dynamics of financial time series, we constructed a rich feature set that blends statistical rigor with domain-specific insight. This includes volatility-adjusted momentum indicators, autocorrelation structures, and higher-order return moments (skewness and kurtosis), alongside Bollinger-derived metrics and normalized moving average differentials. Technical signals such as RSI, MACD, ADX, and ATR were extracted using TA-Lib and pandas-ta, ensuring consistency and reproducibility. By incorporating both short-term and long-horizon features—spanning lagged returns, Yang-Zhang volatility estimates, and trend-following indicators—the model is equipped to detect subtle shifts in market behavior and respond to evolving trading conditions. The code can be found in the attachment features.py.
To illustrate the effectiveness of the CUSUM-filter, I trained a random forest using unfiltered and filtered signals on our EURUSD M5 data. My horizontal barriers were set using the exponentially weighted daily volatility over 100 days as my target, and setting the profit-taking barrier to 1 and the stop-loss barrier to 2. My vertical barrier was set to 50 bars.
target = get_daily_vol(close, lookback=100)
cusum_filter_threshold = target.mean()
Effects of Filtering Data
Before diving into our model comparisons, here’s a quick primer on the key metrics reported in each classification table:- Precision: Percentage of correct positive predictions out of all positive calls. High precision means few false alarms.
- Recall: Percentage of actual positives correctly identified. High recall means few missed events.
- F1-score: Accuracy may not be an adequate classification score for meta-labeling applications. Suppose that, after you apply meta-labeling, there are many more negative cases (label ‘0’) than positive cases (label ‘1’). Under that scenario, a classifier that predicts every case to be negative will achieve high accuracy, even though recall=0 and precision is undefined. The F1 score corrects for that flaw, by assessing the classifier in terms of the (equally weighted) harmonic mean of precision and recall.
- Support: The number of instances for each class in the validation set.
- Accuracy: Overall fraction of correct predictions across all classes.
For an in-depth walkthrough of these metrics, see "How to Interpret the Classification Report in sklearn".
Before we compare any scores, note how the CUSUM filter slashes sample size by 76.1%.
| Unfiltered Signals | Filtered Signals | Reduction % |
|---|---|---|
| 32828 | 7825 | 76.1 |
TABLE 0: Signal Count - Filtered vs. Unfiltered
The CUSUM filter aims to discard "noise," which is intrinsically linked to class 0 dynamics. The ideal outcome is an improved F1 for class 1 (better event capture), while maintaining F1 for class 0 (no added false signals). Our filtered primary model is ideal, but our filtered meta-model experiences a 5.8% decrease in the F1 for class 0. To mitigate this, we could tune the hyper-parameters used in the model, or alter our feature set.
| Metric | Unfiltered | Filtered | Δ |
|---|---|---|---|
| Recall (1) | 1.00 | 1.00 | 0% |
| Precision (1) | 0.33 | 0.38 | +15.2% |
| F1 (1) | 0.49 | 0.55 | +11.0% |
| Metric | Unfiltered | Filtered | Δ |
|---|---|---|---|
| F1 (0) | 0.69 | 0.65 | -5.8% |
| F1 (1) | 0.57 | 0.60 | +5.3% |
| Accuracy | 0.64 | 0.63 | -1.6% |
Table 4: Comparison of Filtered and Unfiltered Meta-Models
The trade-off between data reduction and model performance can be calculated as:
- performance retention = filtered performance / unfiltered performance * 100
- net benefit = performance retention - data reduction
If we obtain a positive net benefit, then the filter is efficient and should be used.
| Model | Data Reduction | Performance Retention | Net Benefit |
|---|---|---|---|
| Primary | 76.1% | 112.2% | +36.1% |
| Meta | 76.1% | 98.5% | +22.4% |
Table 5: Trade-off Analysis
We gain the following insights from comparing the unfiltered and filtered signals:
- The CUSUM filter successfully discarded 76.1% of events as noise.
- Filtering improved precision in both the primary model and meta-model.
- Filtering only slightly degraded overall performance of the meta-model despite 76% less data. There was a 5.3% gain for class 1, and a 5.6% drop for class 0, and despite the drop in class 0 F1, we still realised a net benefit of from using the CUSUM filter.
Meta-Labeling Reports: Bollinger Band Strategy
The classification reports and ROC curves below underscore a key insight: meta-labeling thrives when paired with realistic, risk-aware labeling schemes.

Figure 1: Fixed-Time Horizon Primary Model Classification Report

Figure 2: Fixed-Time Horizon Meta-Model Classification Report

Figure 3: Triple-Barrier Primary Model Classification Report

Figure 4: Triple-Barrier Meta-Model Classification Report
Receiver Operating Characteristic Curves

Figure 5: ROC for Fixed-Time Horizon and Triple-Barrier Meta-Models
Result Interpretation: Decoding the Model's Performance
The stark contrast in these results validates the core thesis: labeling defines success. The Fixed-Time Horizon model's classification report reveals a fundamental failure to learn; its inability to distinguish signals above randomness is graphically confirmed by its ROC curve clinging to the diagonal, a hallmark of a useless classifier. In contrast, the Triple-Barrier method's report shows a model that has successfully identified predictive patterns, a fact underscored by its ROC curve's pronounced bow towards the top-left corner, indicating a significant trade-off between true and false positive rates. This ROC AUC value, significantly above 0.5, demonstrates the model's tangible predictive power.
More importantly, the precision metrics translate directly to trading reality: a higher precision for the '1' class means a greater proportion of our predicted profitable trades (meta-labels) are likely to be correct, thereby increasing the potential profitability of the strategy and providing a concrete statistical foundation for confidence-based position sizing.
Economic Significance: Out-of-Sample Performance
While the Triple-Barrier model showed a statistically significant improvement in AUC, its true value is revealed in the simulated equity curve. Figure 7 shows that the strategy leveraging our new labeling method achieved a -0.03% return with a maximum drawdown of 36.9%, significantly outperforming the benchmark Fixed-Horizon strategy, which achieved a -0.71% return with a maximum drawdown of 76%.

Figure 6: Fixed-Time Horizon Performance Equity Curve

Figure 7: Triple-Barrier Strategy Performance Equity Curve
Below is a comprehensive table of the performance metrics for each labeling method:
| Metrics | Fixed-Time Horizon | Triple-Barrier |
|---|---|---|
| total_return | -0.709771 | -0.028839 |
| annualized_return | -0.338102 | -0.009714 |
| volatility | 0.483111 | 0.37613 |
| downside_volatility | 0.336945 | 0.231413 |
| sharpe_ratio | -4.778646 | -0.021566 |
| sortino_ratio | -6.851611 | -0.035053 |
| var_95 | -0.002864 | -0.00215 |
| cvar_95 | -0.004164 | -0.002992 |
| skewness | -0.014451 | 0.034745 |
| kurtosis | 3.857222 | 2.507046 |
| max_drawdown | 0.761708 | 0.368585 |
| avg_drawdown | 0.08375 | 0.039945 |
| drawdown_duration | 84 days 01:18:50 | 32 days 03:17:12 |
| ulcer_index | 0.217503 | 0.098507 |
| calmar_ratio | -0.443874 | -0.026354 |
| bet_frequency | 3901 | 3969 |
| bets_per_year | 1300.040115 | 1322.701671 |
| num_trades | 37691 | 27426 |
| trades_per_year | 12560.83363 | 9139.93853 |
| win_rate | 0.497546 | 0.504339 |
| avg_win | 0.001266 | 0.001081 |
| avg_loss | -0.001322 | -0.001105 |
| best_trade | 0.014599 | 0.01451 |
| worst_trade | -0.013828 | -0.010548 |
| profit_factor | 0.952754 | 0.999799 |
| expectancy | -0.000034 | -0.000002 |
| kelly_criterion | -0.027194 | -0.002226 |
| consecutive_wins | 77 | 92 |
| consecutive_losses | 66 | 90 |
| avg_trade_duration | 0 days 00:39:18 | 0 days 06:22:15 |
Table 6: Out-of-sample Performance Metrics
Conclusion
In this second installment of the MetaTrader 5 Machine Learning Blueprint, we’ve explored how labeling choices shape the behavior and reliability of financial models. By moving beyond fixed-time horizons and embracing path-dependent techniques like the triple-barrier method, we’ve shown how to encode risk-awareness and realistic trade dynamics directly into the learning process.
Meta-labeling emerged as a strategic overlay that filters low-conviction signals and enhances precision—especially when paired with robust labeling schemes. The classification reports and ROC curves demonstrate how this layered approach improves signal quality, even under aggressive filtering.
But our journey is far from over.
In the next article, we’ll implement the trend-scanning method, which allows models to dynamically select their prediction horizon based on statistically significant price movements. This unlocks a new level of adaptability in volatile markets.
We’ll also tackle the challenge of concurrency in financial data—where multiple signals overlap in time—by introducing sample weights that reflect the uniqueness and relevance of each observation. This ensures that our models learn from truly independent signals, not redundant noise.
Finally, we’ll explore how to leverage the probabilities generated by meta-labeling to size bets more intelligently. Instead of binary execution, we’ll use probabilistic confidence to scale position sizes—aligning model conviction with capital allocation.
Together, these enhancements will bring us closer to a production-grade machine learning pipeline for financial markets—one that’s not only technically sound, but strategically aligned with real-world trading behavior.
Warning: All rights to these materials are reserved by MetaQuotes Ltd. Copying or reprinting of these materials in whole or in part is prohibited.
This article was written by a user of the site and reflects their personal views. MetaQuotes Ltd is not responsible for the accuracy of the information presented, nor for any consequences resulting from the use of the solutions, strategies or recommendations described.

- Free trading apps
- Over 8,000 signals for copying
- Economic news for exploring financial markets
You agree to website policy and terms of use
Something I don't get:
If you train models with not the raw tick data but built bars(time, tick etc), do you have to build bars during live trading?
Something I don't get:
If you train models with not the raw tick data but built bars(time, tick etc), do you have to build bars during live trading?