
Price Action Analysis Toolkit Development (Part 31): Python Candlestick Recognition Engine (I) — Manual Detection

Contents
Introduction
Candlestick charts are a fundamental tool used by financial analysts and traders to visualize and interpret price movements over time. Originating from Japanese rice merchants centuries ago, these charts have evolved into a vital component of technical analysis across various financial markets, including stocks, forex, and futures.

A candlestick provides essential information about market sentiment by depicting key data points such as opening, closing, high, and low prices within a specific time frame. Each candlestick's unique structure conveys insights into market psychology and can serve as a potential trading signal.
In this article, we examine the development of a comprehensive candlestick recognition system that leverages the capabilities of MQL5 and Python. We will begin by implementing manual detection methods, creating a script that extracts metrics from MQL5 and assigns pattern names based on predefined criteria. Although this recognition can be achieved entirely within MQL5, we opt for a division of roles between MQL5 and Python to leverage their respective strengths, ensuring greater flexibility and robustness.
In a subsequent article, we will extend this system by incorporating Python libraries that provide advanced capabilities for candlestick pattern recognition, thereby enhancing the accuracy and variety of pattern detection. Join us as we delve into the intricacies of candlestick pattern identification and examine how this integrated approach enhances trading analysis. Below is an outline of the steps we will follow:
- Analyze Each Pattern: We will examine each candlestick pattern individually and explore how its recognition is implemented in Python.
- Explore MQL5-Python Interaction: We will review how the MQL5 Expert Advisor interacts with the Python server, including the data exchange process and communication flow.
- Evaluate Outcomes and Conclude: Finally, we will assess the results of the system, discuss its effectiveness, and draw conclusions on its performance and potential improvements.
Candlestick Pattern Analysis
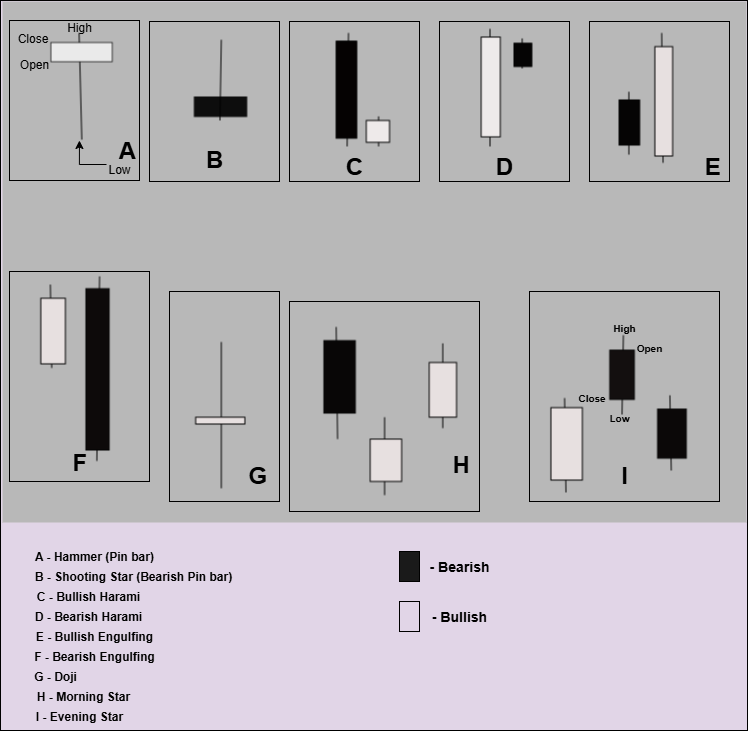
The broad section of a candlestick is known as the real body, which represents the difference between the opening and closing prices within a specific period. A filled or colored body typically indicates that the closing price was lower than the opening price, signaling a bearish movement. Conversely, an unfilled or differently colored body suggests the closing price was higher than the opening, indicating a bullish trend.
The shadows or wicks extend from the real body and illustrate the highest and lowest prices reached during the trading session. The length and position of these shadows provide insights into market volatility and investor sentiment, revealing how the prices fluctuated relative to the opening and closing levels.
Candlestick patterns embody the collective psychology of market participants, reflecting their emotional responses and expectations. Technical analysts utilize these visual cues to identify potential entry and exit points. The origin of candlestick charting dates back to 18th-century Japan, where rice traders used this technique to monitor rice prices. Today, it remains a versatile tool for analyzing liquid assets such as stocks, forex pairs, and futures.
Bullish and Bearish Candlesticks
- Bullish Candles:
A candlestick is considered bullish when the closing price exceeds the opening price. This is often visualized as a white or green candlestick, signaling upward momentum. Such candles suggest that buyers are in control during that period. The significance of long bullish candles increases if they occur near key support levels, indicating strong buying interest.
- Bearish Candles:
Conversely, a bearish candlestick occurs when the closing price falls below the opening price. These are typically shown as black or red candles, indicating selling pressure and downward price movement. Long bearish candles often signal strong selling activity and a potential continuation of the downturn.
- Color Conventions
While many trading platforms traditionally depict bullish candles in white or green and bearish candles in black or red, the choice of color is flexible. The critical aspect is understanding the relationship between the open and close prices, rather than adhering strictly to color schemes. The emphasis should always be on the positional relationship of the opening and closing prices to interpret market sentiment accurately.
Given the wide variety of candlestick patterns, our system concentrates on a select set of key formations. Below, we will explore each pattern's visual appearance and discuss how to identify them using Python:
Hammer
The Hammer candlestick forms when the opening, high, and closing prices are all close to one another, resulting in a small real body. Its defining feature is a prominent long lower shadow, which signals that buyers attempted to drive the price lower but were ultimately rejected. This suggests a potential shift in momentum toward the upside, reflecting underlying bullish sentiment. Below is a code snippet for identifying the Hammer pattern in the Python script
# inside detect_patterns(df: pd.DataFrame)
for i, _ in enumerate(df.index):
    o,h,l,c = df.iloc[i][["OPEN","HIGH","LOW","CLOSE"]]
    body = abs(c - o)
    lower = min(o,c) - l
    upper = h - max(o,c)

    if lower >= 2*body and upper <= body:
        pats[i] = "hammer"
        continue
- Body is the real body of the candle (abs(close - open)).
- Lower wick must be at least 2× body size.
- Upper wick should be small (no more than the size of the body).
- If this condition is met, it's labeled "hammer" in the pats[] array.
Shooting Star
The shooting star pattern appears when the opening, low, and closing prices are all near the same level. This results in a candlestick with a very small real body and a pronounced upper shadow. Often considered the bearish counterpart to the hammer, the shooting star signals potential reversal or hesitation in upward momentum. Experts in technical analysis typically recommend that the upper shadow should be at least twice as long as the body to confirm the pattern's significance.
# inside detect_patterns(df: pd.DataFrame)
for i, _ in enumerate(df.index):
    o,h,l,c = df.iloc[i][["OPEN","HIGH","LOW","CLOSE"]]
    body = abs(c - o)
    lower = min(o,c) - l
    upper = h - max(o,c)

    if upper >= 2*body and lower <= body:
        pats[i] = "shootingstar"
        continue
- Body is the difference between open and close.
- Upper wick must be at least 2× the body.Lower wick must be small (less than or equal to body).
- When these conditions are met, the pattern is marked as "shootingstar"
Engulfing (Bullish & Bearish)
A bullish engulfing pattern occurs when a small red (bearish) candlestick is followed by a larger green (bullish) candlestick that completely "engulfs" the previous candle's body. This pattern suggests a potential reversal from a downtrend to an uptrend, as buying pressure has overwhelmed selling pressure.
# Bullish Engulfing: small red followed by large green that engulfs it
if i >= 1:
    prev_o, prev_c = df.iloc[i-1][["OPEN", "CLOSE"]]
    curr_o, curr_c = o, c
    if (prev_c < prev_o and curr_c > curr_o and  # red candle then green
        curr_o < prev_c and curr_c > prev_o):    # body engulfs previous
        pats[i] = "bullishengulfing"
        continue
A bearish engulfing pattern is the opposite. It appears when a small green (bullish) candlestick is followed by a larger red (bearish) candlestick that completely engulfs the previous candle's body. This pattern indicates a potential reversal from an uptrend to a downtrend, reflecting increased selling pressure.
# Bearish Engulfing: small green followed by large red that engulfs it
if i >= 1:
    prev_o, prev_c = df.iloc[i-1][["OPEN", "CLOSE"]]
    curr_o, curr_c = o, c
    if (prev_c > prev_o and curr_c < curr_o and  # green candle then red
        curr_o > prev_c and curr_c < prev_o):    # body engulfs previous
        pats[i] = "bearishengulfing"
        continue
Doji
A Doji is a candlestick that forms when the opening and closing prices are virtually the same, resulting in a very small or nonexistent real body. This pattern signifies indecision in the market, as neither buyers nor sellers have gained control during the trading session.
# Doji: very small or no real body
if abs(c - o) <= (h - l) * 0.1:
    pats[i] = "doji"
    continue
- abs(c - o): real body size (difference between close and open).
- (h - l): total candle range (high minus low). If the body is less than or equal to 10% of the candle range, it's considered a Doji.
Harami (Bullish & Bearish)
The Harami pattern, derived from the Japanese word meaning "pregnant," is a well-known formation in technical analysis that signals potential trend reversals or continuations. It comprises two candlesticks: the first, larger one is often referred to as the "mother" candle, followed by a smaller "baby" candle that is contained within the range of the first. For the pattern to be considered valid, the second candle should close within the body of the previous candle, indicating a potential pause or reversal in market momentum.
The Harami pattern can signal a bearish reversal when it appears after an uptrend, suggesting that buying pressure is waning and a downturn may follow. Conversely, when it occurs after a downtrend, it may act as a bullish indicator, hinting at a possible upward correction or trend reversal.
if i >= 1:
    prev_o, prev_c = df.iloc[i-1][["OPEN", "CLOSE"]]
    curr_o, curr_c = o, c

    # Previous candle: large body (engulfing candle)
    prev_body = abs(prev_c - prev_o)
    curr_body = abs(curr_c - curr_o)

    if prev_body > 0 and curr_body > 0:
        # Bullish Harami
        if prev_o > prev_c and curr_o < curr_c:  # bearish → bullish
            if curr_o > prev_c and curr_c < prev_o:
                pats[i] = "bullishharami"
                continue

        # Bearish Harami
        if prev_o < prev_c and curr_o > curr_c:  # bullish → bearish
            if curr_o < prev_c and curr_c > prev_o:
                pats[i] = "bearishharami"
                continue
Morning Star
The Morning Star is a prominent bullish reversal pattern that typically appears after a downtrend, signaling a potential change in market sentiment from bearish to bullish. It consists of three candlesticks: the first is a large bearish candle, indicating strong selling pressure; the second is a small-bodied candle—either bullish or bearish—that gaps away from the first, representing indecision or a pause in momentum; and the third is a large bullish candle that closes well into the body of the first candle, confirming a shift toward upward momentum.
This pattern suggests that sellers are losing control and buyers are gaining strength, often leading to a sustained upward move once confirmed. The Morning Star is widely used by traders to identify potential entry points for long positions, especially when it appears after a prolonged decline.
if i >= 2:
    o1, c1 = df.iloc[i-2][["OPEN", "CLOSE"]]  # First candle
    o2, c2 = df.iloc[i-1][["OPEN", "CLOSE"]]  # Second (small) candle
    o3, c3 = df.iloc[i][["OPEN", "CLOSE"]]    # Third candle

    # Candle directions
    is_bearish1 = c1 < o1
    is_small2 = abs(c2 - o2) < abs(c1 - o1) * 0.5
    is_bullish3 = c3 > o3

    # Morning Star Logic
    if is_bearish1 and is_small2 and c3 > ((o1 + c1) / 2) and c3 > o3:
        if min(o2, c2) < c1 and max(o2, c2) > c1:  # small gap
            pats[i] = "morningstar"
            continue
- Candle 1: A long bearish candle (down body).
- Candle 2: A small-bodied candle (can be bullish or bearish).
- Candle 3: A strong bullish candle that closes above the midpoint of Candle 1.
This is a three-candle reversal pattern, usually signaling the end of a downtrend.
Evening Star
The Evening Star is a notable bearish reversal pattern that generally appears after an uptrend, indicating a potential shift from bullish to bearish sentiment. It consists of three candlesticks: the first is a large bullish candle, reflecting strong buying pressure; the second is a small-bodied candle—either bullish or bearish—that gaps away from the first, indicating market indecision or hesitation; and the third is a large bearish candle that closes well into the body of the first, confirming the reversal.
This pattern signals that buyers are losing momentum and sellers are gaining control, often leading to a downward trend or correction. Traders commonly use the Evening Star as a signal to consider short positions or to exit long trades, especially when it appears after an extended rally.
if i >= 2:
    o1, c1 = df.iloc[i-2][["OPEN", "CLOSE"]]  # First candle
    o2, c2 = df.iloc[i-1][["OPEN", "CLOSE"]]  # Second (small) candle
    o3, c3 = df.iloc[i][["OPEN", "CLOSE"]]    # Third candle

    is_bullish1 = c1 > o1
    is_small2 = abs(c2 - o2) < abs(c1 - o1) * 0.5
    is_bearish3 = c3 < o3

    if is_bullish1 and is_small2 and c3 < ((o1 + c1) / 2) and c3 < o3:
        if max(o2, c2) > c1 and min(o2, c2) < c1:  # small gap possible
            pats[i] = "eveningstar"
            continue
- Candle 1: Long bullish body.
- Candle 2: Small real body (indecision).
- Candle 3: Strong bearish candle closing well below Candle 1’s midpoint.
This three-candle pattern signals a potential trend reversal from bullish to bearish.
MQL5 Python Interaction
In our setup, the heavy lifting of candlestick‑pattern logic lives in a Python microservice, while the MQL5 EA focuses on data collection, chart annotation, and alerts. Whenever a new bar closes, the EA grabs the most recent 31 bars of OHLC data, hands them off as JSON to a local Flask server, and then plots whatever patterns the server reports—all in near real time. Here’s how it works step by step:- MQL5 EA: Data Collection in MQL5
void OnTick()
{
   static datetime lastBar = 0;
   datetime bar = iTime(_Symbol, InpTF, 0);
   if(bar == lastBar) return;
   lastBar = bar;

   double o[ BARS ], h[ BARS ], l[ BARS ], c[ BARS ];
   long   t[ BARS ];
   for(int i=0; i<BARS; i++)
   {
      o[i] = iOpen(_Symbol, InpTF, i+1);
      h[i] = iHigh(_Symbol, InpTF, i+1);
      l[i] = iLow (_Symbol, InpTF, i+1);
      c[i] = iClose(_Symbol, InpTF, i+1);
      t[i] = (long)iTime(_Symbol, InpTF, i+1);
   }
   // …then build JSON…
}
- MQL5 EA: Building the JSON Payload
string json = StringFormat(
  "{\"symbol\":\"%s\",\"timeframe\":%d,"
  "\"time\":[%s],\"open\":[%s],\"high\":[%s],"
  "\"low\":[%s],\"close\":[%s]}",
  _Symbol, InpTF,
  CSVInt(t), CSV(o), CSV(h), CSV(l), CSV(c)
);
- MQL5 EA: Sending via HTTP POST
char body[];    StringToCharArray(json, body);
char reply[];   string hdr="Content-Type: application/json\r\n", respHdr;
int code = WebRequest("POST", InpURL, hdr, InpTimeout, body, reply, respHdr);
if(code == -1)
  Print("[CSLAB] WebRequest failed: ", GetLastError());
else
  string resp = CharArrayToString(reply, 0, -1, CP_UTF8);
- Python: Flask Server Processing
@app.route("/patterns", methods=["POST"])
def patterns():
    raw = request.get_data(as_text=True)
    idx = raw.rfind("}")
    clean = raw[:idx+1] if idx != -1 else raw
    payload = json.loads(clean)   # may raise JSONDecodeError
    # …build DataFrame…
- Python: Build DataFrame
The build_dataframefunction is what turns the raw JSON arrays of timestamps, opens, highs, lows, and closes into a time‑indexed DataFrame that our pattern detector can easily work with:
def build_dataframe(payload):
    times = [ datetime.fromtimestamp(int(t), timezone.utc)
              for t in payload["time"] ]
    df = pd.DataFrame({
      "OPEN":  payload["open"],
      "HIGH":  payload["high"],
      "LOW":   payload["low"],
      "CLOSE": payload["close"]
    }, index=times)
    df.index.name = "datetime"
    return df
- Python: Manual Pattern Detection
Our custom detect_patterns(df) routine scans each row for Doji, Hammer, Shooting Star, Engulfing, Harami, Morning Star, and Evening Star signals, no external TA libraries needed.
def detect_patterns(df):
    pats = ["None"]*len(df)
    for i in range(len(df)):
        o,h,l,c = df.iloc[i][["OPEN","HIGH","LOW","CLOSE"]]
        body = abs(c-o); rng = max(h-l,1e-6)
        lower = min(o,c)-l; upper = h-max(o,c)
        # doji
        if body/rng <= 0.1:
            pats[i] = "doji"; continue
        # hammer
        if lower>=2*body and upper<=body:
            pats[i] = "hammer"; continue
        # shooting star
        if upper>=2*body and lower<=body:
            pats[i] = "shootingstar"; continue
        # bullish engulfing
        if i>0:
            po,pc = df.iloc[i-1][["OPEN","CLOSE"]]
            if pc<po and c>o and o<=pc and c>=po:
                pats[i] = "bullishengulfing"; continue
        # bearish engulfing
        if i>0:
            po,pc = df.iloc[i-1][["OPEN","CLOSE"]]
            if pc>po and c<o and o>=pc and c<=po:
                pats[i] = "bearishengulfing"; continue
        # harami
        if i>0:
            po,pc = df.iloc[i-1][["OPEN","CLOSE"]]
            if pc<po and o<c and o>pc and c<po:
                pats[i] = "bullishharami"; continue
            if pc>po and o>c and o<pc and c>po:
                pats[i] = "bearishharami"; continue
        # morning star
        if i>1:
            o1,c1 = df.iloc[i-2][["OPEN","CLOSE"]]
            o2,c2 = df.iloc[i-1][["OPEN","CLOSE"]]
            if c1<o1 and abs(c2-o2)<(df.iloc[i-1]["HIGH"]-df.iloc[i-1]["LOW"])*0.3 \
               and c>o2 and c>(o1+c1)/2:
                pats[i] = "morningstar"; continue
        # evening star
        if i>1:
            o1,c1 = df.iloc[i-2][["OPEN","CLOSE"]]
            o2,c2 = df.iloc[i-1][["OPEN","CLOSE"]]
            if c1>o1 and abs(c2-o2)<(df.iloc[i-1]["HIGH"]-df.iloc[i-1]["LOW"])*0.3 \
               and c<o2 and c<(o1+c1)/2:
                pats[i] = "eveningstar"; continue
    return pats
- Python: Crafting the Response
The server tallies all non‑“None” patterns and returns a concise JSON structure:
pats = detect_patterns(df)
counts = Counter(pats)
log_lines = [f"{k}={v}" for k,v in counts.items() if k!="None"]
resp = {"patterns": pats, "log": log_lines, "ms": round((datetime.now(timezone.utc)-start).total_seconds()*1000,2)}
return make_response(json.dumps(resp), 200, {"Content-Type":"application/json"})
- MQL5 EA: EA Parses & Acts
// extract patterns array
string patTxt; ExtractArray(resp, "patterns", patTxt);
string patt[]; ParseArray(patTxt, patt);
// draw+alert
for(int i=0;i<BARS;i++)
   if(patt[i]!="None")
   {
      datetime tm=iTime(_Symbol,InpTF,i+1);
      ObjectCreate(0,"CS_"+i,OBJ_TEXT,0,tm,iHigh(_Symbol,InpTF,i+1));
      ObjectSetString(0,"CS_"+i,OBJPROP_TEXT,patt[i]);
      Alert(_Symbol, " ", patt[i], " at ", TimeToString(tm,TIME_DATE|TIME_MINUTES));
   }
Testing and Outcomes
In this section, we will focus on testing the system and analyzing the outcomes. Before we proceed, let's first review how to install Python and set up the server to ensure it runs smoothly.
Download
The first step is to download and install Python from the official website. Click the big yellow button that says “Download Python 3.x.x.
Run the Installer
Double‑click the downloaded file. Before you hit “Install Now,” check the box that reads “Add Python to PATH.” This makes it effortless to run Python from anywhere in the Command Prompt. Click Install Now, then Close when it’s finished.
Verify
Press Win + R, type cmd, and hit Enter. In the black window that opens, type:
python --version
You should see something like Python 3.10.4. If you do, Python is installed successfully.
After successfully installing Python, the next step is to create our Python script
Open Notepad++
Launch Notepad++ (or any plain‑text editor you like).
Create a New File
Select File-New, then choose Language-P-Python for nice coloring (optional).
Paste the Server Code
Copy your entire pattern_server.py contents (the Flask app with detect_patterns(df) and all) and paste it into this new window.
Save the File
- Go to File-Save As…
- Navigate to a folder you’ll remember, e.g. C:\PatternServer\.
- In “File name,” type pattern_server.py (the .py extension is crucial).
- Click Save.
Install Required Libraries
Open Command Prompt
To begin, press the Windows key + R simultaneously to open the Run dialog box. Type cmd into the input field, then press Enter or click "OK" to launch the Command Prompt window. This is where you'll execute commands to navigate your system and run scripts.
Change Directory
Next, you need to direct Windows to the folder containing your Python script. In the Command Prompt, use the cd (change directory) command followed by the path to your script folder. For example:
cd path\to\your\script\folderReplace path\to\your\script\folder with the actual path on your system. This step ensures that your terminal session is pointing to the correct location where your script resides, allowing you to run it seamlessly. Install Flask and pandas
pip install flask pandas
This pulls down Flask (our tiny web server) and pandas (for data handling). You’ll see something like:
* Serving Flask app "pattern_server"
* Running on http://127.0.0.1:5000/ (Press CTRL+C to quit)
That means your microservice is live and listening for requests. Next, compile your MQL5 Expert Advisor (EA) and drag it onto the chart. This action establishes a connection between the EA and the running Python server. Below are the results and observations we obtained after executing the system.
Testing on EURUSD
MetaTrader 5 Experts Tab logs
2025.07.09 22:25:42.248 Candlestick Label (EURUSD,M15)  [CSLAB] EA started – allow http://127.0.0.1:5000/patterns in Tools→Options→Expert Advisors→WebRequest
2025.07.09 22:25:42.790 Candlestick Label (EURUSD,M15)  [CSLAB] JSON-OUT: {"symbol":"EURUSD",
"timeframe":0,"time":[1752064200,1752065100,1752066000,1752066900,1752067800,1752068700,1752069600,
1752070500,1752071400,1752072300,1752073200,1752074100,1752075000,1752075900,1752076800,1752077700,
1752078600,1752079500,1752080400,1752081300,1752082200,1752083100,1752084000,1752084900,1752085800,
1752086700,1752087600,1752088500,1752089400,1752090300,1752091200],"open":[1.17051,1.17045,1.17153,
1.17167,1.17143,1.17096,1.17034,1.17152,1.17193,1.17194,1.17148,1.17095,1.1706

2025.07.09 22:25:42.790 Candlestick Label (EURUSD,M15)  [CSLAB] POST http://127.0.0.1:5000/patterns
2025.07.09 22:25:42.938 Candlestick Label (EURUSD,M15)  [CSLAB] HTTP 200 RESP: {"patterns": ["doji",
 "bullishengulfing", "None", "None", "eveningstar", "None", "bullishengulfing", "None", "doji",
"bearishengulfing", "None", "None", "None", "None", "None", "bearishengulfing", "None", "None",
"bullishengulfing", "doji", "bearishengulfing", "None", "None", "None", "None", "None", "None",
 "None", "hammer", "eveningstar", "None"], "log": ["doji=3", "bullishengulfing=3", "eveningstar=2",
 "bearishengulfing=3", "hammer=1", "total patterns=12"], "ms": 128.25}
2025.07.09 22:25:42.938 Candlestick Label (EURUSD,M15)  [CSLAB] SERVER: doji=3
2025.07.09 22:25:42.938 Candlestick Label (EURUSD,M15)  [CSLAB] SERVER: bullishengulfing=3
2025.07.09 22:25:42.938 Candlestick Label (EURUSD,M15)  [CSLAB] SERVER: eveningstar=2
2025.07.09 22:25:42.938 Candlestick Label (EURUSD,M15)  [CSLAB] SERVER: bearishengulfing=3
2025.07.09 22:25:42.938 Candlestick Label (EURUSD,M15)  [CSLAB] SERVER: hammer=1
2025.07.09 22:25:42.938 Candlestick Label (EURUSD,M15)  [CSLAB] SERVER: total patterns=12
CMD Python logging
2025-07-09 22:25:42,806 [INFO] RAW BODY: {"symbol":"EURUSD","timeframe":0,"time":[1752064200,1752065100,1752066000,1752066900,1752067800,
1752068700,1752069600,1752070500,1752071400,1752072300,1752073200,1752074100,1752075000,1752075900,1752076800,1752077700,1752078600,
1752079500,1752080400,1752081300,1752082200,1752083100,1752084000,1752084900,1752085800,1752086700,1752087600,1752088500,1752089400,
1752090300,1752091200],"open":[1.17051,1.17045,1.17153,1.17167,1.17143,1.17096,1.17034,1.17152,1.17193,1.17194,1.17148,1.17095,1.17066,
1.17085,1.17060,1.17072,1.17015,1.17066,1.17050,1.17087,1.17088,1.17059,1.17086,1.17174,1.17160,1.17105,1.17134,1.17166,1.17216,1.17226,
1.17189],"high":[1.17091,1.17170,1.17206,1.17225,1.17186,1.17098,1.17160,1.17246,1.17223,1.17194,1.17163,1.17112,1.17098,1.17103,1.17091,
1.17088,1.17071,1.17073,1.17109,1.17104,1.17092,1.17102,1.17179,1.17176,1.17164,1.17147,1.17170,1.17222,1.17232,1.17232,1.17199],
"low":[1.17008,1.17036,1.17120,1.17109,1.17088,1.17005,1.17028,1.17152,1.17152,1.17131,1.17095,1.17050,1.17055,1.17050,1.17059,1.17009,1.17013,
1.17039,1.17039,1.17077,1.17043,1.17056,1.17051,1.17141,1.17091,1.17101,1.17130,1.17163,1.17188,1.17180,1.17163],"close":[1.17045,
1.17153,1.17170,1.17143,1.17096,1.17034,1.17152,1.17193,1.17194,1.17149,1.17096,1.17066,1.17086,1.17061,1.17072,1.17015,1.17067,
1.17050,1.17087,1.17088,1.17058,1.17087,1.17175,1.17160,1.17104,1.17133,1.17165,1.17216,1.17227,1.17189,1.17177]}
2025-07-09 22:25:42,934 [INFO] SEND: {'patterns': ['doji', 'bullishengulfing', 'None', 'None', 'eveningstar', 'None', 'bullishengulfing',
 'None', 'doji', 'bearishengulfing','None', 'None', 'None', 'None', 'None', 'bearishengulfing', 'None', 'None', 'bullishengulfing', 'doji',
 'bearishengulfing', 'None', 'None', 'None', 'None', 'None', 'None', 'None','hammer', 'eveningstar', 'None'], 'log': ['doji=3',
'bullishengulfing=3', 'eveningstar=2', 'bearishengulfing=3', 'hammer=1', 'total patterns=12'], 'ms': 128.25}
2025-07-09 22:25:42,936 [INFO] 127.0.0.1 - - [09/Jul/2025 22:25:42] "POST /patterns HTTP/1.1" 200 -
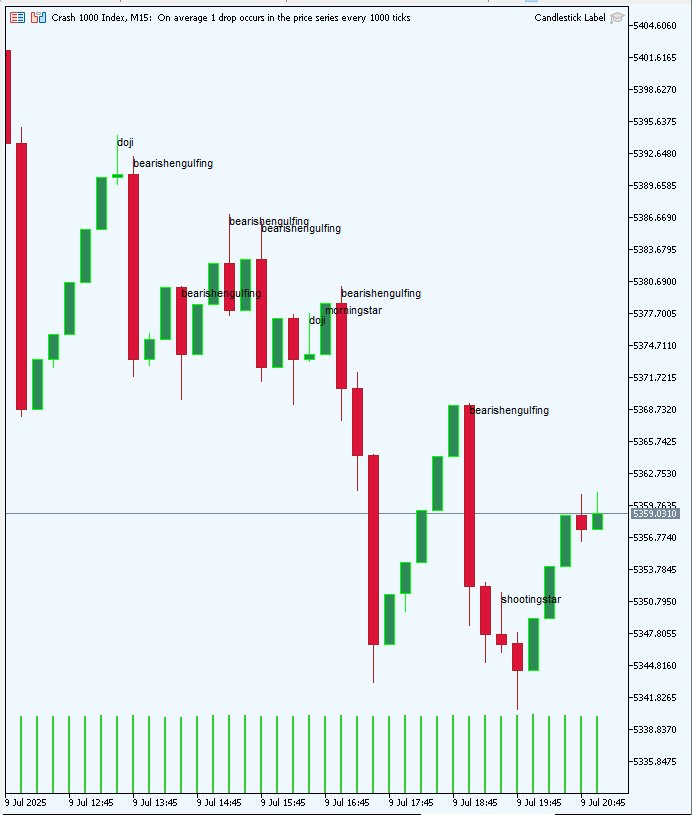
Test on Crash 1000
Conclusion
In conclusion, this two‑part architecture-the MQL5 EA on one side and the Python pattern‑server on the other-proves to be both robust and responsive. The EA cleanly packages each new bar’s OHLC data, sends it off, and then faithfully renders the returned pattern labels on your chart. Meanwhile, the Python service ingests that JSON, runs through our handcrafted detection logic, and logs every request and result for full transparency. Together, they form a seamless, low‑latency pipeline: new bars arrive, patterns are identified, and charts update almost instantly. The clear, structured logging on both ends ensures you always know exactly what’s happening, making troubleshooting straightforward.
Overall, the integration is solid, the performance is reliable, and the system delivers accurate, real‑time candlestick insights exactly as designed. You can incorporate additional candlestick patterns based on your specific needs. As mentioned earlier, we will delve deeper into utilizing Python libraries for candlestick detection in upcoming articles, providing more advanced techniques and tools.
Warning: All rights to these materials are reserved by MetaQuotes Ltd. Copying or reprinting of these materials in whole or in part is prohibited.
This article was written by a user of the site and reflects their personal views. MetaQuotes Ltd is not responsible for the accuracy of the information presented, nor for any consequences resulting from the use of the solutions, strategies or recommendations described.

- Free trading apps
- Over 8,000 signals for copying
- Economic news for exploring financial markets
You agree to website policy and terms of use