
Price Action Analysis Toolkit Development (Part 57): Developing a Market State Classification Module in MQL5

Contents
Introduction
Whenever we look at a price chart, it is important to understand what the current price movement represents before forming any expectations about what may follow. This context helps determine whether conditions are suitable for participation or whether it is better to wait for a clearer and more stable structure to emerge. Identifying the current market state through manual analysis requires time and sustained focus, particularly when working across multiple timeframes. Repeating this process consistently can become demanding and inefficient.
In this part of the Price Action Analysis Toolkit Development series, we introduce an automated MQL5 system designed to classify the current state of the market using pure price action. The sections that follow explain the underlying concept, the classification logic, and the implementation approach in detail.
Understanding Market States
Before examining market states in the context of price action, it is useful to begin with a familiar scientific concept: the states of matter. Matter is anything that has mass and occupies space, and it can exist in different physical states depending on internal energy and external pressure. These states are commonly identified as solid, liquid, and gas.
In a solid state, particles possess relatively low energy. They are tightly packed and strongly bound, limiting their freedom of movement. As energy increases, these bonds weaken, and matter transitions into a liquid state, where particles remain close but are no longer rigidly fixed. With further increases in energy, particles become highly active and disperse freely, forming a gaseous state.
A key principle is that the substance itself does not change—only its state does. Water remains water whether it is ice, liquid, or vapor. What changes is the internal energy and how that energy expresses itself through structure and movement. This principle provides a useful framework for interpreting market behavior. Price does not change its identity; instead, it expresses different behavioral states depending on internal conditions such as volatility and structural organization. These states describe how the market behaves, not where it is headed.
From Physical States to Market States
The diagram below illustrates how the states of matter are used as an analogy for market states, focusing on volatility and structural constraint rather than directional trend.
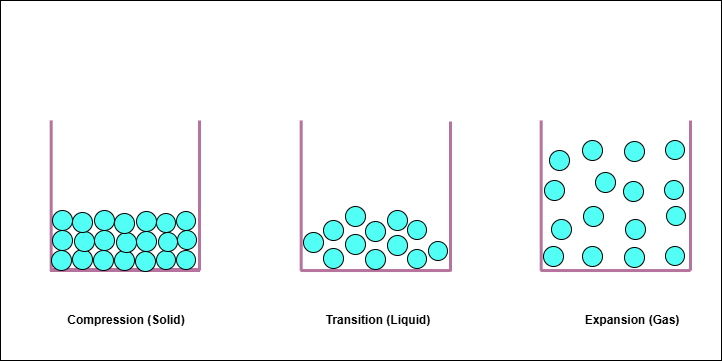
In science, gases are more compressible than solids, which may appear counterintuitive when using the states-of-matter analogy. However, in this context, compression refers to a condition of constraint rather than the ability to be compressed. A solid represents a state where particles are already tightly packed and movement is restricted. Likewise, a market in compression is one where price is already constrained within a narrow range. The analogy therefore focuses on freedom of movement and internal energy, not mechanical compressibility. Within this framework, market states are treated as descriptive conditions, not predictive signals. The objective is to determine whether the price is constrained, loosening, or freely moving, based on observable characteristics in recent, fully closed candles.
The mapping used in this development is
- Solid—Compression
- Liquid—Transition
- Gas—Expansion
These states evolve continuously rather than abruptly. Markets typically move through intermediate conditions as volatility and structure change, rather than shifting instantly from one state to another.
Compression State (Solid)
A compression state represents a condition in which price is structurally constrained. Candle ranges contract, volatility diminishes, and price oscillates within a relatively narrow band. Highs and lows overlap, and directional progress remains limited.
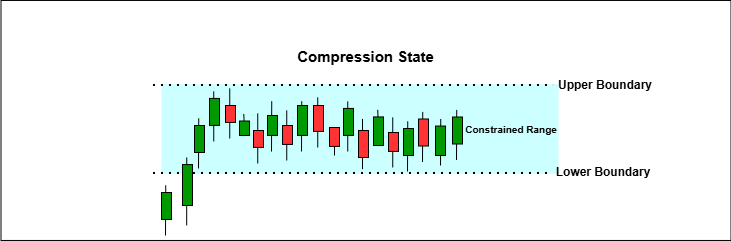
Compression is not synonymous with inactivity. Price continues to fluctuate, but movement is absorbed rather than extended. Identifying compression provides contextual awareness of restricted movement using closed-candle data, without implying future direction. Compression may persist for extended periods across multiple timeframes, especially when market participation is balanced or external drivers are absent. On lower timeframes, this often appears as overlapping candles with frequent wicks and minimal net displacement, while higher timeframes may present as a compact consolidation structure. Importantly, compression does not imply weakness or indecision; rather, it reflects a temporary equilibrium where price movement is absorbed instead of extended. Recognizing this state helps frame expectations around reduced movement efficiency, allowing subsequent price behavior to be interpreted in proper context.
Transition State (Liquid)
A transition state reflects a loosening of structural constraint. Candle ranges become less uniform, volatility varies, and price may probe beyond recent extremes without sustained follow-through. Structural signals often appear mixed, and containment weakens without fully breaking down.
![]()
This state explains why price behavior may appear inconsistent or fluid without implying randomness. Transition serves as an intermediate condition where neither constraint nor free movement dominates.
Expansion State (Gas)
An expansion state is characterized by elevated volatility and wide candle ranges. Structural containment weakens, and price moves freely with large, irregular swings. Directional consistency is not required; expansion describes the extent of movement rather than its coherence.
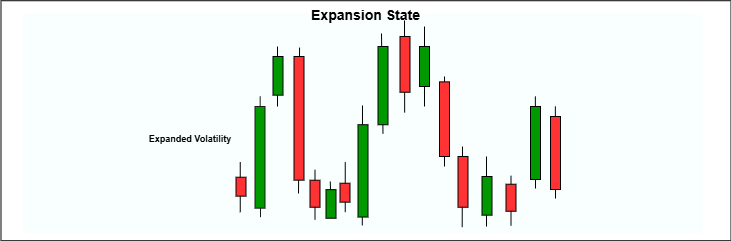
Expansion does not imply continuation, trend, or duration. It describes a condition of increased internal energy expressed through broad price movement, evaluated strictly on closed candles.
Trend as a Structural Condition
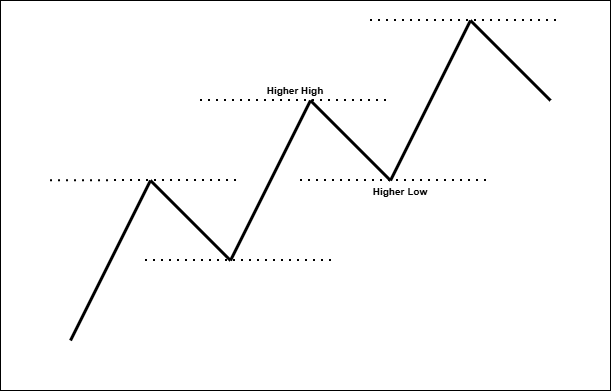
A trending condition is identified when price forms a sequence of
- Higher highs and higher lows, or
- lower highs and lower lows.
Accompanied by a consistent directional bias in candle closes. A market may exhibit expansion without a stable trend, or maintain a trend amid modest volatility. For this reason, trend is evaluated independently of the volatility-based analogy. It complements the classification framework by adding directional context without introducing predictive assumptions.
Why Market State Awareness Matters
Understanding market states enables contextual interpretation of price action. The same structural feature can carry different meanings depending on whether the market is compressed, transitioning, expanding, or trending. By classifying the prevailing state using closed-candle data, analysis becomes more coherent and internally consistent. This framework emphasizes observation and classification rather than execution, providing a neutral foundation for informed interpretation.
MQL5 Implementation
With the conceptual framework established, the next step is translating market state classification into a concrete and reliable MQL5 implementation. This module is designed as a non-trading Expert Advisor, whose sole purpose is to observe closed-candle price action, classify the prevailing market state, and render that context visually on the chart. No orders are placed, no signals are issued, and no forward-looking assumptions are made. The EA functions strictly as an analytical layer.
From an architectural perspective, the implementation is organized to remain systematic, readable, and easily extensible. Rather than combining all logic into a single execution loop, responsibilities are clearly separated. In practice, the EA operates around four core tasks:
- Closed-candle sampling and gating
- Swing-structure extraction
- Market state classification
- Chart-based visualization
This architectural separation is intentional. By isolating feature extraction, classification logic, and visualization, the implementation remains easy to inspect, debug, and extend. Changes to visual presentation do not affect analytical outcomes, and classification rules can be refined without altering execution flow. The structure mirrors professional analytical system design, where clarity and reproducibility are prioritized over compactness or optimization tricks. Separation ensures that analytical decisions remain independent of presentation, allowing the classifier to be evaluated on its own merits.
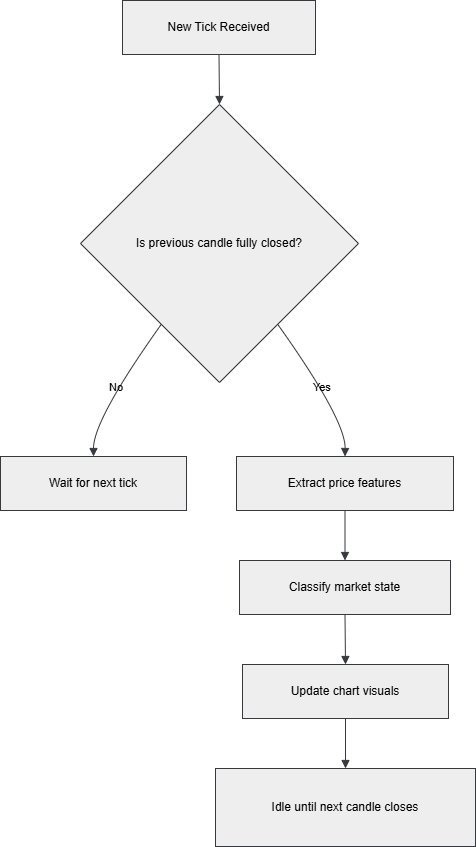
Closed-candle evaluation
To begin with, all calculations in the EA are gated by a strict closed-candle check. On every tick, the EA inspects the timestamp of bar index 1, which represents the most recently completed candle. If this timestamp has not changed since the previous tick, execution halts immediately.
Only when a new candle has fully closed does the EA proceed to recompute ranges, evaluate structure, classify the market state, and refresh chart objects. This approach guarantees non-repainting behavior. It also ensures that historical playback and live operation behave identically, as both rely exclusively on completed data. From a performance standpoint, this design keeps CPU usage stable, since the classifier executes once per bar rather than continuously on every tick.
void OnTick()
{
   // 1. Closed-candle gating (non-repainting core)
   datetime closed=iTime(_Symbol,_Period,1);
   if(closed==0 || closed==g_lastClosedBar) return;
   g_lastClosedBar=closed;

   // 2. Feature extraction + classification
   double avgR,lastR,lastCLV,meanCLV,swingScore,recentAvg,prevAvg;
   ENUM_MARKET_STATE newState =
      ClassifyState(avgR,lastR,lastCLV,meanCLV,
                    swingScore,recentAvg,prevAvg);

   // 3. State transition handling
   DrawStateHistory(g_state,newState);
   g_prevState=g_state;
   g_state=newState;

   // 4. Visualization layer
   DrawSwingDots();
   DrawActiveLabels();
   DrawCompressionBox();
   DrawInfoLines();
}
This structure ensures that feature extraction, state classification, and chart rendering are executed exactly once per closed candle, preserving deterministic and non-repainting behavior.
Inputs and configurable behavior
With the execution model defined, the EA exposes a set of inputs that control sensitivity, thresholds, and visual output. These inputs are grouped conceptually so that behavioral logic and presentation preferences remain distinct.
input int    InpLookbackBars     = 60;
input int    InpTrendBars        = 20;
input int    InpCompressionBars = 16;
input int    InpSwingLeftRight  = 3;

input double InpRangeShrinkRatio = 0.70;
input double InpExpansionMult   = 1.80;
input double InpCLVStrong       = 0.60;
Lookback and sensitivity inputs
These parameters control how much historical data contributes to the classifier’s measurements:
- InpLookbackBars defines the baseline window used to compute the average candle range.
- InpTrendBars specifies how many closed candles contribute to the mean CLV bias used in trend detection.
- InpCompressionBars determines the window length used to compare recent range contraction.
- InpSwingLeftRight controls the strictness of swing high and swing low detection.
Threshold inputs
Thresholds govern how aggressively the classifier distinguishes between states:
- InpRangeShrinkRatio defines how much average recent range must contract relative to the previous window to qualify as compression.
- InpExpansionMult specifies how much larger the last candle’s range must be compared to the baseline average to qualify as expansion.
- InpCLVStrong filters expansion so that only wide candles with decisive closes are considered.
- InpTrendBiasCLV and InpTrendMinSwingScore define the minimum directional close bias and structural consistency required for a trend state.
Visualization toggles
Each visual element—swing dots, active structure labels, compression box, state history blocks, and the stacked information panel—can be enabled or disabled independently. This allows the analytical engine to remain constant while adapting the visual footprint to different chart layouts.
Price-action features used by the classifier
At the heart of the classifier is a small set of price-derived features computed exclusively from closed candles. These measures are intentionally simple and transparent, making the logic easy to audit and reason about.
Candle range
Candle range is computed as the difference between the high and low of each closed candle. Two related range measures are maintained:
- A baseline average range, computed over InpLookbackBars
- A compression comparison, which contrasts the average recent range against the immediately preceding window of equal length
double CandleRange(int shift)
{
   return iHigh(_Symbol, _Period, shift)
        - iLow (_Symbol, _Period, shift);
}

double AvgRange(int start, int count)
{
   double sum = 0;
   int n = 0;

   for(int i = start; i < start + count && i < Bars(_Symbol, _Period); i++)
   {
      double r = CandleRange(i);
      if(r > 0)
      {
         sum += r;
         n++;
      }
   }
   return (n > 0 ? sum / n : 0);
}
This dual approach allows the EA to detect both relative contraction and abnormal expansion without relying on fixed point or pip thresholds.
Closing Location Value (CLV)
Closing Location Value measures where the candle close occurs within its range and is calculated as:
CLV = (2 × Close − High − Low) / (High − Low)
double CandleCLV(int shift)
{
   double h = iHigh (_Symbol, _Period, shift);
   double l = iLow  (_Symbol, _Period, shift);
   double c = iClose(_Symbol, _Period, shift);

   if(h <= l)
      return 0.0;

   return (2.0 * c - h - l) / (h - l);
}
Within this implementation, CLV serves two descriptive roles. First, the absolute CLV of the most recent closed candle acts as a strength filter for expansion, ensuring that wide candles closing near the midpoint are not misclassified. Second, the mean CLV over a short window provides a directional bias measure used when evaluating trend structure. CLV is treated strictly as a structural descriptor.
Swing structure and structural scoring
Swing highs and swing lows are detected using a symmetric left/right comparison controlled by InpSwingLeftRight. The EA locates the two most recent swing highs and the two most recent swing lows within a bounded scan window.
bool IsSwingHigh(int shift, int lr)
{
   double mid = iHigh(_Symbol, _Period, shift);

   for(int i = 1; i <= lr; i++)
      if(mid <= iHigh(_Symbol, _Period, shift + i) ||
         mid <= iHigh(_Symbol, _Period, shift - i))
         return false;

   return true;
}

bool IsSwingLow(int shift, int lr)
{
   double mid = iLow(_Symbol, _Period, shift);

   for(int i = 1; i <= lr; i++)
      if(mid >= iLow(_Symbol, _Period, shift + i) ||
         mid >= iLow(_Symbol, _Period, shift - i))
         return false;

   return true;
}
From these four points, a compact swing score is derived by comparing the most recent swing against its predecessor for both highs and lows. The score increases when the structure steps upward and decreases when structure steps downward. This score is not used to estimate magnitude or momentum; it is used solely to determine whether a structure is consistently aligned.
int Sign(double v)
{
   if(v > 0) return 1;
   if(v < 0) return -1;
   return 0;
}

double ComputeSwingScore(int prevHigh, int lastHigh,
                         int prevLow,  int lastLow)
{
   double score = 0;
   score += Sign(iHigh(_Symbol, _Period, lastHigh)
               - iHigh(_Symbol, _Period, prevHigh));
   score += Sign(iLow (_Symbol, _Period, lastLow)
               - iLow (_Symbol, _Period, prevLow));
   return score;
}
State model and classification hierarchy
Once the underlying features are computed, the EA evaluates market state using an enumeration with four possible values:
- Trend
- Compression
- Expansion
- Transition
The classification logic is intentionally hierarchical to avoid ambiguous overlaps. Evaluation proceeds in the following order:
- Expansion
- Compression
- Trend
- Transition
ENUM_MARKET_STATE ClassifyState(double avgRange,
                                double lastRange,
                                double lastCLV,
                                double recentAvg,
                                double prevAvg,
                                double meanCLV,
                                double swingScore)
{
   // Expansion: abnormal range with decisive close
   if(lastRange >= avgRange * InpExpansionMult &&
      MathAbs(lastCLV) >= InpCLVStrong)
      return STATE_EXPANSION;

   // Compression: relative contraction in recent volatility
   if(prevAvg > 0 &&
      recentAvg <= prevAvg * InpRangeShrinkRatio)
      return STATE_COMPRESSION;

   // Trend: agreement between structure and directional close bias
   if(MathAbs(meanCLV) >= InpTrendBiasCLV &&
      MathAbs(swingScore) >= InpTrendMinSwingScore)
      return STATE_TREND;

   // Transition: mixed or intermediate behavior
   return STATE_TRANSITION;
}
This ordering reflects the practical importance of movement freedom. Sudden expansion should be recognized immediately, while trend is evaluated only when neither contraction nor expansion dominates.
Expansion condition
Expansion is identified when the most recent closed candle exhibits both abnormal range and decisive close behavior:
- The last candle’s range exceeds the baseline average range by InpExpansionMult
- The absolute CLV of that candle meets or exceeds InpCLVStrong
This combination ensures that expansion represents a genuine release of movement energy rather than a wide but neutral candle.
Compression condition
Compression is identified when recent volatility contracts relative to the immediately preceding window:
Because this comparison is relative, it adapts naturally across symbols and timeframes by measuring the market against its own recent behavior.
Trend condition
Trend is evaluated independently of volatility states and requires agreement between structure and close behavior:
- Mean CLV magnitude meets or exceeds InpTrendBiasCLV
- Structural swing score magnitude meets or exceeds InpTrendMinSwingScore
This prevents trends from being inferred solely from movement and ensures that directional consistency is present in the underlying structure.
Transition condition
If none of the above conditions dominate, the classifier returns Transition. Transition represents mixed or intermediate behavior and is treated as a valid descriptive state rather than an error or uncertainty condition.
Chart visualization layer
With classification complete, the EA renders context on the chart through a set of optional visual elements. These visuals are invoked sequentially within the OnTick() handler after a new candle has fully closed. This approach keeps execution flow explicit and avoids introducing additional abstraction layers that are not required for analysis.
Each visual routine is gated by its corresponding input flag, allowing individual components to be enabled or disabled without affecting the underlying classification logic.
- Swing dots mark detected swing highs and lows.
- Active structure labels display HH/HL or LH/LL relationships for recent swings.
- Compression boxes visualize the occupied price region of the recent compression window.
- State history blocks provide a faint background timeline of state changes.
- The stacked info panel summarizes state, structure, and volatility metrics in a vertical, readable format.
// Chart visualization executed after state update
DrawSwingDots();
DrawActiveLabels();
DrawCompressionBox();
DrawInfoLines();
All visual components are controlled via inputs and can be disabled independently.
Lifecycle behavior and cleanup
On initialization, the EA removes any previously created objects using a prefix-based cleanup routine. The same cleanup is performed on deinitialization, preventing orphaned labels or rectangles from persisting after recompilation or removal.
void DeleteByPrefix(string prefix)
{
   for(int i = ObjectsTotal(0) - 1; i >= 0; i--)
   {
      string name = ObjectName(0, i);
      if(StringFind(name, prefix) == 0)
         ObjectDelete(0, name);
   }
}
Implementation notes for stability
Finally, several implementation choices reinforce stability and reproducibility:
- All calculations rely on standard price series functions.
- All logic operates exclusively on fully closed candles.
- No orders, alerts, or trade instructions are generated.
- The EA functions as a descriptive, analytical layer within a broader price action toolkit.
Testing
Testing focused on behavioral consistency rather than performance metrics. The EA was evaluated in the Strategy Tester to confirm algorithmic behavior across historical data and then observed on live charts to verify visual stability during real-time candle formation. Particular attention was given to ensuring that state labels, background regions, and informational text updated only after candle close, maintaining identical behavior between historical and live conditions. The Market State Classifier was evaluated using both the MetaTrader Strategy Tester (visual mode) and live chart observation. Testing focused on behavioral correctness, non-repainting guarantees, and visual consistency. The objective was to confirm that the EA behaves systematically and presents stable contextual information across historical and live environments.
Strategy Tester Visualization
In Strategy Tester visualization mode, the EA was replayed candle by candle on historical data. Market state labels, structure annotations, compression boxes, and volatility metrics are updated only after each candle fully closes, confirming that all logic is gated on completed bars.
State transitions occurred at consistent timestamps during repeated test runs. Compression zones aligned with periods of reduced volatility, expansion states appeared only when abnormal ranges and decisive closes were present, and transition states filled intermediate conditions without retroactive changes. Swing dots and structure labels (HH, HL, LH, LL) were applied only when sufficient confirmation existed, and once drawn, they remained fixed.
Strategy Tester Visualization—XAUUSD H1
This behavior confirms that both modes follow the same evaluation path, which is very significant.
Live chart behavior
When attached to live charts, the EA exhibited identical behavior. The stacked information panel updated once per candle close, reflecting the current market state, structural bias, and volatility metrics without flicker or revision. Compression boxes expanded and contracted in real time as volatility conditions evolved, while state history blocks provided a subtle background record of prior classifications.
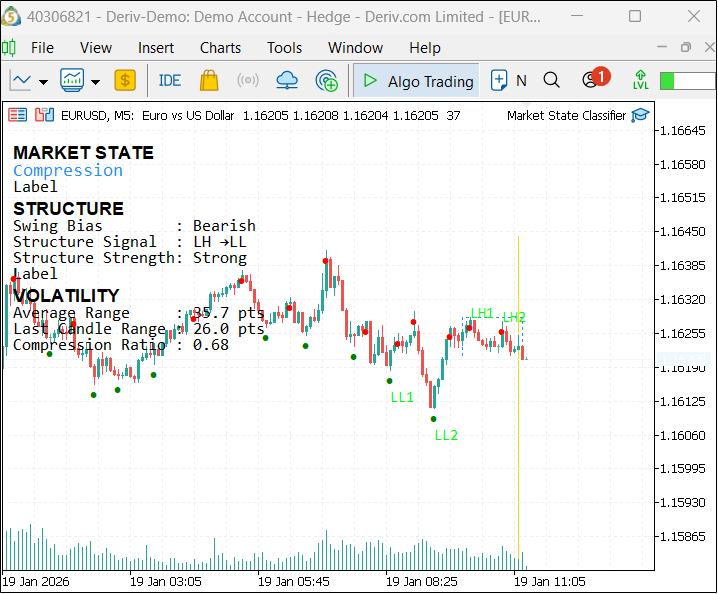
Live Chart—EURUSD M5
Swing structure labels were adjusted only when new confirmed swings formed, and previously labeled structure was not altered retroactively. Across different symbols and timeframes, the classifier maintained a clear separation between volatility state, structural condition, and visual presentation.
Validation outcome
Across both testing environments, the following characteristics were consistently observed:
- Market state classification is rule-based and non-repainting
- Visual elements remain stable once rendered
- Historical and live behavior are identical
- No execution logic
These results confirm that the market state classifier functions as intended. This makes it suitable for integration into a broader price action analysis workflow where state awareness is required before applying discretionary or systematic strategies.
Conclusion
This article presented the design and MQL5 implementation of a market state classification module developed as part of the Price Action Analysis Toolkit. The objective was to provide a framework for describing how price is behaving at any given moment. By combining relative volatility analysis, structural swing evaluation, and a hierarchical classification model, the EA distinguishes between compression, transition, expansion, and trend conditions without relying on indicators, optimization, or execution logic.
The resulting tool functions as a contextual layer, clarifying whether price is constrained, fluid, or freely expanding, and whether directional structure is present. This separation of state from direction reinforces disciplined analysis and helps avoid misinterpretation of price action when conditions are not aligned. As with the other components of the toolkit, this module is intentionally descriptive. Its value lies in enhancing situational awareness and providing a stable analytical foundation upon which discretionary or systematic decision-making can be applied separately.
Warning: All rights to these materials are reserved by MetaQuotes Ltd. Copying or reprinting of these materials in whole or in part is prohibited.
This article was written by a user of the site and reflects their personal views. MetaQuotes Ltd is not responsible for the accuracy of the information presented, nor for any consequences resulting from the use of the solutions, strategies or recommendations described.


- Free trading apps
- Over 8,000 signals for copying
- Economic news for exploring financial markets
You agree to website policy and terms of use