
Price Action Analysis Toolkit Development (Part 3): Analytics Master — EA
Contents
- Introduction
- Review of the Previous Tool
- Overview of the Analytic Master
- Exploring the Expert Advisor Code
- Code Breakdown
- Code Implementation and Testing
- Conclusion
Introduction
Having developed the analytic comment script in the previous episode, I have identified its limitations regarding script properties, which I will outline below. While I acknowledge the considerable impact that the analytical comment script has had within the trading community, I have developed an Expert Advisor (EA) called Analytics Master. This EA offers the same analysis while also providing extra metrics for better trading insights. This new tool offers several advantages, including the ability to continuously update metrics every two hours, in contrast to the script, which could only write metric information once. The EA enhances analysis and keeps users updated.
In some instances, an Expert Advisor (EA) can integrate script-like functions to enhance its functionality. This means you can implement specific tasks within the EA's code that resemble the actions typically executed by standalone scripts. An EA effectively combines coding, customizable settings, trading logic, and risk management to automate trading strategies efficiently. Below, I have tabulated a comparison between the script and the Expert Advisor (EA).
| Script | Expert Advisor (EA) |
|---|---|
| They are designed to perform a specific task and complete execution almost instantly. They terminate once the task is done and cannot run continuously. | They run continuously in the background, monitoring market conditions and executing trades based on predefined conditions. |
| They can't handle events like ticks or timers. A script can only execute its code when manually launched. | They can respond to market events and changes (e.g., OnTick, OnTimer, OnTrade), allowing for more responsiveness in trading strategies. |
| Typically, a script can execute trades (opening, modifying, or closing) but does not manage ongoing trades. Once executed, it cannot monitor or react to the state of trades. | EAs can manage open positions dynamically, track trade conditions, apply trailing stops, and dynamically adjust their strategies based on market conditions. |
| Usually designed for one-time execution and may require specific configurations (like input parameters) each time they are run manually by the user. | They can maintain user-defined parameters across sessions and run without user interaction once they are started. |
| Best suited for simple, action-based tasks (e.g., batch closing orders or applying indicators). | They can incorporate complex logic, algorithms, and systems that require ongoing decision-making and adaptation to market conditions. |
| While scripts can analyze historical data, they cannot continuously adapt or learn from new incoming data without being rerun. | They can analyze historical data and make decisions based on real-time incoming data, enabling adaptive strategies. |
| Because they execute and terminate quickly, they also have limited performance impact when run compared to continuously running EAs. | As EAs run constantly, they may lead to increased CPU and memory consumption, especially if they manage many trades or use complex algorithms. |
Review of the previous tool (Analytical Comment Tool)
Our previous tool, the Analytical Comment Script, was designed to analyze key metrics from the previous trading day, including:
- Previous Day Open
- Previous Day Close
- Previous Day Volume
- Current Day Volume
- Support and Resistance Levels
This information is presented in a vertically organized table. Additionally, a prediction of potential market movements has been calculated based on previous opening and closing prices, as well as trading volumes, as shown in Figure 1 below.
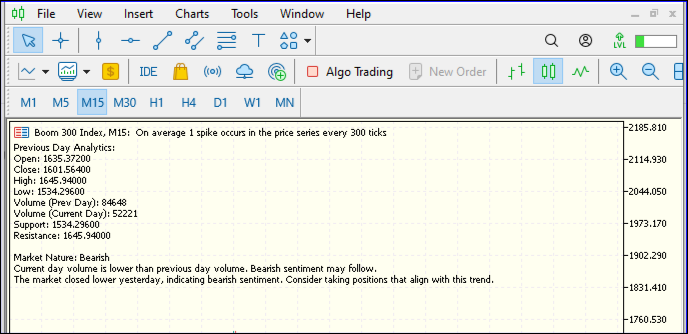
Fig 1. Data Presentation
Our script successfully drew trend lines on the chart, highlighting key support and resistance levels. The market direction prediction appeared positive as well. In Figure 2, we summarize the results from our analytics comment tool.
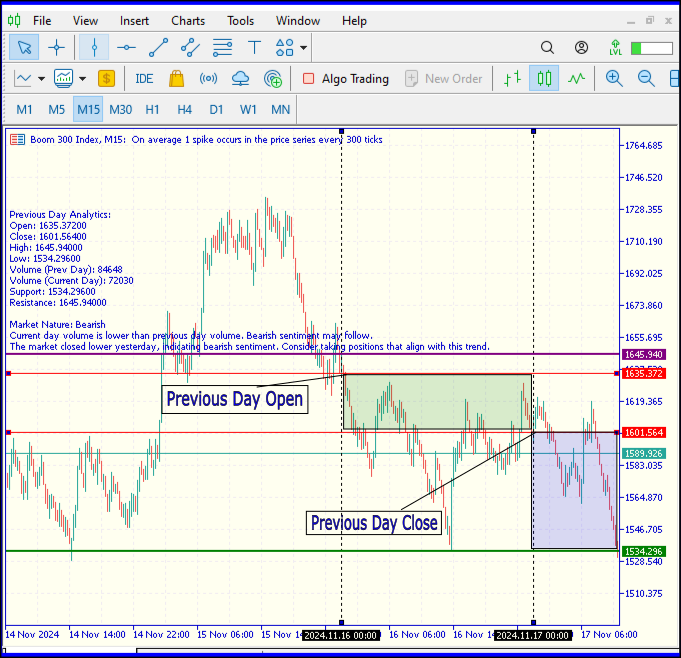
Fig 2. Analytics Comment Result
To learn more about the Analytical Comment Script, please click the following link:https://www.mql5.com/en/articles/15927
Overview of the Analytics Master (EA)
As we transition from a script to an Expert Advisor (EA), some information previously provided by the script will continue to be accessible through the EA, as mentioned in the review of the previous tool. However, the EA will also deliver additional insights and perform tasks that exceed the capabilities of the original script.
Additionally, our EA can now calculate market volatility, market spread, equity, balance, and the minimum and maximum possible lot sizes based on the account balance. I will provide further explanations for why this information is essential to know.
- Market Volatility
Volatility is a statistical measure of the dispersion of data around its mean over a specified period. Calculating market volatility is crucial for effective risk management, trade execution, and strategic planning in the financial markets. This EA automates the calculation of market volatility, making the process streamlined and user-friendly. While market volatility is typically measured using the formula below, our EA simplifies this function for ease of use.
Fig 3. Volatility Formula
To calculate volatility, we begin by determining the standard deviation as described above. To obtain the annualized volatility, you can multiply the standard deviation by the square root of the total number of trading days in a year, which is approximately 252. Learn more: https://quantra.quantinsti.com/glossary/Volatility
- Market Spread
Market spread, often referred to simply as "spread," is the difference between the bid and ask prices for a particular asset in a financial market. One important reason for knowing the market spread value is to assess trading costs. Understanding the spread helps traders and investors gauge the costs associated with entering and exiting positions.
A narrower spread typically indicates lower transaction costs and better trade execution, which is particularly crucial for high-frequency traders or those who execute numerous trades daily. Conversely, a wider spread can signal higher costs and might inform traders to reconsider their strategies or choose different assets for trading to minimize expenses. Thus, knowing the market spread value directly impacts the profitability of trades and overall investment performance.
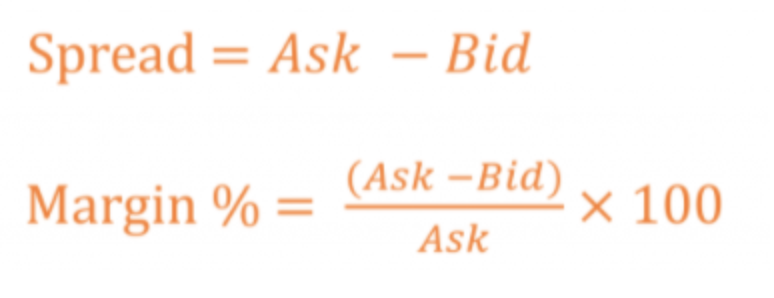
Fig 4. Market Spread Formula
- Possible Lot Sizes
To enhance the trader's experience, our Expert Advisor (EA) will simplify the calculations of market information and update this data every two hours. This ensures that traders remain informed with the most current market insights, allowing for more informed decision-making.
Exploring the Expert Advisor Code (Key Functions and Features)
The code includes several functionalities:
- Retrieving and displaying trading data for the previous and current days.
- Analyzing market direction based on price movements.
- Drawing trend lines on the chart.
- Calculating position size based on risk management principles.
Below is the code for our Expert Advisor (EA)
//+------------------------------------------------------------------+
//|                                           Analytics Master EA.mq5|
//|                                Copyright 2024, Christian Benjamin|
//|                                              https://www.mql5,com|
//+------------------------------------------------------------------+
#property copyright   "2024, MetaQuotes Software Corp."
#property link        "https://www.mql5.com/en/users/lynnchris"
#property description "EA for market analysis and commenting"
#property version     "1.0"
#property strict

// Inputs for risk management
input double RiskPercentage = 1.0;        // Percentage of account balance to risk per trade
input double StopLossMultiplier = 1.0;    // Multiplier for determining the stop loss distance
input int ATR_Period = 14;                // Period for ATR calculation

// Global variables for storing values
datetime lastUpdateTime = 0;
double previousDayOpen, previousDayClose, previousDayHigh, previousDayLow;
double previousDayVolume;
double currentDayVolume;
double support, resistance;

//+------------------------------------------------------------------+
//| Expert initialization function                                   |
//+------------------------------------------------------------------+
int OnInit()
  {
   lastUpdateTime = 0; // Set the initial update time
   return INIT_SUCCEEDED;
  }

//+------------------------------------------------------------------+
//| Expert deinitialization function                                 |
//+------------------------------------------------------------------+
void OnDeinit(const int reason)
  {
   ObjectsDeleteAll(0); // Clean up any drawn objects on the current chart
  }

//+------------------------------------------------------------------+
//| Expert tick function                                             |
//+------------------------------------------------------------------+
void OnTick()
  {
   UpdateMetrics(); // Call to the function that fetches and displays the metrics
  }

//+------------------------------------------------------------------+
//| Update metrics and display them                                  |
//+------------------------------------------------------------------+
void UpdateMetrics()
  {
// Check if 2 hours have passed since the last update
   if(TimeCurrent() - lastUpdateTime >= 2 * 3600)
     {
      // Fetch previous day's data
      datetime prevDay = iTime(NULL, PERIOD_D1, 1);
      previousDayOpen = iOpen(NULL, PERIOD_D1, 1);
      previousDayClose = iClose(NULL, PERIOD_D1, 1);
      previousDayHigh = iHigh(NULL, PERIOD_D1, 1);
      previousDayLow = iLow(NULL, PERIOD_D1, 1);
      previousDayVolume = iVolume(NULL, PERIOD_D1, 1);

      // Fetch current day's volume
      currentDayVolume = iVolume(NULL, PERIOD_D1, 0); // Volume for today

      // Calculate support and resistance
      support = previousDayLow - (previousDayHigh - previousDayLow) * 0.382; // Fibonacci level
      resistance = previousDayHigh + (previousDayHigh - previousDayLow) * 0.382; // Fibonacci level

      // Determine market direction
      string marketDirection = AnalyzeMarketDirection(previousDayOpen, previousDayClose, previousDayHigh, previousDayLow);

      // Calculate possible lot size based on risk management
      double lotSize = CalculateLotSize(support, resistance);

      // Retrieve account metrics
      double accountBalance = AccountInfoDouble(ACCOUNT_BALANCE);
      double accountEquity = AccountInfoDouble(ACCOUNT_EQUITY);

      // Calculate market spread manually
      double marketBid = SymbolInfoDouble(_Symbol, SYMBOL_BID);
      double marketAsk = SymbolInfoDouble(_Symbol, SYMBOL_ASK);
      double marketSpread = marketAsk - marketBid; // Calculate spread

      double minLotSize = SymbolInfoDouble(_Symbol, SYMBOL_VOLUME_MIN);
      double maxLotSize = SymbolInfoDouble(_Symbol, SYMBOL_VOLUME_MAX);

      // Calculate market volatility using ATR
      int atrHandle = iATR(NULL, PERIOD_H1, ATR_Period); // Get the ATR handle
      double atrValue = 0.0;

      if(atrHandle != INVALID_HANDLE)  // Check if the handle is valid
        {
         double atrBuffer[]; // Array to hold the ATR values
         if(CopyBuffer(atrHandle, 0, 0, 1, atrBuffer) > 0)  // Copy the latest ATR value
           {
            atrValue = atrBuffer[0]; // Retrieve the ATR value from the buffer
           }
         IndicatorRelease(atrHandle); // Release the indicator handle
        }

      // Create the output string including the last update time
      string lastUpdateStr = TimeToString(TimeCurrent(), TIME_DATE | TIME_MINUTES);
      string infoStr = StringFormat("Prev Day Open: %.2f\nPrev Day Close: %.2f\nPrev Day High: %.2f\nPrev Day Low: %.2f\n"
                                    "Prev Day Volume: %.0f\nCurrent Day Volume: %.0f\nMarket Direction: %s\n"
                                    "Support: %.2f\nResistance: %.2f\nAccount Balance: %.2f\nAccount Equity: %.2f\n"
                                    "Market Spread: %.2f\nMin Lot Size: %.2f, Max Lot Size: %.2f\n"
                                    "Market Volatility (ATR): %.2f\nLast Update Time: %s\nPossible Lot Size: %.2f",
                                    previousDayOpen, previousDayClose, previousDayHigh, previousDayLow,
                                    previousDayVolume, currentDayVolume, marketDirection,
                                    support, resistance, accountBalance, accountEquity, marketSpread,
                                    minLotSize, maxLotSize, atrValue, lastUpdateStr, lotSize);

      // Log the information
      Print(infoStr);

      // Display information on the chart
      Comment(infoStr);

      // Remove old trend lines and create new ones for previous day's high/low
      ObjectsDeleteAll(0);

      // Draw continuous trend lines
      DrawContinuousTrendLine("PrevDayHigh", previousDayHigh);
      DrawContinuousTrendLine("PrevDayLow", previousDayLow);

      // Update last update time
      lastUpdateTime = TimeCurrent();
     }
  }

//+------------------------------------------------------------------+
//| Analyze market direction                                         |
//+------------------------------------------------------------------+
string AnalyzeMarketDirection(double open, double close, double high, double low)
  {
   string direction;

   if(close > open)
     {
      direction = "Bullish";
     }
   else
      if(close < open)
        {
         direction = "Bearish";
        }
      else
        {
         direction = "Neutral";
        }

// Include current trends or patterns based on high and low for further analysis
   if(high > open && high > close)
     {
      direction += " with bullish pressure"; // Example addition for context
     }
   else
      if(low < open && low < close)
        {
         direction += " with bearish pressure"; // Example addition for context
        }

   return direction;
  }

//+------------------------------------------------------------------+
//| Draw a continuous trend line to the left on the chart            |
//+------------------------------------------------------------------+
void DrawContinuousTrendLine(string name, double price)
  {
   datetime startTime = TimeCurrent() - 720 * 3600; // Extend 24 hours into the past
   ObjectCreate(0, name, OBJ_TREND, 0, startTime, price, TimeCurrent(), price);
   ObjectSetInteger(0, name, OBJPROP_COLOR, (StringFind(name, "High") >= 0) ? clrRed : clrBlue);
   ObjectSetInteger(0, name, OBJPROP_WIDTH, 2); // Set thickness of the line
   ObjectSetInteger(0, name, OBJPROP_XSIZE, 0); // Set this property to extend the line infinitely to the left
  }

//+------------------------------------------------------------------+
//| Calculate the lot size based on risk management                  |
//+------------------------------------------------------------------+
double CalculateLotSize(double support, double resistance)
  {
   double stopLossDistance = MathAbs((support - resistance) * StopLossMultiplier);
   double riskAmount = AccountInfoDouble(ACCOUNT_BALANCE) * (RiskPercentage / 100.0);

// Get the tick size for the current symbol
   double tickSize = SymbolInfoDouble(_Symbol, SYMBOL_TRADE_TICK_SIZE);

// Calculate the lot size based on the stop loss and tick size
   double lotSize = riskAmount / (stopLossDistance / tickSize); // Adjusted for the correct pip size
   lotSize = NormalizeDouble(lotSize, 2); // Normalize the lot size to two decimal places

// Ensure lot size is above minimum lot size allowed by broker
   double minLotSize = SymbolInfoDouble(_Symbol, SYMBOL_VOLUME_MIN);
   if(lotSize < minLotSize)
      lotSize = minLotSize;

   return lotSize;
  }

//+------------------------------------------------------------------+
//+------------------------------------------------------------------+
Code Breakdown
1. Initialization and Properties
input double RiskPercentage = 1.0;         // Percentage of account balance to risk per trade
input double StopLossMultiplier = 1.0;     // Multiplier for determining the stop loss distance
input int ATR_Period = 14;                 // Period for ATR calculation

// Global variables for storing values
datetime lastUpdateTime = 0;
double previousDayOpen, previousDayClose, previousDayHigh, previousDayLow;
double previousDayVolume;
double currentDayVolume;
double support, resistance;
Input parameters enable users to customize the EA's behavior according to their trading preferences. Global variables are declared to store historical data, including opening, closing, high, and low prices from the previous day, as well as volumes and support/resistance levels.
2. OnInit and OnDeinit Functions
int OnInit()
{
    lastUpdateTime = 0; // Set the initial update time
    return INIT_SUCCEEDED;
}
OnInit: This function is executed when the EA is initialized. It sets the last update time to zero.
void OnDeinit(const int reason)
{
    ObjectsDeleteAll(0); // Clean up any drawn objects on the current chart
}
OnDeinit: This function is called when the EA is removed or stopped, cleaning up by deleting all chart objects.
3. Main Logic in OnTick
void OnTick()
{
    UpdateMetrics(); // Call to the function that fetches and displays the metrics
}
This function is triggered on every tick (price change). It calls the UpdateMetrics function to gather and analyze data.
4. UpdateMetrics Function
void UpdateMetrics()
{
    if (TimeCurrent() - lastUpdateTime >= 2 * 3600) // Check if 2 hours have passed since last update
    {
        // Fetch previous day's data
        datetime prevDay = iTime(NULL, PERIOD_D1, 1);
        previousDayOpen = iOpen(NULL, PERIOD_D1, 1);
        previousDayClose = iClose(NULL, PERIOD_D1, 1);
        previousDayHigh = iHigh(NULL, PERIOD_D1, 1);
        previousDayLow = iLow(NULL, PERIOD_D1, 1);
        previousDayVolume = iVolume(NULL, PERIOD_D1, 1);

        // Fetch current day's volume
        currentDayVolume = iVolume(NULL, PERIOD_D1, 0); // Volume for today

        // Calculate support and resistance
        support = previousDayLow - (previousDayHigh - previousDayLow) * 0.382;
        resistance = previousDayHigh + (previousDayHigh - previousDayLow) * 0.382;

        // Determine market direction
        string marketDirection = AnalyzeMarketDirection(previousDayOpen, previousDayClose, previousDayHigh, previousDayLow);

        // Calculate possible lot size based on risk management
        double lotSize = CalculateLotSize(support, resistance);

        // Retrieve account metrics
        double accountBalance = AccountInfoDouble(ACCOUNT_BALANCE);
        double accountEquity = AccountInfoDouble(ACCOUNT_EQUITY);

        // Calculate market spread manually
        double marketBid = SymbolInfoDouble(_Symbol, SYMBOL_BID);
        double marketAsk = SymbolInfoDouble(_Symbol, SYMBOL_ASK);
        double marketSpread = marketAsk - marketBid;

        // Calculate market volatility using ATR
        int atrHandle = iATR(NULL, PERIOD_H1, ATR_Period);
        double atrValue = 0.0;

        if (atrHandle != INVALID_HANDLE) // Check if the handle is valid
        {
            double atrBuffer[];
            if (CopyBuffer(atrHandle, 0, 0, 1, atrBuffer) > 0)
            {
                atrValue = atrBuffer[0];
            }
            IndicatorRelease(atrHandle); // Release the indicator handle
        }

        // Create the output string including the last update time
        string lastUpdateStr = TimeToString(TimeCurrent(), TIME_DATE | TIME_MINUTES);
        string infoStr = StringFormat("Prev Day Open: %.2f\nPrev Day Close: %.2f\nPrev Day High: %.2f\nPrev Day Low: %.2f\n"
                                       "Prev Day Volume: %.0f\nCurrent Day Volume: %.0f\nMarket Direction: %s\n"
                                       "Support: %.2f\nResistance: %.2f\nAccount Balance: %.2f\nAccount Equity: %.2f\n"
                                       "Market Spread: %.2f\nMin Lot Size: %.2f, Max Lot Size: %.2f\n"
                                       "Market Volatility (ATR): %.2f\nLast Update Time: %s\nPossible Lot Size: %.2f",
                                       previousDayOpen, previousDayClose, previousDayHigh, previousDayLow,
                                       previousDayVolume, currentDayVolume, marketDirection,
                                       support, resistance, accountBalance, accountEquity, marketSpread,
                                       minLotSize, maxLotSize, atrValue, lastUpdateStr, lotSize);

        // Log the information
        Print(infoStr);

        // Display information on the chart
        Comment(infoStr);

        // Remove old trend lines and create new ones for previous day's high/low
        ObjectsDeleteAll(0);

        // Draw continuous trend lines
        DrawContinuousTrendLine("PrevDayHigh", previousDayHigh);
        DrawContinuousTrendLine("PrevDayLow", previousDayLow);

        // Update last update time
        lastUpdateTime = TimeCurrent();
    }
}
- Time Check: The function only executes if 2 hours have passed since the last update, minimizing excessive calculations.
- Data Retrieval: iTime, iOpen, iClose, iHigh, iLow, and iVolume are used to gather data from the last day and current day.
- Support and Resistance: The script calculates Fibonacci levels based on previous day's low and high prices.
- Market Direction Analysis: Calls the AnalyzeMarketDirection function to assess market conditions.
- Lot Size Calculation: Calls the CalculateLotSize function to determine how much to trade based on risk management principles.
- Account and Market Metrics: Retrieves account balance, equity, and market spread for better trading decisions.
- ATR Calculation: Retrieves the Average True Range (ATR) to measure market volatility.
- Output Information: Formats and displays relevant metrics in the infoStr string and logs it with Print.
- Trend Line Creation: Cleans up old trend lines and creates new ones based on the previous day’s high and low prices.
5. Market Direction Analysis
string AnalyzeMarketDirection(double open, double close, double high, double low)
{
    string direction;

    if (close > open)
    {
        direction = "Bullish";
    }
    else if (close < open)
    {
        direction = "Bearish";
    }
    else
    {
        direction = "Neutral";
    }

    // Include current trends or patterns based on high and low for further analysis
    if (high > open && high > close)
    {
        direction += " with bullish pressure"; // Example addition for context
    }
    else if (low < open && low < close)
    {
        direction += " with bearish pressure"; // Example addition for context
    }

    return direction;
}
- Determine Market Direction: This function takes the open, close, high, and low prices from the previous day to determine whether the market is bullish, bearish, or neutral.
- Additional Insights: It checks for pressure indicators based on highs and lows, providing a more contextual analysis of market conditions.
6. Trend Line Drawing
void DrawContinuousTrendLine(string name, double price)
{
    datetime startTime = TimeCurrent() - 24 * 3600; // Extend 24 hours into the past
    ObjectCreate(0, name, OBJ_TREND, 0, startTime, price, TimeCurrent(), price);
    ObjectSetInteger(0, name, OBJPROP_COLOR, (StringFind(name, "High") >= 0) ? clrRed : clrBlue);
    ObjectSetInteger(0, name, OBJPROP_WIDTH, 2); // Set thickness of the line
    ObjectSetInteger(0, name, OBJPROP_XSIZE, 0); // Set this property to extend the line infinitely to the left
}
- Draw Trend Lines: This function creates a trend line on the chart for either the previous day's high or low, extending it back 24 hours.
- Customization: Each line has a color (red for high, blue for low) and a specified width.
7. Lot Size Calculation
double CalculateLotSize(double support, double resistance)
{
    double stopLossDistance = MathAbs((support - resistance) * StopLossMultiplier);
    double riskAmount = AccountInfoDouble(ACCOUNT_BALANCE) * (RiskPercentage / 100.0);

    // Get the tick size for the current symbol
    double tickSize = SymbolInfoDouble(_Symbol, SYMBOL_TRADE_TICK_SIZE);

    // Calculate the lot size based on the stop loss and tick size
    double lotSize = riskAmount / (stopLossDistance / tickSize);
    lotSize = NormalizeDouble(lotSize, 2); // Normalize the lot size to two decimal places

    // Ensure lot size is above minimum lot size allowed by broker
    double minLotSize = SymbolInfoDouble(_Symbol, SYMBOL_VOLUME_MIN);
    if (lotSize < minLotSize)
        lotSize = minLotSize;

    return lotSize;
}
- Risk Management: This function calculates the lot size based on the defined risk percentage relative to the user's account balance and the calculated stop loss distance.
- Normalization: Ensures that the lot size is within acceptable limits set by the broker.
Code Implementation and Testing
Implementing an Expert Advisor (EA) on MetaTrader 5: A Step-by-Step Guide- Open MetaTrader 5: Launch the MetaTrader 5 trading platform on your computer.
- Access MetaEditor: To open MetaEditor, go to the menu bar and click on Tools > MetaQuotes Language Editor, or simply press F4. Alternatively, if you have MetaEditor installed separately, you can run it directly.
- Insert the EA: In MetaEditor, select File > New > Expert Advisor or open an existing EA file (.mq5). If creating a new EA, follow the prompts to name and define it.
- Compile the EA: After editing your EA code, click the Compile button (or press F7). Ensure there are no errors; a successful compilation will generate an executable file.
- Load the EA into MetaTrader 5: Return to the MetaTrader 5 platform and open the Navigator panel (Ctrl + N). Find your compiled EA under the Expert Advisors section.
- Attach the EA to a Chart: Drag and drop the EA onto the desired chart, or right-click on the EA and select Attach to a chart. A settings window will appear for parameter customization.
- Enable Automated Trading: Ensure AutoTrading is enabled by clicking the green AutoTrading button on the MetaTrader 5 toolbar. If prompted, check the Allow automated trading option in the EA settings.
- Monitor Performance: Keep an eye on the EA's performance on the chart. Use the Strategy Tester for backtesting, if necessary.
- Adjust Settings as Necessary: You can modify parameters or settings directly from the EA settings window by right-clicking on the chart.
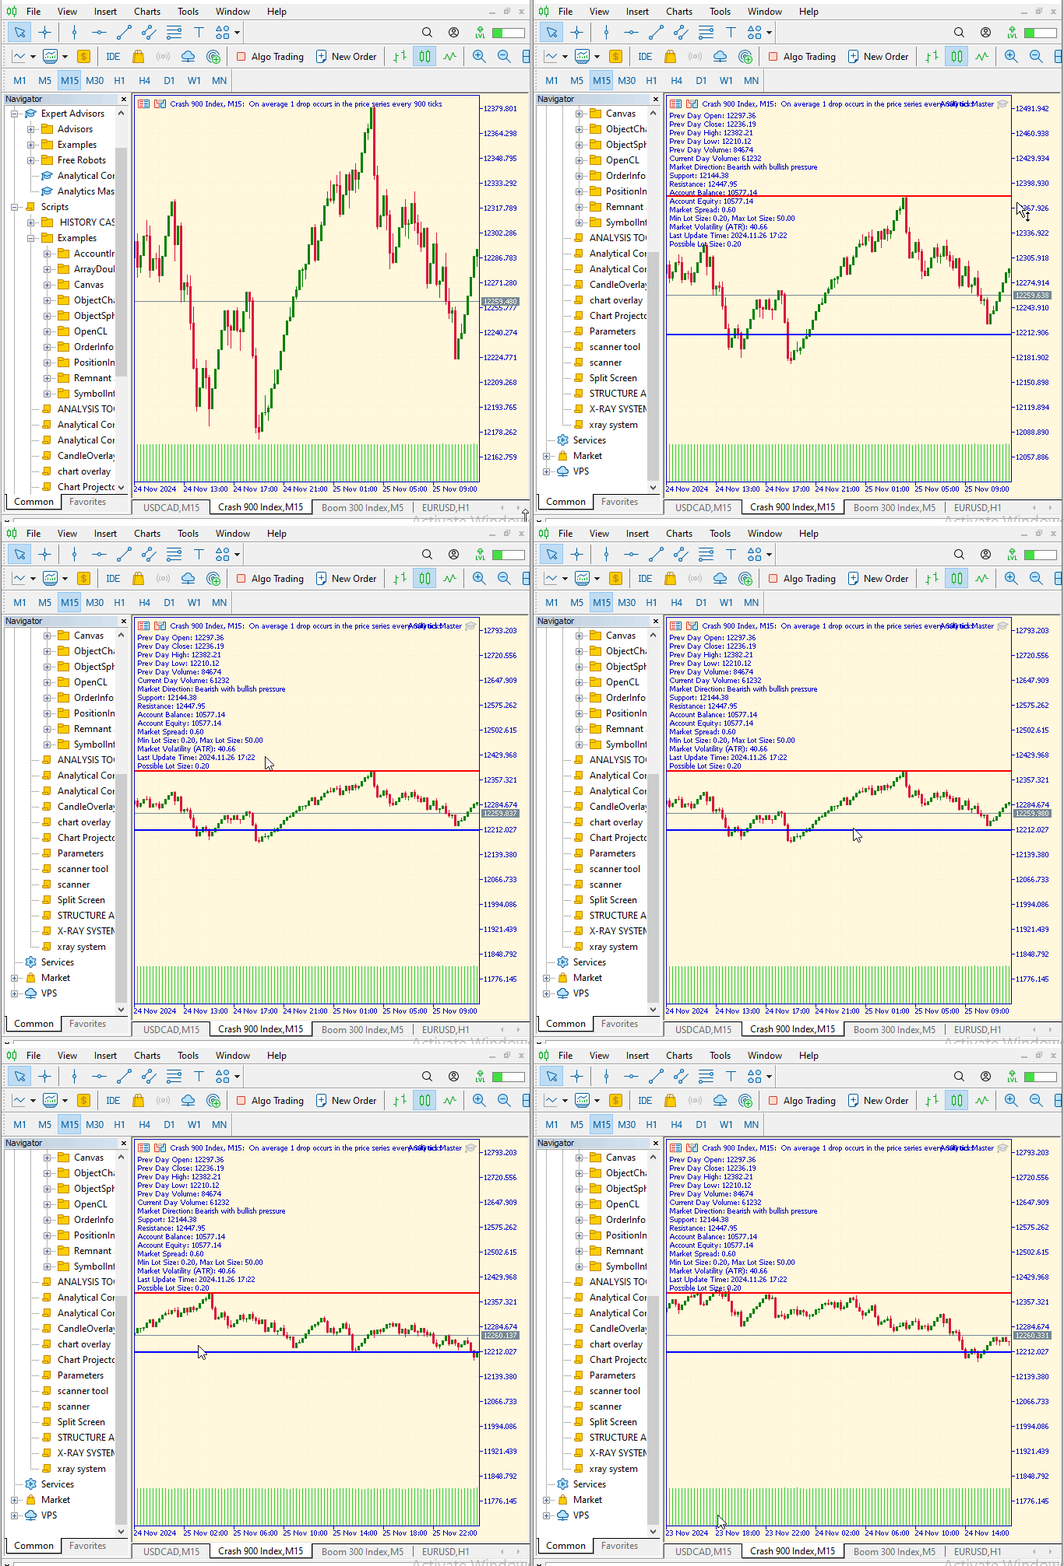
Fig 5. Analysis Result
Figure 5 illustrates the attachment of the EA to the chart, resulting in the outcomes displayed.
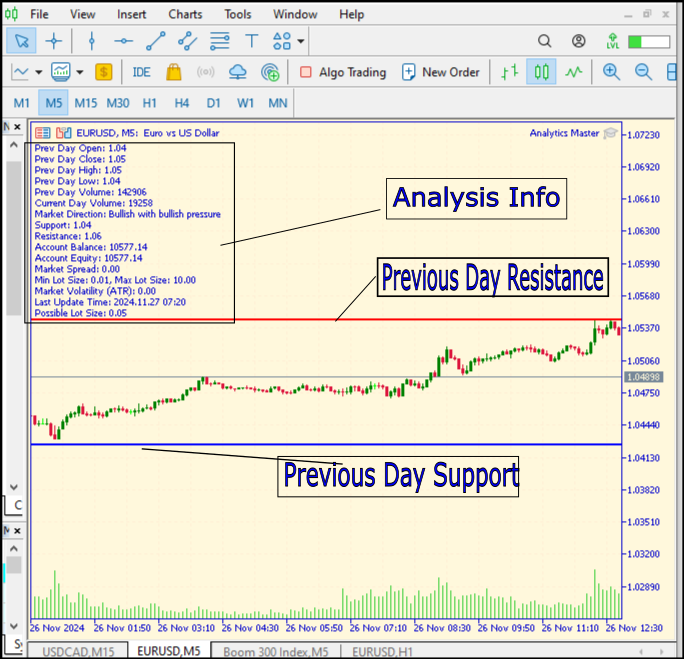
Fig 6. Analysis Result
Figure 6 above illustrates the overall performance of our Expert Advisor (EA), which is capable of automatically calculating key market metrics and presenting them in a chart format. The EA draws trendlines based on the previous day's support and resistance levels. It conducts regular updates of market information every two hours, as indicated in the last two diagrams, which also display the most recent update timestamps.
Conclusion
In summary, the successful deployment of the Analytics Master EA marks a significant step forward in automated trading. This EA not only automates the analysis of key market metrics but also provides valuable insights into support and resistance levels, helping traders make smarter decisions. By integrating effective risk management and delivering real-time updates, it supports traders in navigating the complexities of the market with confidence. Overall, this tool enhances trading efficiency and empowers users to stay informed and proactive in their trading strategies.
Take the time to backtest the EA on historical data to understand its performance in different market conditions. This will help you fine-tune its settings to suit your trading style. Regularly review the metrics and insights provided by the EA. Market conditions can change rapidly, so staying updated is crucial for making timely decisions. Always adhere to your risk management strategy. Adjust the risk percentage settings to align with your personal risk tolerance and account size. Engage with educational resources about trading strategies, market behavior, and technical analysis to complement the insights from the EA. If you encounter issues or have suggestions for improvements, consider providing feedback to the developer. User input is invaluable for making future enhancements.
By following these recommendations, you can maximize the effectiveness of the Analytics Master EA and improve your overall trading experience.
| Date | Tool Name | Description | Version | Updates | Notes |
|---|---|---|---|---|---|
| 01/10/24 | Chart Projector | Script to overlay the previous day's price action with ghost effect. | 1.0 | Initial Release | First tool in Lynnchris Tool Chest |
| 18/11/24 | Analytical Comment | It provides previous day's information in a tabular format, as well as anticipates the future direction of the market. | 1.0 | Initial Release | Second tool in the Lynnchris Tool Chest |
| 27/11/24 | Analytics Master | Regular Update of market metrics after every two hours | 1.01 | Second Release | Third tool in the Lynnchris Tool Chest |
Warning: All rights to these materials are reserved by MetaQuotes Ltd. Copying or reprinting of these materials in whole or in part is prohibited.
This article was written by a user of the site and reflects their personal views. MetaQuotes Ltd is not responsible for the accuracy of the information presented, nor for any consequences resulting from the use of the solutions, strategies or recommendations described.
 Generative Adversarial Networks (GANs) for Synthetic Data in Financial Modeling (Part 1): Introduction to GANs and Synthetic Data in Financial Modeling
 MQL5 Wizard Techniques you should know (Part 50): Awesome Oscillator
 Trading with the MQL5 Economic Calendar (Part 4): Implementing Real-Time News Updates in the Dashboard
 Trading with the MQL5 Economic Calendar (Part 3): Adding Currency, Importance, and Time Filters
- Free trading apps
- Over 8,000 signals for copying
- Economic news for exploring financial markets
You agree to website policy and terms of use
Hello Ifeanyichukwu Ikwecheghe,
Thank you for your positive feedback! I'm glad to hear you find the tool to be valuable.
To answer your questions:
1. The tool does not open trades for you; instead, it provides analysis and signals that you can use to make informed trading decisions. You will manually execute trades based on its predictions.
2. The signals are periodically updated, roughly every two hours, allowing you to adapt to changing market conditions. While they do not reflect real-time changes throughout the session, the updates will help you understand market sentiment shifts, whether it be a bearish state changing to bullish or vice versa.
Your views and further suggestions are welcome for discussion.
The first two tools are independent:
So, the second is not an updated version of the first. The real continuation is Analytics Master EA, which expands on the Analytical Comment.
This script/EA is only available for MT5. There is no MT4 version, since MT4 is discontinued and no longer maintained, so development only makes sense on MT5.