
Price Action Analysis Toolkit Development (Part 58): Range Contraction Analysis and Maturity Classification Module

Contents
- Introduction
- Why Compression Matters in Price Action Trading
- Key Concepts & Logic
- Visual & Informational Elements
- Input Parameters
- MQL5 Implementation
- Testing the Tool and Observed Outcomes
- Conclusion
Introduction
One of the most reliable observations in price action analysis is also one of the simplest: sustained expansions are often preceded by periods of relative calm. After a strong directional move, momentum slows, participation balances, ranges tighten, and short-term volatility contracts. In numerous instances, this compression phase sets the context for the next directional expansion.
Mark Minervini describes variations of this behavior through the Volatility Contraction Pattern (VCP). Other traders refer to it as “tight price action” or a “coiled spring,” while John Bollinger formalized part of the idea with the well-known Band Squeeze. Regardless of terminology, the behavior itself appears across markets—forex, indices, equities, and crypto—because price rarely transitions directly from trend to trend without an intermediate balancing phase.
The practical challenge has always been the same: how do you objectively distinguish between a high-quality compression phase—characterized by genuine absorption and repeated boundary interaction—and a low-quality sideways drift that offers little structural information?
Most visual tools approach this problem using bands, channels, or volatility measures. While effective, these methods often depend on derived indicators that respond after structure has already formed. Pure discretionary price action traders solve the problem visually by counting tests, observing wick behavior, and judging absorption by experience—but doing this consistently across multiple charts is difficult.
This is the motivation behind compression readiness—a lightweight, closed-bar MQL5 indicator designed to formalize how experienced price action traders evaluate compression, using repeatable rules and clear visual feedback.
The tool:
- Detects structural range contraction relative to a prior window
- Measures candle overlap, boundary tests, and rejection behavior
- Grades compression maturity (early / building / mature)
- Estimates directional bias using candle geometry alone (CLV and rejection asymmetry)
- Invalidates ranges that have already failed or degrade into low-quality drift
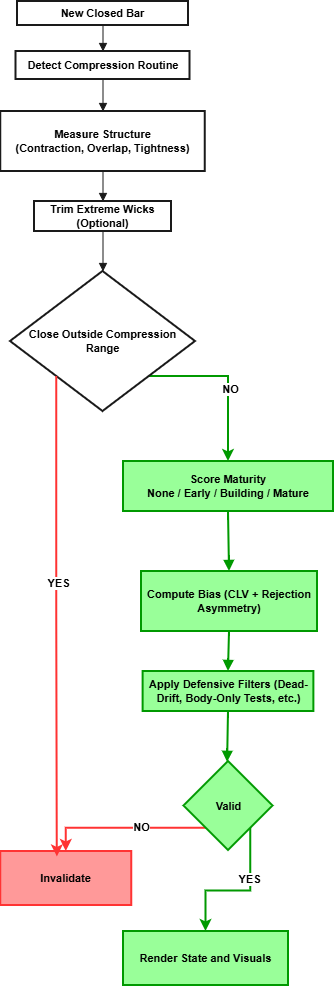
In this article, I’ll walk through the reasoning behind the detection logic, the most important filters (trimmed ranges, dead-drift handling, close-out invalidation), how maturity scoring is constructed, and how to integrate the tool into live price action analysis without treating it as a predictive signal.
Let’s dive in.
Why Compression Matters in Price Action Trading
A recurring observation in price action analysis is that directional expansions are often preceded by periods of reduced volatility. During these phases, price ranges narrow, momentum slows, and participation becomes more balanced as the market transitions from directional movement into temporary equilibrium. This contraction–expansion cycle reflects how markets alternate between phases of imbalance and rebalancing.
In the absence of strong external drivers—such as sharp selloffs, major macroeconomic releases, or unexpected news—volatility typically compresses rather than remaining elevated. In trending environments, particularly gradual advances, this compression is reinforced as uncertainty diminishes, counter-trend participation weakens, and price drifts within increasingly constrained ranges. Over time, this process can create conditions where relatively small shifts in participation lead to outsized directional movement.
Universal Compression Setups
This behavior appears across markets and trading styles under different names, but the underlying mechanics remain similar. Volatility Contraction Pattern (VCP), popularized by Mark Minervini, describes consolidations within established trends or bases where price retracements become progressively shallower. Early pullbacks may be relatively deep, followed by smaller corrections as the range tightens and volatility declines. Volume often contracts during this phase, suggesting reduced counter-trend pressure. The pattern reflects a gradual absorption process rather than a single event and can appear on multiple timeframes or within broader formations.
The coiled spring analogy is commonly used to describe similar conditions. Price oscillates within narrowing boundaries, producing a visual compression of range. The emphasis is not on prediction, but on recognizing that sustained balance within a tightening structure can precede renewed directional movement once that balance resolves.
Related concepts—such as Bollinger Band Squeezes or tight price action bases—are variations on the same theme: volatility contracts as the market consolidates, then expands as participation shifts. Across these approaches, the common principle is that markets rarely transition directly from one sustained trend to another without an intervening consolidation phase.
What Defines High-Quality Compression?
Not all consolidations provide meaningful structural information. Higher-quality compression phases tend to share several characteristics:
Absorption
Sustained sideways movement often reflects gradual accumulation or distribution by larger participants. This can be observed through repeated interactions with range boundaries that fail to produce decisive breaks. Wick rejections and closes back inside the range indicate unsuccessful attempts by one side to regain control.
Repeated boundary interaction
Multiple tests of the same highs or lows without follow-through suggest that liquidity is being absorbed rather than released. Each test contributes additional information about the strength or weakness of participation at those levels.
Maturity over time
As compression develops, ranges often tighten relative to prior periods, candle overlap increases, and volatility continues to contract. Asymmetry may emerge, such as higher lows or lower highs within the range, reflecting directional pressure without immediate resolution.
![]()
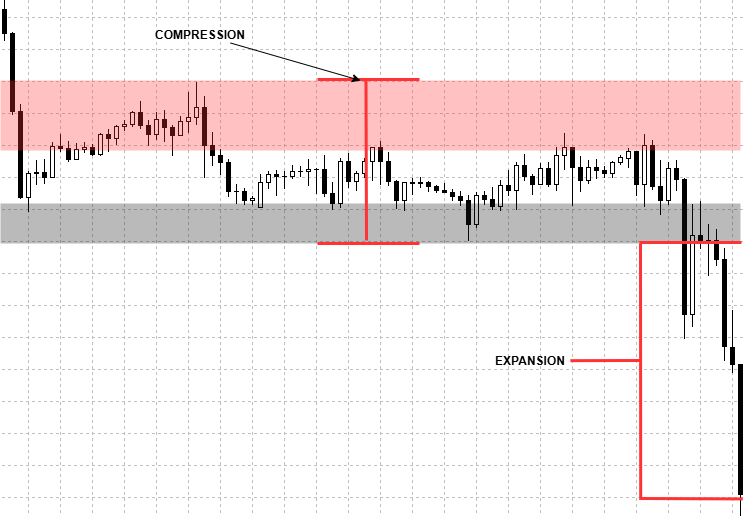
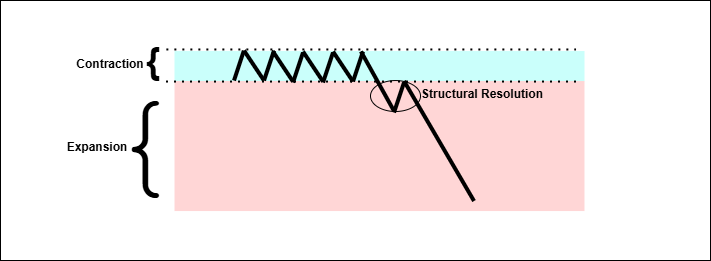
The diagram above illustrates a compression phase on an actual price chart, advancing through early, building, and mature stages. As the range develops, candle overlap increases, boundary interactions grow more frequent (with wick rejections indicating absorption), and volatility contracts progressively. Stage labels denote relative compression quality and maturity within the range, rather than a fixed sequence or predictive timeline. The setup resolves with directional expansion, reflecting built tension.
Together, these elements describe a state of balance that becomes increasingly sensitive to change rather than a random or stagnant sideways market.
Common Pitfalls
Compression-based analysis also presents several common challenges:
Low-quality drift
Very narrow ranges that persist without meaningful tests or rejection often reflect low engagement rather than absorption. These conditions tend to produce extended sideways movement rather than directional expansion.
False range breaks
Brief excursions beyond range boundaries that lack follow-through are common, particularly in immature compressions. These moves often reverse quickly when participation is insufficient to sustain expansion.
Over-interpretation in choppy conditions
In low-liquidity or non-trending environments, apparent contractions may simply reflect noise. Treating every tight range as meaningful without evidence of structure or maturity increases the likelihood of poor decision-making.
The key distinction lies in structure, not appearance. High-quality compression is defined by progressive tightening, repeated and informative boundary interaction, and emerging asymmetry—rather than by narrow ranges alone. The Compression Readiness tool is designed to formalize these observations by quantifying contraction, overlap, test and rejection behavior, maturity progression, and absorption-based bias. Its purpose is not to predict outcomes, but to provide structured context for evaluating whether a compression phase reflects meaningful market balance or low-information drift.
Key Concepts & Logic
The Compression Readiness indicator converts previously discussed price action principles into a structured detection framework. All calculations are performed on closed bars only, ensuring stable, non-repainting behavior in both historical and live chart environments.
The DetectCompression routine evaluates a recent price window (default: 30 bars) against a preceding reference window. It measures contraction, candle overlap, boundary interaction, rejection behavior, and relative range size. These measurements feed a point-based model that classifies compression maturity, while directional bias is evaluated separately using candle geometry alone.
The logic is divided into four primary components.
1. Compression Detection
Compression is identified by systematically comparing the current window’s structure to that of the prior reference period.
Range contraction is assessed by measuring the current high–low envelope relative to the reference window; a meaningful reduction—governed by InpContractionMax—contributes positively to overall compression quality. Candle overlap is evaluated by calculating shared price territory between consecutive candles, where higher overlap ratios indicate reduced directional momentum and more balanced participation. Range tightness is examined both absolutely and relatively: the current range height is checked against a fixed maximum threshold (InpBoxTightMaxPts), while the average candle size is compared to historical values to exclude periods of unusually low activity.
To enhance robustness, an optional trimmed envelope (InpUseTrimmedBox) excludes a configurable number of extreme wicks (InpTrimCount), ensuring that isolated price spikes do not distort the perceived range. Finally, a defensive invalidation rule removes the entire setup if any candle closes outside the defined box (InpInvalidateOnCloseOut), as this signals that the compression has already resolved or failed.
2. Maturity Scoring System
Compression quality is graded using a simple additive scoring model, keeping the logic transparent and computationally efficient.
Points are accumulated from independent structural conditions, including contraction strength, overlap, absolute and relative tightness, boundary interaction, and the presence of rejection candles. Rejection is defined as significant opposing wicks with closes returning toward the range interior.
The final score maps to four maturity states:
- None; insufficient structural evidence
- Early: basic contraction and overlap present
- Building: increasing interaction and tightening
- Mature: strongest combination of contraction, tests, and rejections
Thresholds are exposed as inputs (InpScoreNeedEarly, InpScoreNeedBuilding, InpScoreNeedMature), allowing sensitivity adjustment without code changes. An optional dead-drift filter (InpFilterDeadDrift) penalizes or invalidates compressions that are disproportionately small relative to the average recent candle size, filtering low-engagement ranges.
3. Absorption & Directional Bias
Directional bias is derived exclusively from candle structure. The mean Close Location Value (CLV) measures where closes occur within candle ranges over a short lookback, providing a baseline view of directional pressure. Rejection asymmetry compares upper-wick rejections (failed advances) against lower-wick rejections (defended declines), with significant opposing wicks contributing to directional weighting.
These inputs form a raw bias score, classified as bullish, bearish, or neutral. Optional smoothing (InpSmoothBias) reduces sensitivity to isolated candles. Bias strength is reported qualitatively (very low to high) to provide context without implying certainty.
4. Defensive Filters Summary
Several safeguards ensure only structurally meaningful compressions are retained:
- Wick-trimmed ranges (spike removal)
- Close-out invalidation
- Dead-drift filtering
- Optional body-only boundary testing (InpUseBodyBoxForTests) for stricter interaction criteria
Together, these filters reduce false positives in choppy, low-liquidity, or already-resolved market conditions.
Visual & Informational Elements
This tool is designed to present its analysis visually. All graphical elements are derived from closed-bar evaluations and update only when the internal state changes.
Compression Range Box
When a valid compression state is detected, the indicator draws a rectangular range covering the active analysis window. The box represents the effective compression envelope after optional trimming and validation, not a forecasted boundary.
Box color reflects the current analytical state:
- Neutral/inactive when no meaningful compression is present
- State-colored when compression is classified as early, building, or mature
- The box is redrawn only when the underlying state changes, ensuring visual stability during live charting.
Boundary Interaction Markers
Optional markers highlight interactions with the top and bottom of the compression range. These markers indicate where price has tested the range boundaries within tolerance, providing visual confirmation of absorption and rejection behavior already accounted for internally. Markers are descriptive only and do not imply significance beyond confirming that structural interaction has occurred.
Structural Context Labels
Recent swing structure is optionally annotated to provide contextual reference around the compression range. These labels identify relative swing relationships (higher highs, lower highs, higher lows, lower lows) based on confirmed swing points. They are intended to aid interpretation of compression within a broader price structure rather than to classify trend or direction.
Bias Change Indicators
When enabled, bias-change arrows are plotted only when the internally derived bias state transitions between neutral, bullish, or bearish. These arrows are anchored precisely at the close of the bar where the change is confirmed. They represent state transitions, not directional calls, and do not persist unless the bias state remains valid.
Informational Panel
A compact informational panel summarizes the current analytical state in text form. It reports:
- Compression status and maturity level
- Contraction and overlap measurements
- Boundary test and rejection counts
Directional bias and qualitative strength
The panel updates only on closed bars and mirrors the same logic used for all visual elements, ensuring consistency between numeric context and chart annotations.
Design Intent
All visual and informational components are subordinate to the underlying analysis. They exist to make structural conditions observable without adding interpretation layers, execution cues, or timing suggestions.
By keeping visuals descriptive and state-driven, the indicator remains suitable for both historical study and live contextual analysis without altering price behavior.
Input Parameters
The compression readiness tool, exposes a limited set of inputs intended to adjust sensitivity and visual behavior without altering the underlying detection logic. Defaults are chosen to reflect common price action conditions while remaining adaptable across symbols and timeframes.
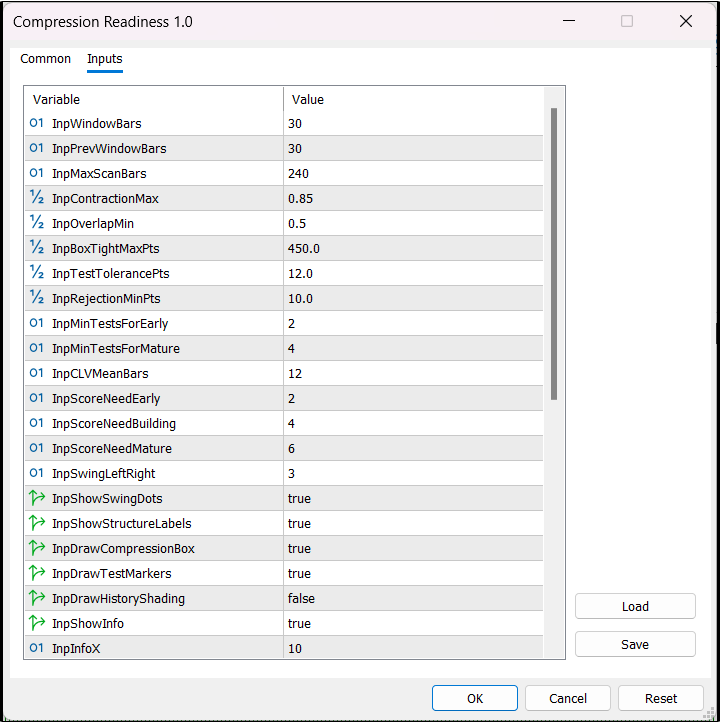
Parameters are grouped by function rather than by internal code order.
Window Configuration
These parameters define the analysis horizon used for structural comparison.
Window Bars (InpWindowBars)
- Sets the size of the recent analysis window. This window represents the active compression candidate.
Previous Window Bars (InpPrevWindowBars)
- Defines the reference period used to evaluate relative contraction. Using a separate window prevents compression from being assessed in isolation.
The default pairing (30 / 30 bars) provides sufficient structural context without over-smoothing short-term behavior.
Compression Sensitivity
These inputs control how strictly contraction and balance are evaluated.
- Maximum Contraction Ratio (InpContractionMax): Limits how large the average recent candle range may be relative to the reference window for compression to qualify.
- Minimum Overlap Ratio (InpOverlapMin): Sets the required degree of shared price territory between consecutive candles.
- Maximum Box Height (InpBoxTightMaxPts): Caps the absolute height of the compression range to prevent overly wide structures from being classified as compression.
Together, these parameters define whether a structure is genuinely tightening or merely consolidating loosely.
Boundary Interaction & Rejection
These inputs govern how price interaction with the compression boundaries is interpreted.
- Test Tolerance (InpTestTolerancePts): Controls how close price must come to the range boundary to count as a test.
- Minimum Rejection Size (InpRejectionMinPts): Defines the minimum wick length required to qualify as a rejection.
- Minimum Tests for Classification (InpMinTestsForEarly, InpMinTestsForMature): Specify how many boundary interactions are required before compression can advance through maturity stages.
These parameters help distinguish meaningful absorption from incidental touches.
Maturity Scoring Thresholds
Compression maturity is determined by mapping the accumulated score to discrete states.
- Score for Early (InpScoreNeedEarly)
- Score for Building (InpScoreNeedBuilding)
- Score for Mature (InpScoreNeedMature)
Adjusting these thresholds shifts how quickly compression advances through states without changing the individual scoring components.
Bias Estimation
Bias-related inputs affect how directional pressure is derived from candle structure.
- CLV Lookback (InpCLVMeanBars): Sets the number of bars used to compute the mean Close Location Value.
- Bias Smoothing (InpSmoothBias, InpBiasSmoothBars): Enables optional smoothing of bias classification across multiple bars to reduce sensitivity to isolated candles.
Bias inputs influence classification stability rather than direction itself.
Robustness & Validation
These parameters control defensive behavior and noise suppression.
- Trimmed Range (InpUseTrimmedBox, InpTrimCount): Enables removal of extreme wicks when constructing the compression envelope.
- Invalidate on Close-Out (InpInvalidateOnCloseOut): Disqualifies compression if any candle closes outside the defined range.
- Dead-Drift Filter (InpFilterDeadDrift, InpMinBoxToAvgRange): Penalizes or invalidates ranges that are disproportionately small relative to average recent candle size.
- Body-Only Boundary Tests (InpUseBodyBoxForTests): Restricts boundary interaction checks to candle bodies for stricter validation.
Visual options affect presentation only and do not influence detection.
- Compression Box and Markers: Toggle rendering of the range box and boundary interaction markers.
- Bias Arrows and Structure Labels: Enable or disable contextual annotations derived from internal state changes.
Inputs are designed to adjust sensitivity rather than behavior. Large deviations from defaults should be made incrementally, as tightening multiple parameters simultaneously can suppress valid structures or over-filter compressions in low-volatility environments.
MQL5 Implementation
Detecting compression conditions ahead of a potential structural resolution relies on a price-action–only approach that examines how price behaves within carefully defined historical windows. Rather than depending on lagging indicators, the implementation focuses on measuring how ranges contract, how candles interact within those ranges, and how internal pressure evolves. This requires careful preparation of price data, which serves as the foundation for all subsequent analysis.
Functions such as WindowHighLow() and WindowHighLowTrimmed() are used to determine the highest and lowest prices within both the current window and a reference window. Optional wick trimming reduces the influence of isolated spike candles. These bounds define the compression box, which acts as both an analytical reference and a visual representation of congestion on the chart.
void WindowHighLowTrimmed(int start,int count,int trim,double &hi,double &lo)
{
   hi=-DBL_MAX; lo=DBL_MAX;
   int totalBars = Bars(_Symbol,_Period);
   int n = MathMin(count, totalBars-start);
   if(n<=0){ hi=0; lo=0; return; }

   double highs[], lows[];
   ArrayResize(highs,n);
   ArrayResize(lows,n);

   for(int i=0;i<n;i++)
   {
      highs[i] = iHigh(_Symbol,_Period,start+i);
      lows[i]  = iLow (_Symbol,_Period,start+i);
   }

   ArraySort(highs);
   ArraySort(lows);

   int t = MathMax(0, MathMin(trim, (n-1)/2));
   lo = lows[t];
   hi = highs[n-1-t];
}
To contextualize volatility and avoid highlighting excessively quiet conditions, AvgRange() computes the average candle range across the same windows.
double AvgRange(int start,int count)
{
   double sum=0; int n=0;
   for(int i=start; i<start+count && i<Bars(_Symbol,_Period); i++)
   {
      double r=CandleRange(i);
      if(r>0){ sum+=r; n++; }
   }
   return (n>0 ? sum/n : 0.0);
}
In parallel, CandleCLV() and OverlapRatioWindow() evaluate where candles close within their ranges and the degree of price overlap between consecutive candles, providing additional insight into the internal structure of the range.
double CandleCLV(int s)
{
   double h=iHigh(_Symbol,_Period,s);
   double l=iLow (_Symbol,_Period,s);
   double c=iClose(_Symbol,_Period,s);
   if(h<=l) return 0.0;
   return (2.0*c - h - l) / (h - l);
}

double OverlapRatioWindow(int start,int count)
{
   double sum=0; int n=0;
   for(int i=start; i<start+count-1 && (i+1)<Bars(_Symbol,_Period); i++)
   {
      double h1=iHigh(_Symbol,_Period,i),   l1=iLow(_Symbol,_Period,i);
      double h2=iHigh(_Symbol,_Period,i+1), l2=iLow(_Symbol,_Period,i+1);

      double inter = MathMin(h1,h2) - MathMax(l1,l2);
      double uni   = MathMax(h1,h2) - MathMin(l1,l2);
      if(uni<=0) continue;

      double r = (inter>0 ? inter/uni : 0.0);
      sum += r; n++;
   }
   return (n>0 ? sum/n : 0.0);
}
The core analysis is implemented in the DetectCompression() routine, which evaluates the compression state in a series of steps. The process begins by establishing the boundary levels of the compression zone, considering the selected window sizes and any trimming options.
void DetectCompression()
{
   if(InpUseTrimmedBox)
      WindowHighLowTrimmed(1, InpWindowBars, InpTrimCount, boxTop, boxBot);
   else
      WindowHighLow(1, InpWindowBars, boxTop, boxBot);
   // Further processing follows...
}
Before further evaluation, defensive checks are applied: if recent candle closes occur outside the defined range (InpInvalidateOnCloseOut), or if the range height indicates a low-engagement environment (InpFilterDeadDrift), the structure is invalidated early.
if(InpInvalidateOnCloseOut)
{
   for(int i=1; i<=InPWindowBars && i<Bars(_Symbol,_Period); i++)
   {
      double cClose=iClose(_Symbol,_Period,i);
      if(cClose>boxTop || cClose<boxBot)
      {
         // Invalidate structure
         return;
      }
   }
}
If the structure remains intact, the routine compares average recent candle ranges against those of the reference window to quantify contraction.
double recentAvg=AvgRange(1, InpWindowBars);
double prevAvg=AvgRange(1+InpWindowBars, InpPrevWindowBars);
contraction= (prevAvg>0 ? recentAvg/prevAvg : 1.0);
Boundary interaction is then assessed through counts of tests and rejections at the upper and lower limits of the range.
topTests=0; bottomTests=0; topRejects=0; bottomRejects=0;
double tol=InpTestTolerancePts*_Point;
double rej=InpRejectionMinPts*_Point;

for(int i=1; i<=InpWindowBars && i<Bars(_Symbol,_Period); i++)
{
   double h=iHigh(_Symbol,_Period,i);
   double l=iLow(_Symbol,_Period,i);
   double o=iOpen(_Symbol,_Period,i);
   double c=iClose(_Symbol,_Period,i);

   if(h > boxTop - tol)
   {
      topTests++;
      // Additional boundary checks...
   }
   if(l < boxBot + tol)
   {
      bottomTests++;
      // Additional boundary checks...
   }
}
These measures describe how price is interacting within the congestion zone and whether activity is being absorbed rather than released. To summarize these observations, an additive scoring model evaluates contraction, overlap, box tightness, and rejection characteristics against predefined thresholds such as InpScoreNeedEarly. Based on the resulting score, the compression is classified as early, building, or mature. This classification reflects the relative development of the compression structure, without implying direction or timing.
int score=0;
if(contraction <= InpContractionMax) score+=2;
// Additional scoring logic...
if(score >= InpScoreNeedEarly)
   maturity=MAT_EARLY;
// Further classification...
Bias assessment is performed independently from maturity grading. Mean Close Location Value (CLV) over a short lookback captures where price tends to close within its range, while rejection asymmetry compares failed advances against defended declines. These components are combined and mapped to bullish, bearish, or neutral states using BiasFromRaw().
double meanClv=MeanCLV(1, InpCLVMeanBars);
double rawBias=CalculateBias(rawData);
bias=BiasFromRaw(rawBias);
When enabled, bias smoothing incorporates multiple bars to reduce sensitivity to isolated candles. Bias state changes are marked visually at the exact candle close where the transition occurs. Visual elements are used to place the analysis in context. The compression zone is drawn using DrawCompressionBox(), with optional trimming applied for clarity.
DrawCompressionBox(t1, t2, top, bottom, boxColor);
Markers highlight areas of repeated interaction with the range, while historical shading indicates periods of sustained congestion. Swing highs and lows are marked using DrawSwingDots(), and recent structure labels provide additional context around local structural pivots without altering the analytical logic.
An information panel aggregates key metrics—including maturity state, score, range height, contraction ratio, overlap, bias state, and rejection counts—and presents them as a concise vertical list via RenderInfo(). This panel summarizes the current compression state derived strictly from closed-bar data.
By operating exclusively on confirmed price data, the implementation avoids lagging indicators and forward-looking assumptions. Defensive mechanisms such as wick trimming and dead-drift filtering help reduce structural noise, while configurable parameters allow the analysis to be adapted across instruments and timeframes. The result is a structured framework for identifying and monitoring compression development based solely on observable price behavior.
Testing the Tool and Observed Outcomes
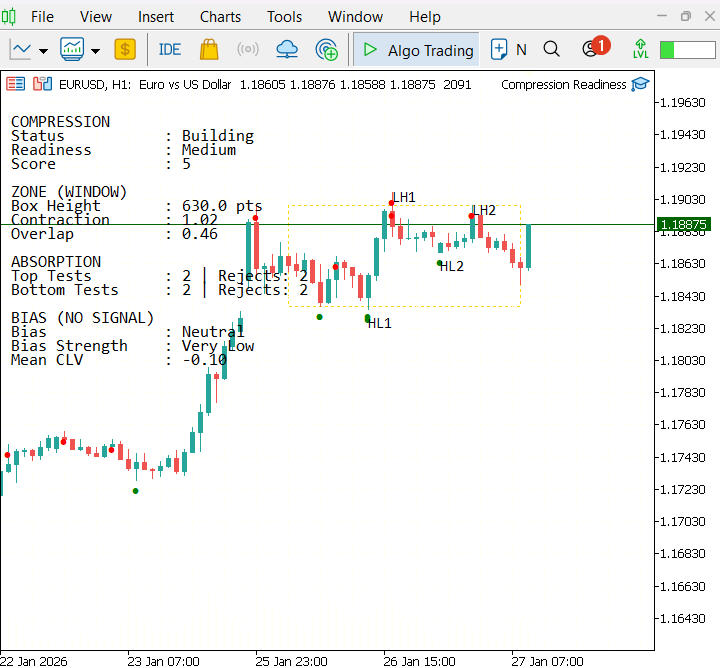
In this section, I will present the tests I have conducted and the results obtained. These tests were performed both on live chart data and through backtesting historical results, primarily focusing on the EURUSD instrument. The diagram below is a GIF generated in the Strategy Tester, illustrating the behavior of the system on historical data.
The dashed rectangle marks the active compression window. Its height reflects the measured range after optional wick trimming, while internal candle overlap and boundary interactions are evaluated to assess the quality of contraction. The information panel on the left summarizes the current state: the maturity classification, score, window height, contraction ratio, overlap, and absorption metrics such as boundary tests and rejections. Bias is reported separately as a structural state derived from candle geometry—namely, CLV and rejection asymmetry—with qualitative strength indicators. It’s important to note that no execution logic is implied by this visualization. Swing annotations (HL/LH) provide additional structural context without influencing the compression logic. Bias-change arrows, when present, are anchored precisely at the close of the bar where the bias state transitions, reflecting closed-bar evaluation only.
Reflect the same visualization in the following diagram, which was also captured in the strategy tester.

Finally, we can observe the diagram from the live chart testing. This concludes the overview of the visualization. The same structural elements and visual conventions demonstrated in the Strategy Tester are preserved during live chart operation, reflecting consistent behavior across historical reconstruction and real-time evaluation.
Together, these visuals provide a clear way to observe compression structure, development stage, and directional context as they evolve on closed bars. This consistency allows the analytical state of the market to be monitored in the same manner regardless of whether the chart is viewed retrospectively or in real time, without introducing execution logic or forward-looking assumptions.
Conclusion
This article described the implementation of a compression analysis module evaluated on finished candles. The logic examines range contraction, boundary interaction, rejection behavior, and candle structure to classify compression maturity and directional context. No indicators, execution logic, or predictive assumptions are involved. The module is intended to operate as an analytical component within broader price-action analysis workflows and can be applied across different symbols and timeframes.
Warning: All rights to these materials are reserved by MetaQuotes Ltd. Copying or reprinting of these materials in whole or in part is prohibited.
This article was written by a user of the site and reflects their personal views. MetaQuotes Ltd is not responsible for the accuracy of the information presented, nor for any consequences resulting from the use of the solutions, strategies or recommendations described.

- Free trading apps
- Over 8,000 signals for copying
- Economic news for exploring financial markets
You agree to website policy and terms of use