
Price Action Analysis Toolkit Development (Part 59): Using Geometric Asymmetry to Identify Precision Breakouts from Fractal Consolidation

Contents
- Introduction
- Strategy Overview and Trading Logic
- MQL5 Implementation and Code Structure
- Testing and Outcomes
- Conclusion
Introduction
Genuine breakout opportunities rank among the most rewarding yet elusive setups in price-action trading. Markets often emerge from consolidation with convincing momentum, only to stall or reverse shortly afterward. In numerous instances, these failures occur because the breakout lacks sufficient internal structure or sustained directional pressure. The real challenge, therefore, is not identifying ranges, but recognizing which consolidations are genuinely preparing for durable trend development.
Part 58 explored how internal imbalance and directional bias develop within price action ahead of expansion, framing breakouts as the result of gradual structural shifts rather than isolated or random events. Building directly on that foundation, this article introduces the Geometric Asymmetry (GA) Breakout framework—a systematic, rule-based methodology for assessing whether a consolidation is truly resolving with directional intent. The GA approach evaluates internal price behavior through fractal-derived swing structure and geometric relationships to identify bias formation before any boundary is breached.
By emphasizing structural integrity, proportional imbalance, and layered confirmation, the framework aims to filter false expansions and deliver more reliable range-to-trend signals across varying market conditions.
Strategy Overview and Trading Logic
This strategy approaches breakout detection as a structural and geometric problem rather than a volatility event. Price is modeled as a sequence of swings forming constrained structures, where imbalance can be measured objectively before expansion occurs. The geometric asymmetry breakout strategy evaluates consolidation not only by its boundaries, but also by the proportional relationships between its internal price legs. Directional bias is inferred from measurable asymmetry in distance, slope, and time, allowing breakouts to be anticipated with structure-based confirmation rather than reactionary signals.
What differentiates this strategy is its focus on internal price structure. Instead of relying solely on volatility expansion or range breaks, it evaluates how price behaves within the consolidation to determine which side is gaining control.
Underlying Market Mechanics
Primary Concept
Extended consolidation marked by specific geometric characteristics often precedes decisive price expansion. When price compresses into a defined structure—such as a rectangle or contracting formation—and the most recent swing becomes disproportionately dominant, it suggests that one side of the market is asserting influence. This imbalance typically resolves through a directional breakout.
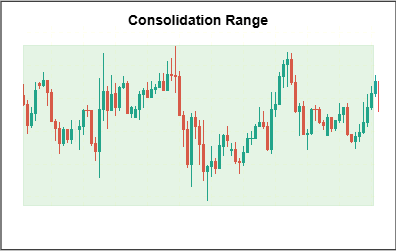
The diagram above illustrates a consolidation range where price oscillates within well-defined boundaries, forming the structural context in which internal imbalance and directional bias may develop before a breakout.
Key Market Behaviors Addressed
- Momentum Accumulation: Gradual pressure build-up inside constrained price boundaries
- Volatility Compression: Reduced amplitude of price swings before expansion
- Directional Resolution: Structural imbalance indicating the most likely breakout direction
Multi-Layer Decision Logic
Geometric Asymmetry (GA) describes an imbalance in the proportional behavior of price movement within a consolidation range. Instead of focusing on boundary breaks alone, GA evaluates how price travels inside the range by comparing the relative length, slope, and duration of successive swing legs.
When one internal leg becomes disproportionately dominant, it signals uneven directional pressure forming beneath the surface of consolidation. GA therefore reflects pre-breakout bias, not trend confirmation, and is evaluated only after a valid range and objective swing structure have been established. The following diagram illustrates how the EA evaluates within-range structure and geometric imbalance within a qualified consolidation range before monitoring for breakout confirmation.
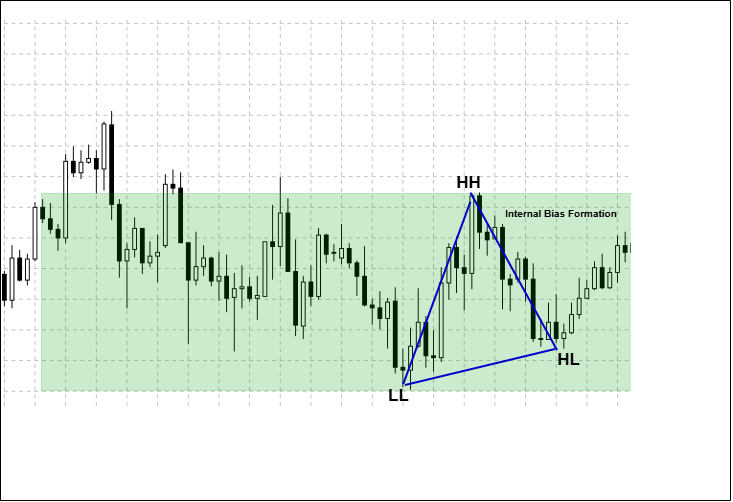
Swing points (HH, HL, LL) are derived from Bill Williams fractal detection and are used as inputs for geometric analysis. A detailed discussion of fractal theory and implementation is covered in an earlier article in this series and will not be repeated in this section.
- Phase 1: Structural Foundation (Fractal Framework)
If three consecutive alternating fractals are identified, the structure is considered valid. In the absence of this condition, the system disregards the sequence and continues monitoring for new fractal formations.
This phase establishes the structural baseline of the strategy. By requiring alternating swing points (high–low–high or low–high–low), the system isolates meaningful reversals while filtering out minor fluctuations. This ensures that subsequent analysis is anchored to significant price behavior rather than short-term noise.
- Phase 2: Range Qualification (Consolidation Validation)
This stage confirms that the identified structure represents genuine consolidation rather than incidental congestion. ATR-based normalization allows the strategy to remain adaptive across changing volatility conditions while enforcing consistent standards. Structures that are too wide, too brief, or no longer respected by price are excluded.
- Phase 3: Geometric Analysis (Directional Bias Detection)
This phase introduces the strategy’s defining edge: identifying directional dominance before the breakout occurs.
Distance Evaluation:
Slope Evaluation:
If the slope of the final swing leg exceeds that of the previous leg by the defined slope ratio, it contributes one vote toward directional bias.
Time Compression Evaluation:
If the final swing leg completes in less time than the preceding leg, within the defined time compression threshold, it contributes one vote toward directional bias.
Confirmation Rule:
Using multiple proportional measures prevents reliance on any single factor. Bias is confirmed only when several independent characteristics align.
- Phase 4: Pattern Locking (Setup Confirmation)
Once geometric conditions are satisfied, the structure transitions into a locked monitoring state.
Lock Criteria
- Confirmed directional bias
- Final swing terminates near the relevant boundary
- Swing magnitude remains proportional to the range
- No conflicting active setups
Locked Pattern Properties
- Direction: Bullish for upward dominance, bearish for downward dominance
- Reference Levels: Fixed range high and low
- Monitoring Window: Limited by InpMaxLockBars
- State: Actively observed for breakout confirmation
Locking the structure prevents repainting and preserves analytical integrity.
- Phase 5: Breakout Detection (Signal Generation)
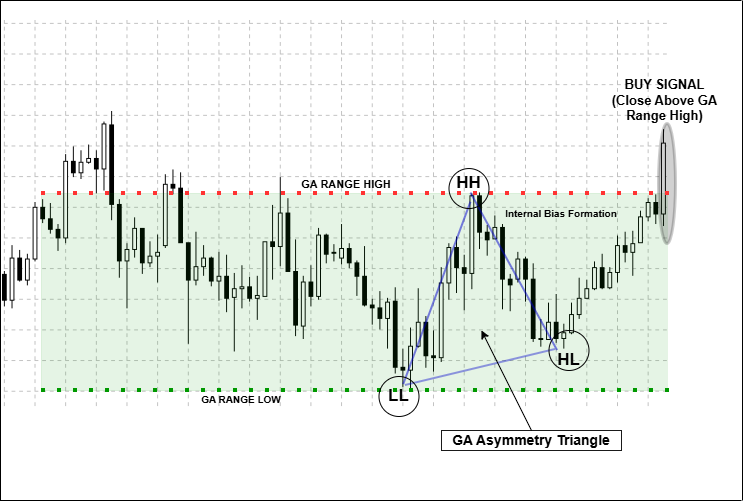
The EA issues a BUY signal only after a valid GA range is locked, internal geometric asymmetry confirms bullish bias, and price closes above the GA Range High. A SELL signal follows the same logic and is generated when price closes below the GA Range Low after confirmed bearish internal bias.
Execution Logic
- Bullish Setup
A BUY signal is generated when price closes decisively above the established range high, adjusted by the breakout buffer.
- Bearish Setup
A SELL signal is generated when price closes decisively below the established range low, adjusted by the breakout buffer.
The breakout buffer (InpBreakBufferPts) filters shallow violations while allowing timely participation in genuine expansions. Signals are generated only on candle close, reinforcing consistency and reducing false triggers.
Risk Control and Signal Discipline
Selectivity is a core design principle. The strategy avoids forcing trades by requiring agreement between structure, volatility, and geometry. Minimum spacing between signals prevents repeated triggers in the same area, particularly during choppy conditions. This encourages patience and focuses attention on higher-quality opportunities.
Context-Aware Interpretation
Signals represent confirmation, not prediction. They are most effective when evaluated alongside broader context, such as higher-timeframe structure, session dynamics, or key reference levels. The system functions as a decision-support framework, leaving execution and risk management firmly in the trader’s control.
Adaptability Across Markets and Timeframes
Because the logic is based on proportional relationships rather than fixed values, the strategy adapts well across instruments and timeframes. Adjustable parameters allow refinement without altering the underlying methodology. This balance between consistency and flexibility ensures durability across varying market environments. By anchoring every signal in consolidation quality and directional imbalance, the Geometric Asymmetry Breakout strategy provides a disciplined framework for identifying high-probability transitions from balance to expansion.
Taken together, these components allow the strategy to evaluate breakout conditions from structural cause to directional effect.
MQL5 Implementation and Code Structure
This section provides a comprehensive overview of how the geometric asymmetry breakout strategy is implemented in MQL5. The codebase emphasizes a modular architecture that prioritizes clarity, performance efficiency, and extensive customization options. Each component addresses a specific aspect of the system, resulting in a well-organized framework that is straightforward to navigate, troubleshoot, and extend. The design facilitates ongoing refinement and adaptation, making it suitable for traders with diverse styles and preferences.
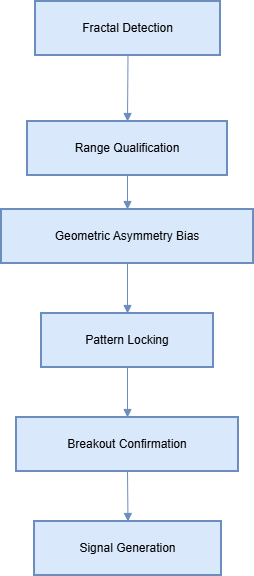
Architectural Overview
At the core of this implementation is a modular design that separates different functional responsibilities into independent segments. This separation ensures that each module can be developed, tested, and maintained separately, which enhances overall system robustness. The key modules include fractal detection, consolidation assessment, asymmetry validation, entry signaling, and pattern management. Such a disciplined division of responsibilities makes the code more manageable, especially when refining or expanding the system in response to evolving market conditions.
The foundation of the system comprises user-configurable inputs, which are critical for flexibility. These parameters enable traders to adapt the strategy to specific assets, timeframes, and individual risk tolerances. For instance, InpMaxScanBars limits the number of historical bars reviewed, optimizing computational speed. Other parameters, such as InpRangeATRMax and InpRangeATRMaxSoft, filter potential zones based on size, ensuring only significant consolidations are considered. The asymmetry validation parameters—InpLenRatioMin for the distance edge, InpSlopeRatioMin for the steepness of move, and InpTimeCompressionMax for the move’s speed—are essential for detecting genuine momentum surges.
//====================== INPUTS =====================================
input int      InpMaxScanBars              = 900;
input int      InpATRPeriod                = 14;
input double   InpRangeATRMax              = 2.00;
input int      InpRangeMinBarsHard         = 8;
input bool     InpEnableSoftRangeBars      = true;
input int      InpRangeMinBarsSoft         = 4;
input double   InpRangeATRMaxSoft          = 1.60;
input int      InpRangeTestLookback        = 50;
input double   InpRangeSideZonePct         = 0.35;

input double   InpLenRatioMin              = 1.35;
input double   InpSlopeRatioMin            = 1.15;
input double   InpTimeCompressionMax       = 0.95;
input int      InpMinGeometryVotes         = 2;

input double   InpMaxLegVsRange            = 1.50;
input int      InpMaxLegBars               = 50;
input double   InpLegEndNearBoundaryPct    = 0.50;

input int      InpBreakLookbackBars        = 150;
input double   InpBreakBufferPts           = 5.0;
input int      InpMaxLockBars              = 30;

input int      InpArrowOffsetPoints        = 15;
input int      InpArrowLabelOffset         = 30;

input int      InpMinBarsBetweenSignals    = 5;

input bool     InpShowSwings               = true;
input bool     InpShowLegs                 = true;
input bool     InpShowTriangle             = true;
input bool     InpShowLabels               = true;
input bool     InpShowRangeLines           = true;
input bool     InpShowCandidateRangeRect   = true;
input bool     InpShowLockedRangeRects     = true;
input bool     InpShowArrows               = true;
input bool     InpShowDebug                = true;

// Arrow code and style
input int      InpArrowUpCode              = 233;
input int      InpArrowDownCode            = 234;
input int      InpArrowSize                = 3;
input color    InpArrowColorUp             = clrLime;
input color    InpArrowColorDown           = clrRed;
input bool     InpShowArrowLabels          = true;
input int      InpArrowLabelFontSize       = 9;
input string   InpArrowLabelFont           = "Arial";

// Alert settings
input bool     InpEnableAlerts             = true;
input bool     InpAlertOnPatternLock       = true;
input bool     InpAlertOnBreakout          = true;
input string   InpAlertSoundPattern        = "alert.wav";
input string   InpAlertSoundBreakout       = "alert2.wav";
input bool     InpAlertPopup               = true;
input bool     InpAlertNotification        = true;
input bool     InpAlertEmail               = false;
Additional options include entry buffers (InpBreakBufferPts) to prevent false triggers caused by minor wicks, maximum lock durations (InpMaxLockBars) to avoid multiple triggers on the same pattern, and minimum bars between signals (InpMinBarsBetweenSignals) to prevent overtrading. Visual toggles for displaying swings, legs, triangles, ranges, labels, and arrows allow traders to customize the visual presentation of the signals. Alert modes can be configured to include sounds, popups, push notifications, and emails, ensuring traders stay informed regardless of their environment.
Pattern Detection: Identifying Turning Points
The process begins with the reliable detection of swing extremes, which form the basis for potential zones. The functions IsFractalHigh() and IsFractalLow() implement Bill Williams’ strict five-bar rule: a high (or low) qualifies only if it exceeds (or is below) the highs (or lows) of its two neighboring bars. This filter discards insignificant fluctuations, focusing only on structural reversals with market significance. By strictly adhering to this rule, the system avoids false signals driven by market noise.
// Check if the bar at index i is a fractal high based on Bill Williams' five-bar rule
bool IsFractalHigh(int i)
{
   if(i<3 || i+2>=BarsTotal()) return false;
   double h = iHigh(_Symbol, _Period, i);
   return h > iHigh(_Symbol, _Period, i-1) &&
          h > iHigh(_Symbol, _Period, i+1) &&
          h > iHigh(_Symbol, _Period, i-2) &&
          h > iHigh(_Symbol, _Period, i+2);
}

// Check if the bar at index i is a fractal low
bool IsFractalLow(int i)
{
   if(i<3 || i+2>=BarsTotal()) return false;
   double l = iLow(_Symbol, _Period, i);
   return l < iLow(_Symbol, _Period, i-1) &&
          l < iLow(_Symbol, _Period, i+1) &&
          l < iLow(_Symbol, _Period, i-2) &&
          l < iLow(_Symbol, _Period, i+2);
}
Building on this, GetLast3AlternatingFractals() efficiently searches recent data for the latest sequence of three opposing fractals. It prioritizes the most prominent deviations—those with the most considerable difference from surrounding bars—to refine the extremes dynamically. This process produces a noise-resistant foundation for subsequent analysis, ensuring that the zones identified are based on meaningful market swings rather than minor fluctuations.
// Retrieve the most recent sequence of three opposing fractals for pattern detection
bool GetLast3AlternatingFractals(
   int &p0, double &pr0, bool &h0,
   int &p1, double &pr1, bool &h1,
   int &p2, double &pr2, bool &h2)
{
   int n=0, idx[3];
   double pr[3];
   bool hi[3];
   int maxBars = MathMin(InpMaxScanBars, BarsTotal() - 3);

   for(int i=3; i<maxBars; i++)
   {
      double price;
      bool isH;
      if(!GetFractalPoint(i, price, isH))
      {
         // Additional check for prominent fractals
         if(i >= 4 && i+3 < BarsTotal())
         {
            double hh = iHigh(_Symbol, _Period, i);
            double ll = iLow(_Symbol, _Period, i);
            if(hh >= iHigh(_Symbol, _Period, i-1) &&
               hh >= iHigh(_Symbol, _Period, i+1) &&
               hh >= iHigh(_Symbol, _Period, i-2) &&
               hh >= iHigh(_Symbol, _Period, i+2))
            {
               price = hh;
               isH = true;
            }
            else if(ll <= iLow(_Symbol, _Period, i-1) &&
                    ll <= iLow(_Symbol, _Period, i+1) &&
                    ll <= iLow(_Symbol, _Period, i-2) &&
                    ll <= iLow(_Symbol, _Period, i+2))
            {
               price = ll;
               isH = false;
            }
            else continue;
         }
         else continue;
      }
      // Store the most recent opposing fractals
      if(n==0)
      {
         idx[0]=i; pr[0]=price; hi[0]=isH; n=1;
      }
      else if(hi[n-1]==isH)
      {
         // Update if current fractal is more extreme
         if(isH && price>pr[n-1])
         {
            idx[n-1]=i; pr[n-1]=price;
         }
         if(!isH && price<pr[n-1])
         {
            idx[n-1]=i; pr[n-1]=price;
         }
      }
      else if(n<3)
      {
         idx[n]=i; pr[n]=price; hi[n]=isH; n++;
      }
      if(n>=3) break;
   }
   if(n<3) return false;

   p0=idx[0]; pr0=pr[0]; h0=hi[0];
   p1=idx[1]; pr1=pr[1]; h1=hi[1];
   p2=idx[2]; pr2=pr[2]; h2=hi[2];
   return true;
}
Defining Consolidation Boundaries
Once the key fractals are identified, the functions CalcRangeHigh() and CalcRangeLow() analyze the bars between them to establish the true upper and lower limits of the potential consolidation zone. These boundaries are critical for defining the zone where a breakout may occur.
// Calculate the highest high between two bars
double CalcRangeHigh(int leftBar, int rightBar)
{
   int from = MathMin(leftBar, rightBar);
   int to   = MathMax(leftBar, rightBar);
   int bars = to - from + 1;
   int idx  = iHighest(_Symbol, _Period, MODE_HIGH, bars, from);
   return (idx >= 0) ? iHigh(_Symbol, _Period, idx) : iHigh(_Symbol, _Period, from);
}

// Calculate the lowest low between two bars
double CalcRangeLow(int leftBar, int rightBar)
{
   int from = MathMin(leftBar, rightBar);
   int to   = MathMax(leftBar, rightBar);
   int bars = to - from + 1;
   int idx  = iLowest(_Symbol, _Period, MODE_LOW, bars, from);
   return (idx >= 0) ? iLow(_Symbol, _Period, idx) : iLow(_Symbol, _Period, from);
}
However, raw boundaries require validation. The function RangeQualifies() enforces strict standards: the zone must persist for a minimum duration (both hard and soft thresholds), its height must be proportional to ATR, and recent price touches at the edges are required for validation. Zones that are too shallow, too short-lived, or neglected are discarded. This filtration sharpens focus on environments with genuine breakout potential, reducing the likelihood of false triggers caused by minor market noise or insignificant consolidations.
// Check if the range qualifies based on duration, ATR, and proximity
bool RangeQualifies(int p2, int p1, double hi, double lo, string &whyFail, bool &usedSoft)
{
   whyFail="";
   usedSoft=false;
   int barsSpan = MathAbs(p2 - p1);

   if(barsSpan < InpRangeMinBarsSoft)
   {
      whyFail="rangeBars";
      return false;
   }

   double atr;
   if(!GetATR(atr))
   {
      whyFail="atr";
      return false;
   }

   double height = MathAbs(hi - lo);
   double atrCap = InpRangeATRMax;
   if(barsSpan < InpRangeMinBarsHard)
   {
      if(!InpEnableSoftRangeBars)
      {
         whyFail="rangeBars";
         return false;
      }
      usedSoft=true;
      atrCap = InpRangeATRMaxSoft;
   }

   if(height > atr * atrCap)
   {
      whyFail= usedSoft ? "rangeATR_soft" : "rangeATR";
      return false;
   }

   // Check proximity to recent high/low
   double zonePct = MathMax(0.08, MathMin(InpRangeSideZonePct, 0.70));
   double zone = height * zonePct;
   bool nearHigh=false, nearLow=false;
   int look = MathMin(InpRangeTestLookback, BarsTotal() - 5);
   for(int i=1; i<=look; i++)
   {
      double h = iHigh(_Symbol, _Period, i);
      double l = iLow(_Symbol, _Period, i);
      if(h >= hi - zone) nearHigh=true;
      if(l <= lo + zone) nearLow=true;
      if(nearHigh || nearLow) break;
   }
   if(!nearHigh && !nearLow)
   {
      whyFail="sideZones";
      return false;
   }
   return true;
}
Detecting Momentum Imbalance: Geometric Validation
Zones passing initial filters proceed to geometric validation. The function GeometryAsymmetryInsideRangeOK() performs a detailed analysis of recent move legs within the zone. It calculates ratios such as LengthRatio for distance dominance, SlopeRatio for steepness, and TimeRatio for move speed. These ratios help identify whether the last move is sharply accelerated, a key sign of momentum buildup.
// Validate the shape and acceleration of the move within the zone
bool GeometryAsymmetryInsideRangeOK(
   int p0,double pr0,int p1,double pr1,int p2,double pr2,
   double rangeHigh,double rangeLow,
   double &lenRatio,double &slopeRatio,double &timeRatio,int &votes,int &dir,
   string &whyFail)
{
   whyFail="";
   votes=0;

   double lenPrev = MathAbs(pr1 - pr2);
   double lenLast = MathAbs(pr0 - pr1);
   dir = (pr0 > pr1 ? +1 : -1);

   double tol = (rangeHigh - rangeLow) * 0.10;
   if(pr0 > rangeHigh+tol || pr0 < rangeLow-tol ||
      pr1 > rangeHigh+tol || pr1 < rangeLow-tol)
   {
      if(pr0 > rangeHigh+tol && pr1 > rangeHigh+tol)
      {
         whyFail="notInsideRange";
         return false;
      }
      if(pr0 < rangeLow-tol && pr1 < rangeLow-tol)
      {
         whyFail="notInsideRange";
         return false;
      }
   }

   datetime t0 = iTime(_Symbol, _Period, p0);
   datetime t1 = iTime(_Symbol, _Period, p1);
   datetime t2 = iTime(_Symbol, _Period, p2);

   long dtPrevL = (long)t1 - (long)t2;
   long dtLastL = (long)t0 - (long)t1;

   double dtPrev = MathAbs((double)dtPrevL);
   double dtLast = MathAbs((double)dtLastL);

   if(dtPrev <= 0 || dtLast <= 0)
   {
      whyFail="dt";
      return false;
   }

   lenRatio = lenLast / MathMax(1e-10, lenPrev);
   slopeRatio = (lenLast / dtLast) / MathMax(1e-10, (lenPrev / dtPrev));
   timeRatio = dtLast / MathMax(1e-10, dtPrev);

   // Voting on pattern strength
   if(lenRatio >= InpLenRatioMin) votes++;
   if(slopeRatio >= InpSlopeRatioMin) votes++;
   if(timeRatio <= InpTimeCompressionMax) votes++;

   if(votes < InpMinGeometryVotes)
   {
      if(lenRatio >= InpLenRatioMin * 1.2 || slopeRatio >= InpSlopeRatioMin * 1.2)
         votes = InpMinGeometryVotes;
      else
      {
         whyFail="votes";
         return false;
      }
   }
   return true;
}
A voting system, InpMinGeometryVotes, requires multiple criteria to be satisfied before confirming the pattern. Additional safeguards, such as endpoint proximity and proportional scaling between legs, are employed to exclude oversized or detached moves that do not reflect genuine accumulation of momentum. This meticulous validation distinguishes meaningful momentum from mere symmetrical or indecisive moves that often lead to false breakouts. It significantly increases the confidence level of the signals produced.
Monitoring Breakouts and Entry Signaling
// Check recent candles for breakouts and trigger signals
void CheckAllBreakouts()
{
   double buffer = InpBreakBufferPts * _Point;
   for(int i=0; i<ArraySize(g_lockedPatterns); i++)
   {
      if(!g_lockedPatterns[i].active) continue;

      for(int bar=1; bar<=InpBreakLookbackBars; bar++)
      {
         datetime barTime = iTime(_Symbol, _Period, bar);
         if(barTime <= g_lockedPatterns[i].startTime) continue;

         double close = iClose(_Symbol, _Period, bar);
         double high = iHigh(_Symbol, _Period, bar);
         double low = iLow(_Symbol, _Period, bar);

         if(g_lockedPatterns[i].dir > 0)
         {
            if(close > g_lockedPatterns[i].high + buffer || high > g_lockedPatterns[i].high + buffer)
            {
               double breakoutPrice = MathMax(g_lockedPatterns[i].high + buffer, MathMin(close, high));
               string uid = "BUY_" + g_lockedPatterns[i].key + "_" + Ts(barTime);
               CreatePermanentArrow(uid, barTime, breakoutPrice, true);
               if(InpShowDebug) Print("Buy breakout at ", DoubleToString(breakoutPrice,_Digits));
               RemoveLockedPattern(i);
               g_lastSignalBar = barTime;
               break;
            }
         }
         else if(g_lockedPatterns[i].dir < 0)
         {
            if(close < g_lockedPatterns[i].low - buffer || low < g_lockedPatterns[i].low - buffer)
            {
               double breakoutPrice = MathMin(g_lockedPatterns[i].low - buffer, MathMax(close, low));
               string uid = "SELL_" + g_lockedPatterns[i].key + "_" + Ts(barTime);
               CreatePermanentArrow(uid, barTime, breakoutPrice, false);
               if(InpShowDebug) Print("Sell breakout at ", DoubleToString(breakoutPrice,_Digits));
               RemoveLockedPattern(i);
               g_lastSignalBar = barTime;
               break;
            }
         }
      }
   }
}
When a pattern demonstrates strong asymmetry, the system transitions into breakout monitoring. The CheckAllBreakouts() function vigilantly scans recent candles for decisive breaches of the established range boundaries, incorporating an entry buffer (InpBreakBufferPts) to prevent reactions to minor spikes. When a confirmed breakout occurs, CreatePermanentArrow() places durable visual markers—arrows, zones, labels—on the chart, providing clear visual confirmation.
// Create an arrow marker on the chart for breakouts
void CreatePermanentArrow(const string uid, const datetime t, const double price, const bool bullish)
{
   if(!InpShowArrows) return;
   string name = PFX_AR + "PERM_" + uid + "_" + Ts(t);
   if(ObjectFind(0, name) >=0) return; // Already exists

   int anchor = bullish ? ANCHOR_BOTTOM : ANCHOR_TOP;
   double arrowPrice = bullish ? (price - InpArrowOffsetPoints * _Point) : (price + InpArrowOffsetPoints * _Point);
   if(!ObjectCreate(0, name, OBJ_ARROW, 0, t, arrowPrice))
   {
      if(InpShowDebug) Print("Failed to create arrow: ", GetLastError());
      return;
   }
   ObjectSetInteger(0, name, OBJPROP_ARROWCODE, bullish ? InpArrowUpCode : InpArrowDownCode);
   ObjectSetInteger(0, name, OBJPROP_COLOR, bullish ? InpArrowColorUp : InpArrowColorDown);
   ObjectSetInteger(0, name, OBJPROP_WIDTH, InpArrowSize);
   ObjectSetInteger(0, name, OBJPROP_ANCHOR, anchor);
   // Add label if enabled
   if(InpShowArrowLabels)
   {
      string lbl = name + "_LBL";
      double lblPrice = arrowPrice + (InpArrowLabelOffset * _Point * (bullish ? 1 : -1));
      if(ObjectCreate(0, lbl, OBJ_TEXT, 0, t, lblPrice))
      {
         ObjectSetString(0, lbl, OBJPROP_TEXT, bullish ? "BUY" : "SELL");
         ObjectSetInteger(0, lbl, OBJPROP_COLOR, bullish ? InpArrowColorUp : InpArrowColorDown);
         ObjectSetInteger(0, lbl, OBJPROP_FONTSIZE, InpArrowLabelFontSize);
         ObjectSetString(0, lbl, OBJPROP_FONT, InpArrowLabelFont);
         ObjectSetInteger(0, lbl, OBJPROP_ANCHOR, ANCHOR_LEFT_UPPER);
      }
   }
}
Simultaneously, PlayAlert() manages multi-channel notifications, including sounds, popups, push notifications, and emails, ensuring that traders are promptly informed of high-confidence breakouts regardless of their device or environment. Each setup is locked for a short period (InpMaxLockBars) to prevent multiple signals on the same pattern, and patterns are automatically retired when expired or once a breakout occurs. This process maintains a clutter-free workspace and emphasizes current, high-probability signals.
Pattern Lifecycle Management and Noise Control
// Check if enough bars have passed since last signal to avoid overtrading
bool CooldownOK()
{
   if(g_lastSignalBar == 0)
      return true;
   int barsSince = iBarShift(_Symbol, _Period, g_lastSignalBar, true);
   return (barsSince >= InpMinBarsBetweenSignals);
}
To further prevent false triggers and overtrading, the system enforces noise suppression mechanisms. The CooldownOK() function ensures a minimum number of bars elapse between signals, reducing the impact of market turbulence. The UpdateLockedPatterns() routine advances timers for active patterns, automatically expiring those that have reached their maximum age or been fulfilled.
// Update active pattern timers and expire patterns that have reached max lock bars
void UpdateLockedPatterns()
{
   datetime currentTime = iTime(_Symbol, _Period, 0);
   for(int i=0; i<ArraySize(g_lockedPatterns); i++)
   {
      if(!g_lockedPatterns[i].active)
         continue;

      g_lockedPatterns[i].lockBars++;

      // optionally, update visual rectangle for active patterns
      if(g_lockedPatterns[i].rectName != "" && InpShowLockedRangeRects)
         UpdateLockedRangeRectangle(g_lockedPatterns[i].rectName, currentTime,
                                    g_lockedPatterns[i].high, g_lockedPatterns[i].low);

      // Expire patterns that have reached max lock bars
      if(g_lockedPatterns[i].lockBars > InpMaxLockBars)
      {
         if(InpShowDebug)
            Print("Pattern expired after ", g_lockedPatterns[i].lockBars, " bars");
         RemoveLockedPattern(i);
      }
   }
}
These controls foster a disciplined trading environment, reducing the incidence of false alarms and ensuring that signals are generated only when the market structure indicates a genuine opportunity. This disciplined approach helps traders avoid reacting to minor market fluctuations or choppy conditions, focusing instead on high-probability setups.
Core Execution: OnTick()
All analysis, decision-making, and signaling are orchestrated within the OnTick() function. It triggers only at the close of each new bar, which optimizes resource usage and ensures stability. Inside OnTick(), the routine sequentially updates existing pattern states, searches for new fractals, evaluates potential zones, performs geometric validation, monitors for breakouts, and updates visual overlays.
// Main routine called on each new tick; runs at bar close
void OnTick()
{
   // Only proceed at bar close
   datetime closed = iTime(_Symbol, _Period, 1);
   if(closed == 0 || closed == g_lastClosedBar)
      return;
   g_lastClosedBar = closed;

   // Update pattern timers and expire old patterns
   UpdateLockedPatterns();

   // Check for breakout signals
   CheckAllBreakouts();

   // Limit number of active patterns
   if(GetActivePatternCount() >= g_maxSimultaneousLocks)
   {
      if(InpShowDebug)
         Print("Max active patterns reached");
      return;
   }

   // Enforce cooldown to prevent overtrading
   if(!CooldownOK())
   {
      if(InpShowDebug)
      {
         int sinceBars = iBarShift(_Symbol, _Period, g_lastSignalBar, true);
         Print("Cooldown active: ", sinceBars, "/", InpMinBarsBetweenSignals, " bars since last signal");
      }
      return;
   }

   // Proceed with fractal detection and pattern analysis
   // (Insert fractal detection, range evaluation, geometric validation, etc.)
   // ...
}
This structured pipeline guarantees reliable, real-time operation even during volatile or fast-moving markets. Visual overlays—such as colored dots marking fractals, trendlines illustrating legs, zones highlighting consolidations, and arrows indicating breakouts—are dynamically created or refreshed based on current market data. This visual feedback provides traders with an immediate, intuitive understanding of the market structure and potential trading signals.
Resource Management and System Stability
Effective resource management is critical for long-term system stability. During OnInit(), the ATR indicator handle is acquired and cached for reuse. During OnDeinit(), it is released to prevent memory leaks. Graphical objects, such as trendlines, zones, and arrows, are named systematically with consistent prefixes and unique identifiers, simplifying updates and deletions.
// On initialization, acquire indicator handles and prepare environment
int OnInit()
{
   g_atrHandle = iATR(_Symbol, _Period, InpATRPeriod);
   if(g_atrHandle == INVALID_HANDLE)
   {
      Print("Failed to create ATR handle. Error=", GetLastError());
      return INIT_FAILED;
   }

   // Resize pattern lock array for simultaneous patterns
   ArrayResize(g_lockedPatterns, g_maxSimultaneousLocks);
   for(int i=0; i< g_maxSimultaneousLocks; i++)
      g_lockedPatterns[i].active = false;

   // Clean up previous graphical objects
   DeleteByPrefix(PFX_SW);
   DeleteByPrefix(PFX_DOT);
   DeleteByPrefix(PFX_LN);
   DeleteByPrefix(PFX_TX);
   DeleteByPrefix(PFX_TRI);
   ObjectDelete(0, OBJ_CAND);

   // Initialize variables
   g_lastClosedBar = 0;
   g_lastSignalBar = 0;
   g_arrowCounter = 0;

   // Print startup info
   Print("System initialized successfully");
   return INIT_SUCCEEDED;
}
Arrays supporting multiple patterns are resized dynamically, allowing the system to handle complex scenarios involving overlapping setups or multiple instruments without performance degradation. Proper cleanup routines and disciplined memory handling ensure the system remains stable over extended periods, across different symbols, and during varying market conditions.
// On deinitialization, release indicator handles and clean up objects
void OnDeinit(const int reason)
{
   if(g_atrHandle != INVALID_HANDLE)
      IndicatorRelease(g_atrHandle);

   // Remove graphical objects
   DeleteByPrefix(PFX_SW);
   DeleteByPrefix(PFX_DOT);
   DeleteByPrefix(PFX_LN);
   DeleteByPrefix(PFX_TX);
   DeleteByPrefix(PFX_TRI);
   ObjectDelete(0, OBJ_CAND);

   // Output stats
   Print("Deinitialization complete");
   Print("Total patterns processed: ", g_totalPatterns);
   Print("Breakouts: ", g_totalBreakouts, " (Buy: ", g_buyBreakouts, ", Sell: ", g_sellBreakouts, ")");
   Print("Patterns expired: ", g_patternsExpired);
}
Final Remarks
This implementation exemplifies professional-grade engineering in MQL5. By combining fractal detection, strict zone filtering, and detailed geometric validation, it transforms subtle disequilibria into high-confidence, actionable signals. Visual overlays, alert notifications, and pattern lifecycle management create a comprehensive trading environment that balances power with clarity.
The modular architecture invites customization; traders can refine thresholds, add filters, or enhance visual presentation as needed. This flexibility ensures the system remains adaptable to evolving markets and individual trading styles. The Geometric Asymmetry Breakout Strategy is thus a scalable, durable framework, designed to support traders navigating complex, dynamic markets with confidence and precision.
Testing and Outcomes
For any tool to be effective and deliver consistently positive results, thorough testing across different market conditions and timeframes is essential. In this section, I present the results of the tests I conducted and highlight the conditions under which the tool performed most effectively. After extensive testing across multiple currency pairs, a clear performance pattern emerged. The tool turned out to be most effective on major, highly liquid pairs, with the strongest and most consistent results observed on EURUSD on the H1 timeframe.
Below is a diagram from the Strategy Tester showing a test run on EURUSD (H1), which demonstrates where the tool delivered its most positive and practically useful performance.

This does not imply that the tool works only under these specific conditions. The observed performance is strongly influenced by the input parameter thresholds and signal filters applied during testing. Different instruments exhibit different characteristics—some are more volatile, others less so, while some offer deeper liquidity. For this reason, parameter calibration played a key role during testing. Inputs were adjusted to reflect the behavior of each pair and timeframe rather than applied uniformly. When aligned with a market’s volatility, liquidity, and structural tendencies, the tool demonstrated consistent effectiveness across multiple instruments, not only EURUSD on H1.
Another test was conducted on AUDUSD, which also produced positive and consistent results. This test was performed using the Strategy Tester in visual mode, allowing close observation of how the EA identified consolidation ranges, formed internal bias, and generated breakout signals in real time.

As shown in the visualization, the EA correctly detected the GA range, confirmed internal geometric asymmetry, and issued a valid signal only after price closed beyond the locked range boundary. This test further confirms that the tool performs reliably beyond a single instrument, provided that input parameters and filters are properly aligned with the market’s volatility and structure.
Conclusion
This article examined the Geometric Asymmetry (GA) Breakout framework as a structured, rule-based approach to identifying meaningful range-to-trend transitions. By combining fractal-based structure detection, consolidation qualification, geometric imbalance analysis, and strict breakout confirmation, the method focuses on market context and confirmation rather than prediction.
Testing across multiple currency pairs and timeframes showed that performance depends largely on how well input parameters are aligned with each market’s volatility, liquidity, and structural behavior. Results observed on major pairs such as EURUSD (H1) and AUDUSD demonstrate the framework’s ability to capture genuine expansions while avoiding signals driven by noise or short-lived price fluctuations. The strength of the GA approach lies in its discipline. Signals are generated only after a valid consolidation range is established, internal bias is objectively identified through asymmetry, and price closes decisively beyond the locked boundary. This sequential filtering reduces false breakouts and ensures that signals reflect real directional intent.
Geometric Asymmetry is designed as a decision-support and signal-generation framework, not a fully automated trading system. Its modular structure allows users to refine thresholds, adjust filters, and adapt parameters to different instruments without altering the core logic. This flexibility makes the GA framework a practical and durable tool for traders seeking a structured and transparent method of breakout analysis in changing market conditions.
The Geometric Asymmetry strategy, like any analytical tool, should not be applied to live trading without thorough testing. Users are advised to conduct extensive forward testing on demo accounts, tailor parameters to their chosen instruments and timeframes, and apply appropriate risk management at all times. Past performance, including backtest results, does not guarantee future outcomes.
Warning: All rights to these materials are reserved by MetaQuotes Ltd. Copying or reprinting of these materials in whole or in part is prohibited.
This article was written by a user of the site and reflects their personal views. MetaQuotes Ltd is not responsible for the accuracy of the information presented, nor for any consequences resulting from the use of the solutions, strategies or recommendations described.

- Free trading apps
- Over 8,000 signals for copying
- Economic news for exploring financial markets
You agree to website policy and terms of use