
Price Action Analysis Toolkit Development (Part 56): Reading Session Acceptance and Rejection with CPI

Contents
- Introduction
- Previous Article Review
- Strategy Concept
- MQL5 Implementation
- Testing and Outcomes
- Conclusion
Introduction
Trading sessions leave lasting structural footprints. As price develops within a session, its high and low become reference boundaries that future price action must respect. Candles interacting with these prior levels reveal whether the market is accepting new range extremes or rejecting them. I previously introduced the Candle Pressure Index (CPI) to quantify internal buying/selling pressure beyond simple candle color. When price returns to a prior session boundary, the key question is acceptance versus rejection, and CPI helps answer it objectively.
In this article, that same concept is extended into a session-based context. The goal is to use CPI to validate whether candles interacting with established session boundaries carry bullish or bearish pressure. By doing so, session levels are no longer treated as static lines on the chart, but as areas where internal price pressure determines whether the market is accepting higher prices or rejecting them—revealing true acceptance or rejection, offering objective context for discretionary trading decisions.
Previous Article Review
The previous episode introduced the Candle Pressure Index (CPI), which can be defined in simple terms as the internal buying or selling pressure contained within each closed candle. This pressure reflects how price behaved during the formation of the candle, beyond what candle color alone can convey. To properly revisit what was covered in that article, the discussion is organized into two parts. The first part reviews the CPI concept itself, while the second part revisits the outcomes observed after testing the CPI indicator. Both are outlined briefly here before extending the analysis further in this article.
CPI ConceptIf you have ever watched a football match, you will notice that the team that wins is not always the one that played better. A team can dominate possession, create more chances, and apply constant pressure, yet still lose the game. What most people remember is the final score, but the full story of how the match was played often remains hidden. Candlesticks work in the same way. Many people look only at candle color and stop there. CPI acts like the hidden match statistics, revealing the pressure inside the candle that price color alone does not show.
It is calculated from the candle’s high, low, and close, as shown in the formula below.
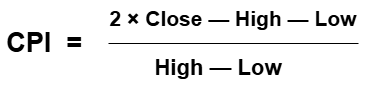
Test Outcomes
After successfully developing the indicator, we tested it and obtained the following results.
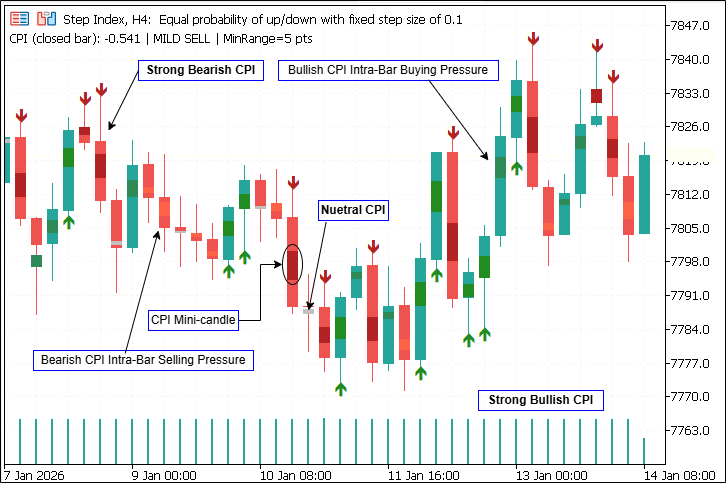
These results clearly illustrate the pressure contained within each candle, with arrow-marked candles highlighting stronger buying or selling dominance through color intensity. The following section introduces an enhanced use of CPI to distinguish breakout and reversal behavior at key market session levels.
Strategy Concept
Session Structure as Market Memory
When a trading session closes, it marks the conclusion of a defined phase of market participation. During that interval, price explored a range, tested liquidity, and ultimately settled at a closing level that reflects where buyers and sellers reached a temporary agreement. The session’s high and low are not arbitrary extremes; they represent the outer bounds of that decision-making process.
Once established, these boundaries remain embedded in the market. When price revisits a previous session’s high or low, it is not interacting with a random level but returning to a zone where imbalance, absorption, and resolution previously occurred. As a result, session highs and lows often serve as durable support and resistance levels—reference points where the market re-evaluates prior consensus.
Acceptance and Rejection at Session Levels
When price returns to a prior session boundary, the market confronts two potential outcomes: acceptance or rejection. Acceptance occurs when price moves beyond the level and sustains above or below it, indicating that participants are willing to transact outside the previous session’s range. Rejection occurs when price tests the level but fails to maintain pressure beyond it, rotating back into the earlier range.
Consider a prior session high at 1.1000. When price returns:
- Acceptance: sustained close above with strong positive CPI.
- Rejection: probe above but close back inside with negative CPI flip.
This is determined by candle close position within its range, not just wicks or color. The diagram below highlights the decision process that occurs when price reaches a previous session boundary, where acceptance or rejection is determined by behavior at the level rather than by the initial probe.
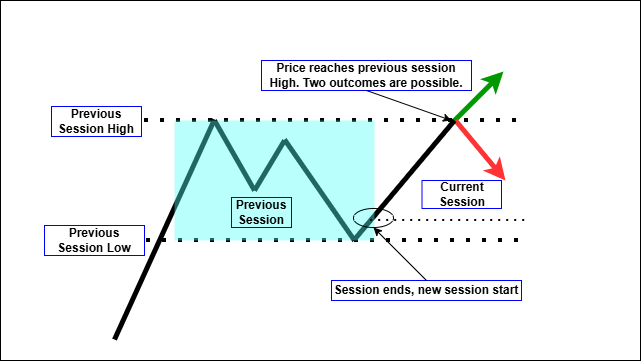
These outcomes are not defined by a single tick or wick, but by how price behaves into the candle close at the level. The close signifies commitment. A move beyond a session level that fails to maintain pressure into the close lacks confirmation, while a close that holds beyond the level reflects sustained participation.
Limitations of Candle Color at Session Boundaries
At key session levels, candle color alone often yields incomplete or misleading signals. A candle may close above its open and appear bullish, yet finish weakly within its range after briefly moving higher. In such instances, candle color implies strength, while internal behavior suggests hesitation or absorption.
Conversely, a candle that closes with a bearish color may finish near its high, indicating that selling pressure was absorbed rather than dominant. Such contradictions are especially common near session highs and lows, where liquidity is concentrated and opposing orders interact. Sole reliance on candle color at these points can lead to misinterpretation of market intent.
CPI as a Session Validation Layer
The Candle Pressure Index (CPI) addresses this limitation by assessing where price closes within the candle’s range, rather than relying on color alone. By measuring internal buying and selling pressure, CPI indicates whether control resided with buyers, sellers, or neither.
The session high or low provides structural context; CPI evaluates the quality of price interaction with that structure. A break beyond a session high accompanied by strong positive CPI suggests acceptance—buying pressure sustained into the close. In contrast, a break with weak or negative CPI implies insufficient commitment and a greater likelihood of rejection. The same logic applies to session lows.
Interpreting Pressure
This framework observes how price behaves at session levels and assesses the response through internal pressure metrics. This keeps the analysis reactive and grounded in observable behavior, avoiding speculative assumptions.
CPI classifies the quality of present interaction. By doing so, it helps differentiate between meaningful acceptance and superficial breaks, and between genuine rejection and temporary hesitation.
Scope and Intent of the Approach
This is a framework for interpreting session levels. It combines session structure with CPI to evaluate whether the price is accepting a level or rejecting it, based on how candles close within their range. The next section shows how this logic is implemented in MQL5 using closed-candle evaluation and session-isolated calculations.
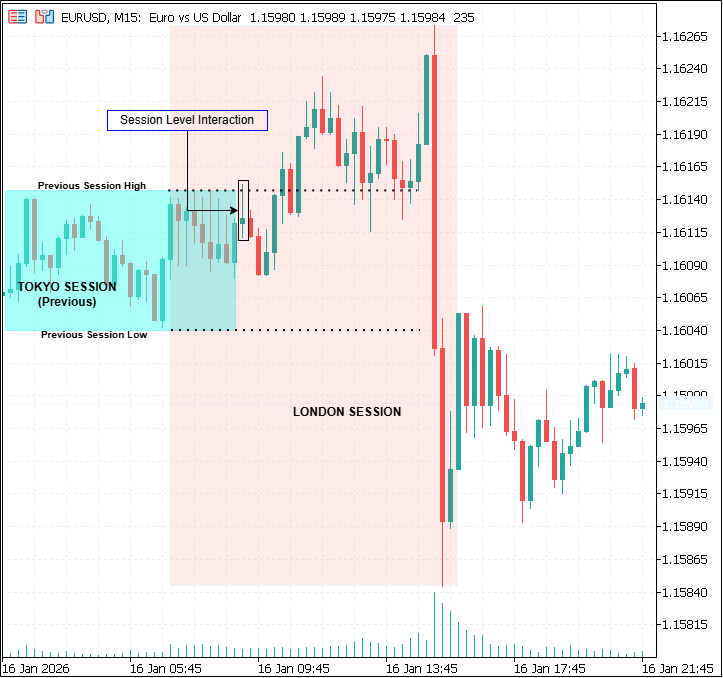
This example reinforces how session structure provides context, while candle behavior at the boundary determines whether the level is accepted or rejected.
MQL5 Implementation
The MQL5 implementation translates the Candle Pressure Index (CPI) session concept into a closed-candle analysis tool. It draws Tokyo, London, and New York session rectangles and classifies breakout acceptance and rejection at session boundaries using CPI data. The objective is consistency, ensuring the same logic is applied in both historical reconstruction and live operation. All classifications are performed exclusively on fully closed candles.
Internally, the implementation is structured around three core tasks: constructing session windows in broker (server) time, sampling session ranges from closed candles, and evaluating CPI-confirmed interactions using a two-candle model at session boundaries.
Session Configuration and State Management
Sessions are configured via HH:MM-formatted input strings in broker (server) time. This approach ensures portability across brokers without relying on local machine time. Each session is represented by a SessionState structure holding the session name and configured time window, computed startDT and endDT timestamps anchored to the correct trading day, a running high and low for drawing the session rectangle, and two control flags (doneHighSide, doneLowSide) to suppress repeated classifications at the same boundary. Three instances (g_sess[3]) are created and updated uniformly so Tokyo, London, and New York behave identically under shared logic.
struct SessionState
{
   string   name;
   string   startHHMM;
   string   endHHMM;
   color    rectColor;

   datetime anchorMidnight;
   datetime startDT;
   datetime endDT;
   bool     active;

   double   high;
   double   low;

   bool     doneHighSide;
   bool     doneLowSide;
};

SessionState g_sess[3];
Session Boundaries and Midnight Handling
Session bounds are constructed by the BuildSessionBounds() function. This function parses the HH:MM inputs and computes startDT and endDT values anchored to anchorMidnight. Sessions that cross midnight (where the start time is later than the end time) are handled explicitly so the session window remains correct even when it spans two calendar dates.
void BuildSessionBounds(const string startHHMM, const string endHHMM,
                        datetime now, datetime &sessStart,
                        datetime &sessEnd, datetime &anchorMidnight)
{
   // Parses HH:MM, anchors to midnight,
   // handles sessions that cross midnight
}
The function also selects the most relevant session occurrence relative to the current time, ensuring that session alignment respects the intended trading day rather than the calendar day alone.
Session Membership Logic (Datetime Filtering)
The implementation avoids mapping session windows to bar-index ranges. Instead, session bounds are stored as datetime values (startDT, endDT), and candle inclusion is determined by comparing each bar’s opening time (iTime) to the session window.
datetime t1 = iTime(_Symbol, _Period, 1);
if(t1 >= s.startDT && t1 <= s.endDT)
{
   double h1 = iHigh(_Symbol, _Period, 1);
   double l1 = iLow(_Symbol, _Period, 1);

   if(h1 > s.high) s.high = h1;
   if(l1 < s.low)  s.low  = l1;
}
In live operation, UpdateOneSessionLive() checks the most recently closed candle (bar[1]) and updates the session range only if its timestamp lies within [startDT, endDT]. In historical reconstruction, UpdateOneSessionAtShift() applies the same logic using an arbitrary bar shift. Because every candle has an absolute timestamp, this datetime-based approach behaves consistently across all timeframes.
Visual vs Analytical Session Ranges
The implementation maintains two distinct types of session ranges.
ObjectCreate(0, name, OBJ_RECTANGLE, 0,
             s.startDT, s.high,
             s.endDT,   s.low);

ObjectSetInteger(0, name, OBJPROP_FILL, true);
ObjectSetInteger(0, name, OBJPROP_COLOR,
                 ColorToARGB(s.rectColor, InpRectTransparency));
- The rectangle range (s.high, s.low) is updated incrementally as candles are processed and is used solely for drawing visual session rectangles (OBJ_RECTANGLE). These rectangles persist on the chart, with names incorporating the session’s anchorMidnight timestamp. However, no separate persistent data structure of completed session ranges is maintained.
- The analytical range is computed on demand via SessionRangeFromShift(). This function scans historical candles whose timestamps fall within the session window, starting from a specified startShift to exclude newer candles. This separation ensures that the evaluation candle does not influence the session level it is being compared against.
CPI Computation and Noise Gate
CPI is computed using CalcCPI(high, low, close) and normalized to a range between −1 and +1. A noise gate (InpMinRangePoints) filters out candles whose high–low range is below a specified minimum, reducing false classifications from low-activity bars.
bool SessionRangeFromShift(const SessionState &s,
                           int startShift,
                           double &outHigh,
                           double &outLow)
{
   for(int sh = startShift; sh < Bars(_Symbol,_Period); sh++)
   {
      datetime tt = iTime(_Symbol,_Period, sh);
      if(tt < s.startDT) break;
      if(tt > s.endDT)  continue;

      outHigh = MathMax(outHigh, iHigh(_Symbol,_Period, sh));
      outLow  = MathMin(outLow,  iLow(_Symbol,_Period, sh));
   }
   return true;
}
CPI is applied exclusively to closed candles, specifically the two bars involved in evaluation: sh1 is the newer confirmation candle, and sh2 = sh1 + 1 is the older context candle that establishes break conditions or provides the prior CPI state.
Signal Evaluation Model (Two-Candle Core)
All classifications are executed within EvaluateSignalsCore() using a consistent two-candle model. The older candle (sh2) establishes breakout validation or supplies the previous CPI context for reversals, while the newer candle (sh1) confirms the breakout via retest behavior or identifies rejection via close-back-inside behavior.
int sh1 = 1;        // confirmation candle
int sh2 = sh1 + 1; // context / break candle

double cpi1 = CalcCPI(h1, l1, c1);
double cpi2 = CalcCPI(h2, l2, c2);
This model is used in both live operation (with sh1 = bar[1]) and historical reconstruction (with sh1 set to an arbitrary historical shift), ensuring identical logic in both modes.
Breakout Acceptance Criteria
Breakout acceptance is confirmed using a two-candle sequence. The break candle (sh2) must close beyond the relevant session boundary with CPI exceeding a defined strength threshold in the direction of the breakout. The confirmation candle (sh1) must then retest the boundary within a tolerance band and close beyond it again.
double hiBrk, loBrk;
SessionRangeFromShift(s, sh1 + 2, hiBrk, loBrk);

bool bullBreak =
   (c2 > hiBrk + tol) &&
   (cpi2 >= InpStrongThreshold) &&
   RetestTouchesFromAbove(l1, hiBrk, touchTol) &&
   (c1 > hiBrk);
The breakout reference level (hiBrk or loBrk) is computed via SessionRangeFromShift() using startShift = sh1 + 2. This excludes both the break and confirmation candles from the range used to define the level, ensuring the breakout sequence does not influence the boundary it is attempting to break.
Rejection Criteria and Threshold Logic
Rejection is classified when the confirmation candle (sh1) trades beyond a session boundary but closes back inside the session range. At the session high, the candle must move above the high and close below it (bearish rejection). At the session low, the candle must move below the low and close above it (bullish rejection).
bool bearRejAtHigh =
   (h1 > hiRev + tol) &&
   (c1 < hiRev) &&
   (cpi1 <= -InpStrongThreshold) &&
   (cpi2 >= -InpNeutralBand) &&
   PassWickHigh(o1,h1,l1,c1);
CPI validation uses a threshold flip model rather than gradual improvement. For bearish rejection, sh1 must show strong negative CPI while sh2 must not be strongly negative. For bullish rejection, sh1 must show strong positive CPI while sh2 must not be strongly positive. Optional wick filters can be enabled to require a minimum wick length, reducing false positives from shallow or ambiguous probes.
Rejection reference levels (hiRev / loRev) are computed using startShift = sh1 + 1, excluding the confirmation candle while retaining the established session structure.
Classification Limiting Per Session
To prevent repeated markings at the same boundary, a one-time-per-side classification rule can be enabled via InpOncePerSessionPerSide. When active, doneHighSide suppresses repeat classifications at the session high, and doneLowSide suppresses repeat classifications at the session low. These flags automatically reset when the session transitions to a new anchor window.
if(InpOncePerSessionPerSide)
{
   if(s.doneHighSide) bearRejAtHigh = false;
   if(s.doneLowSide)  bullRejAtLow  = false;
}
Visual Output Layer
The visual layer is designed for interpretation rather than execution. Session rectangles are drawn using OBJ_RECTANGLE with configurable color and transparency. When a breakout or rejection is confirmed, signal arrows are placed on the confirmation candle (sh1). CPI mini-markers are also drawn on sh1 to visualize pressure magnitude and direction: marker height encodes strength, while color encodes bullish/bearish intensity.
DrawArrow(t1, h1 + 10*_Point, false, s.name+"_REJH");
DrawCPIMarkerOnBar(t1, h1, l1, cpi1, s.name+"_CPI");
All visual elements are derived solely from closed candles and are not recalculated on each tick, ensuring deterministic rendering.
Historical Reconstruction vs Live Operation
When attached to a chart, the tool can perform bounded historical reconstruction using EvaluateHistoryLookback(), walking from older bars toward newer bars to rebuild session rectangles and classify events without triggering alerts.
if(bar0 != g_lastBarTime)
{
   g_lastBarTime = bar0;
   for(int i=0;i<3;i++)
      EvaluateSignalsForSessionLive(g_sess[i]);
}
In live operation, session tracking is updated using the most recently closed candle, and signal classification occurs only when a new bar forms. This ensures that evaluation logic matches historical behavior exactly—one assessment per closed candle with no discrepancies between modes.
EvaluateHistoryLookback(); // no alerts
Testing and Outcomes
Testing was performed using the MetaTrader 5 Strategy Tester in visual mode to evaluate structural correctness, timing discipline, and identical behavior of classification. The purpose of testing was analytical validation rather than trade performance. The same implementation, parameters, and session definitions were applied without modification.
To verify robustness across different market conditions, testing was conducted on EURUSD, representing a relatively stable FX environment, and XAUUSD (Gold), representing a higher-volatility instrument with sharper session-driven movements.
Session Construction and Stability
Across both symbols, Tokyo, London, and New York session windows formed sequentially and aligned correctly with broker time. Session rectangles expanded only while their respective sessions were active and remained stable once the session window progressed. Boundaries were never altered after the candle close. This behavior was observed consistently in historical reconstruction and live tester playback, confirming that session membership is evaluated using absolute candle timestamps and that range construction respects closed-candle constraints.
Figure above: Strategy Tester for EURUSD H1
Acceptance and Rejection at Session Boundaries
On EURUSD, session boundary interactions were generally orderly. Breakout acceptance followed a clear two-candle sequence: a CPI-supported break candle followed by a confirmation candle that retested and held beyond the session boundary. Rejection cases showed brief probes beyond session levels followed by decisive closes back inside the range, often accompanied by clear CPI threshold flips.
On XAUUSD, the same logic held under higher volatility. Session boundaries were tested more aggressively, but classifications remained controlled and non-repetitive. The noise gate and CPI thresholds filtered out minor fluctuations, allowing only structurally meaningful interactions to be marked.
The once-per-session-per-side constraint proved especially effective in volatile conditions, preventing repeated classifications during rapid boundary testing.

Figure above: Test on XAUUSD H1
Visual Interpretation and Analytical Value
Session rectangles provided time-based structural context, while arrows marked classified interactions at session boundaries. CPI mini-markers added pressure context directly on confirmation candles, making it possible to distinguish acceptance from rejection without relying on candle color alone.
On EURUSD, this produced clean and instructional examples. On XAUUSD, the same visual language clarified intent within large intraday ranges, separating volatility from directional commitment.
Conclusion
This article explored how session structure and candle-level pressure can be combined to interpret acceptance and rejection at key market boundaries. By treating each trading session as a self-contained phase with its own developing range, session highs and lows were approached not as static lines, but as contextual decision zones whose relevance emerges through price behavior and internal pressure.
The Candle Pressure Index provided a practical lens for evaluating that behavior. Beyond candle color alone or size alone, CPI exposed whether interactions at session boundaries were supported by sustained buying or selling pressure, or whether they reflected weak probes likely to fail. When applied using closed-candle logic and a two-candle confirmation model, this approach allowed continuation and rejection to be distinguished without introducing discretionary rules. The MQL5 implementation showed that the framework remains stable across different instruments and volatility regimes. Testing on both EURUSD and XAUUSD demonstrated consistent session construction, CPI evaluation, and classification behavior when analysis was restricted to fully closed candles. Both modes produced matching outcomes, reinforcing the analytical reliability of the approach.
This framework is presented strictly as an analytical tool, not as a standalone trading system. Its value lies in clarity. By combining time-based session structure with pressure-based candle evaluation, the implementation provides a structured way to observe, study, and contextualize session-level price behavior alongside other forms of market analysis.
Warning: All rights to these materials are reserved by MetaQuotes Ltd. Copying or reprinting of these materials in whole or in part is prohibited.
This article was written by a user of the site and reflects their personal views. MetaQuotes Ltd is not responsible for the accuracy of the information presented, nor for any consequences resulting from the use of the solutions, strategies or recommendations described.

- Free trading apps
- Over 8,000 signals for copying
- Economic news for exploring financial markets
You agree to website policy and terms of use