Price Action Analysis Toolkit Development (Part 33): Candle Range Theory Tool

Contents
Introduction
Volatility is the market’s primary language. Before any oscillator turns, before most trend-following filters react, price has already expressed a clear opinion through the simple distance it travels within a single bar. A sudden range expansion often indicates aggressive participation from large players; a prolonged contraction suggests liquidity is being withdrawn anticipating the next move. Likewise, a bar that stays entirely inside its predecessor reveals temporary indecision, whereas a bar that engulfs the previous range reflects decisive order-flow. These behaviors are apparent yet rarely formalized into a robust, machine-readable process.
This article presents Candle-Range Theory (CRT), a concise framework that classifies every completed candle into one of four mutually exclusive categories:
- Large-Range (LR) – the candle’s true range exceeds a configurable multiple of its recent Average True Range (ATR).
- Small-Range (SR) – the candle’s range is smaller than a lower multiple of ATR, signaling compression.
- Inside Bar (IB) – the entire candle remains within the high–low boundaries of its immediate predecessor.
- Outside Bar (OB) – the candle breaches both the prior high and low during its lifespan, engulfing the earlier range.
Rather than introduce another opaque indicator, CRT focuses on delivering these well-defined concepts through a lean, production-ready toolset for MetaTrader 5:
- CRangePattern.mqh – a header-only class that classifies a candle in constant time. It requires only four price arrays (open, high, low, close), returns Boolean flags for each pattern, and allocates no dynamic memory.
- CRT Indicator.mq5 – an overlay that highlights each LR, SR, IB, and OB candle using semi-transparent rectangles and optional arrows. Colors, opacity, arrow glyphs, and sizes are fully customizable, ensuring the visual layer integrates cleanly with any existing chart template without breaching the platform’s eight-buffer limit.
- CRT Expert Advisor.mq5 – an alert engine that operates exclusively on closed bars, ensuring non-repainting signals. It can filter which patterns generate pop-ups, sounds, or push notifications, and, when desired, automatically attaches the indicator so that visual and auditory information remain synchronised during live trading or visual back-testing.
All components compile without warnings under MetaTrader 5 build 4180 or later and adhere to #property strict. They copy only the small history window required for ATR calculation, thereby imposing a negligible CPU footprint even on high-frequency charts. Because the system processes data strictly at the close of each candle, its outputs remain stable across timeframes, symbols and testing modes.
The objectives of this tutorial are fourfold:
- Provide the precise mathematical definitions of LR, SR, IB and OB.
- Demonstrate how to integrate the CRangePattern class into any indicator, EA or script.
- Explain the design decisions that make the accompanying indicator lightweight, flicker-free and compatible with complex chart layouts.
- Show how the Expert Advisor delivers tester-safe alerts, allowing comprehensive evaluation of CRT signals in both historical and real-time environments.
By the conclusion of the article, you will possess a compact yet extensible framework that transforms raw volatility into clear, actionable information—ready for discretionary analysis, automated trading, or further research.
Advantages of the Candle-Range Theory Toolkit:
| Advantage | Description | Practical Impact |
|---|---|---|
| Precise definitions | LR, SR, IB, and OB are calculated with explicit ATR-based and price-relation formulas. | Removes ambiguity; every candle belongs to one—and only one—category. |
| Non-repainting logic | All calculations are executed on the just-closed bar; no values are revised later. | Signals remain stable across chart refreshes, optimisations, and live trading. |
| Minimal data footprint | The indicator copies only ATR_Period + 3 bars; the EA copies the same. | Reduces RAM usage and accelerates Strategy Tester runs. |
| Buffer-free display | Visuals are drawn with chart objects, not indicator buffers. | Avoids MetaTrader’s eight-buffer limit; compatible with complex templates. |
| Full customisation | Colours, opacity, arrow glyphs, ATR period, and large/small multipliers are user inputs. | Adapts seamlessly to any personal or corporate chart style guide. |
| Modular architecture | Class, indicator, and EA are independent files communicating via well-defined interfaces. | Developers can embed the class in other projects or swap the indicator without refactoring. |
| Strict-mode compliance | All sources compile cleanly under #property strict on build 4180+. | Ensures maximum forward compatibility with future MetaTrader builds. |
| ATR normalisation | Range thresholds adjust automatically to instrument volatility. | Settings transfer reliably across Forex, CFDs, crypto, indices, and futures. |
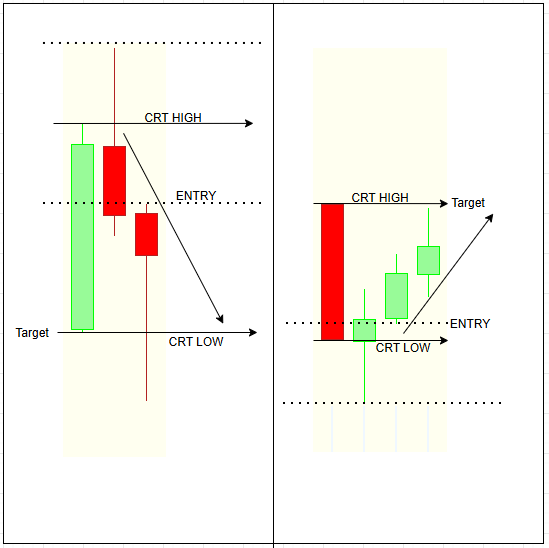
Strategy Overview
Candle-Range Theory classifies every completed candle into one—and only one—of four categories. A bar whose true range swells far beyond recent volatility is labelled a Large-Range (LR) candle, while one that contracts to a fraction of normal is tagged Small-Range (SR). If the entire high-low span of the new bar fits inside the previous bar’s range it becomes an Inside Bar (IB); conversely, if it exceeds both the prior high and low it is marked as an Outside Bar (OB). The sections that follow explain the statistical foundations and precise rules used to detect each of these four patterns.
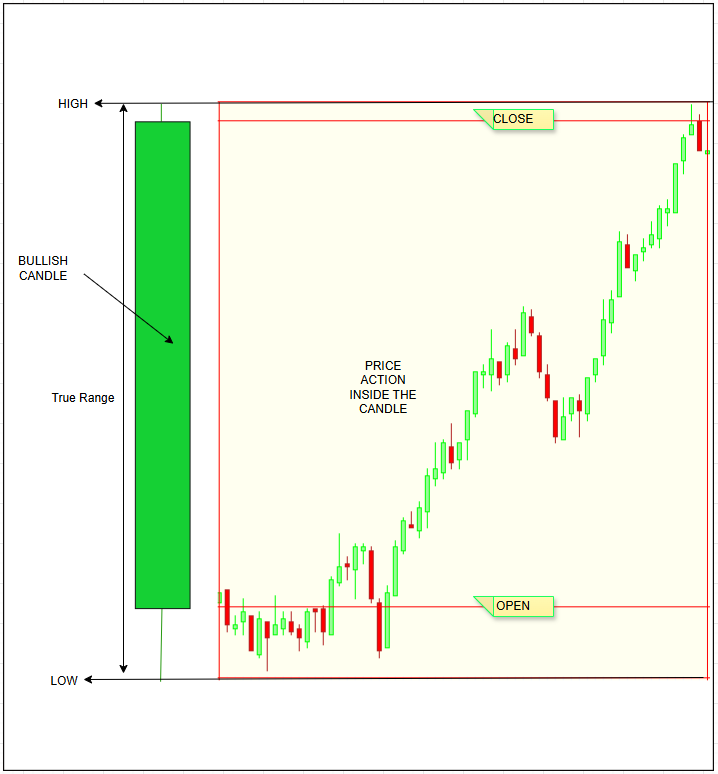
True Range (TR)
It is Wilder’s measure of raw volatility. It captures a period’s full price movement—including any gaps—by taking the greatest of:
- Current High minus Current Low
- Absolute value of Current High minus Previous Close
- Absolute value of Current Low minus Previous Close
TR = max(
  Highₜ – Lowₜ,
 │Highₜ – Closeₜ₋₁│,
  │Lowₜ – Closeₜ₋₁│
)
By using True Range instead of just the high–low span, overnight gaps are fully captured—ensuring volatility measures remain consistent across all instruments and trading sessions.
Average True Range (ATR)
Putting volatility into context, a raw True Range alone isn’t meaningful: 25 pips on EURUSD is large, but 25 pips on XAUUSD is negligible. Candle‑Range Theory accounts for this by normalizing each period’s True Range against the average of the last N values—smoothing out raw spikes and providing a consistent volatility benchmark.
// Simple arithmetic ATR
double ATR(const int shift,const int period,
           const double &H[],const double &L[],const double &C[])
{
   double sum = 0.0;
   for(int i = shift; i < shift + period; ++i)
      sum += MathMax(H[i]-L[i],
              MathMax(MathAbs(H[i]-C[i+1]),
                      MathAbs(C[i+1]-L[i])));
   return sum / period;
}
In practice, CRT applies a straightforward arithmetic mean—rather than Wilder’s exponential smoothing—because it’s fast, transparent, and perfectly adequate for classifying price behavior. By default, it uses a 14‑bar window, matching the standard ATR setup.
Range multipliers – objective thresholds
Two user-defined multipliers convert ATR into categorical thresholds:- largeMult (default = 1.5)
- smallMult (default = 0.5)
// ---- User-defined ATR multipliers --------------------------------------
input double largeMult = 1.5;   // Bars ≥ 1.5 × ATR are flagged “Large-Range”
input double smallMult = 0.5;   // Bars ≤ 0.5 × ATR are flagged “Small-Range”
These parameters answer:
- How much larger than average must a bar be to qualify as unusually large?
- How small must a bar be before we consider it compressed?
Framing these cutoffs in ATR units keeps CRT portable across symbols, timeframes, and volatility regimes.
Large-Range (LR) bars – evidence of urgent participation
A candle is deemed Large-Range when, its true range is equal to or greater than the selected multiple (largeMult) of the current ATR.// ---- Large-Range (LR) test --------------------------------------------- bool isLargeRange = (trueRange >= largeMult * atrCurrent);
Significant participation, often triggered by scheduled news or block trades—yields range of this scale. These large bars tend to herald either the onset of a sustained directional move or the final capitulation of the prior trend. In both cases, they’re information‑rich events: the “what” (an abnormally wide range) is crystal clear, even if the “why” (earnings releases, macro data, forced liquidations) isn’t.
Small-Range (SR) bars – volatility compression
Conversely, a candle is Small-Range when, its true range is no greater than the chosen fraction (smallMult) of the prevailing ATR. Persistent contraction telegraphs reduced liquidity, dealer hedging, or a balanced order book.
// ---- Small-Range (SR) test ---------------------------------------------
bool isSmallRange = (trueRange <= smallMult * atrCurrent);
Markets rarely stay quiet indefinitely; clustering SR bars often marks the pause before a new expansion, making them valuable in breakout and straddle concepts.
Inside Bars (IB) – containment and indecision
A candle is classified as an Inside Bar when its entire range fits within that of the previous candle—that is, its high is lower than the prior high and its low is higher than the prior low.
// Inside-Bar test for the candle at 'shift' (e.g., shift = 1 → just-closed bar)
bool isInsideBar = (High[shift] < High[shift + 1]) &&   // current high is lower than previous high
                   (Low[shift]  > Low[shift + 1]);      // current low  is higher than previous low
Such bars signal vigorous order-flow—often stop-loss hunts, forced liquidation, or aggressive accumulation/distribution. Because the market traverses both sides of the prior candle, OBs compress multiple stop layers into a single session, frequently resulting in either (a) a lasting reversal if absorption dominates, or (b) an acceleration in the original trend if breakout liquidity is quickly consumed.
Mutual exclusivity and hierarchy
The four categories are designed to be mutually exclusive; a candle can satisfy at most one definition:
- If it is LR or SR, range-magnitude rules take precedence.
- If neither LR nor SR, the system tests for IB.
- Only if IB fails does it check for OB.
This hierarchy eliminates interpretational overlap and keeps downstream logic (alerts, visual mapping) unambiguous.
Temporal discipline—closed‑bar processing
CRT analyzes only the most recently completed candle (bar 1), ignoring the still‑forming bar (bar 0). This guarantees non‑repainting signals: what you see in real‑time is accurately what a historical back‑test would have produced.
From raw data to actionable cues
By classifying each bar into one of four states, CRT delivers:
- A binary signal stream for automated strategies (true/false flags per category)
- A visual language for discretionary trading (color‑coded bars and arrows)
- A trigger framework for alerts and additional filters (trend, session, volume)
Code Breakdown
The Candle-Range Theory toolkit is deliberately modular. Each component—the header file, the indicator, and the expert advisor—performs a single, clearly-defined task and communicates with the others through a minimal interface. This section walks through the source code in the same order MetaTrader executes it, explaining the purpose of every major block and the rationale behind the implementation choices.
CandleRangeTheory.mqh – the classification engine
The header begins with #property strict, enforcing modern type checking and eliminating legacy compiler leniencies. Immediately after, the CRangePattern class is declared. Its public data members—atrPeriod, largeMult, and smallMult—act as run-time parameters rather than hard-coded constants, ensuring that any script including the header can adjust behavior without recompiling the class itself. Four boolean flags—isLarge, isSmall, isInside, and isOutside—form the output interface. Once Calculate() returns, exactly one of these will be true; the calling program needs no further arithmetic to decide what happened on the analyzed candle.
#property strict               // enforce modern type checking
#ifndef  __CANDLE_RANGE_THEORY_MQH__
#define  __CANDLE_RANGE_THEORY_MQH__

class CRangePattern
{
public:
   int    atrPeriod;           // ATR length
   double largeMult,smallMult; // LR / SR thresholds

   bool   isLarge,isSmall,
          isInside,isOutside;  // output flags
   double atr,trueRange,bodyRange;
The constructor assigns practical defaults—an ATR of fourteen periods, a large multiplier of 1.5, and a small multiplier of 0.5—then calls a private Reset() helper that clears all result fields to a known state. Using a helper avoids code duplication; the same routine is invoked both at construction and at the start of every calculation.
private:
   void Reset()
   {
      isLarge=isSmall=isInside=isOutside=false;
      atr=trueRange=bodyRange=0.0;
   }

public:
   CRangePattern()             // default parameters
   {
      Reset();
      atrPeriod=14;
      largeMult=1.5;
      smallMult=0.5;
   }
Calculate() itself is intentionally concise. It first verifies that sufficient history is available (bars < atrPeriod + sh + 2) because both ATR and true range need to reference at least one bar before the evaluation point. True range and body range are computed in accordance with Wilder’s definition, guaranteeing compatibility with any standard ATR reading, whether from this script or an external indicator.
bool Calculate(const int sh,
               const double &H[],const double &L[],
               const double &O[],const double &C[],
               const int bars)
{
   Reset();
   if(bars < atrPeriod + sh + 2)   // enough candles?
      return false;

   // true range of target candle
   trueRange = MathMax(H[sh]-L[sh],
               MathMax(MathAbs(H[sh]-C[sh+1]),
                       MathAbs(C[sh+1]-L[sh])));
   bodyRange  = MathAbs(O[sh]-C[sh]);
The ATR loop iterates exactly atrPeriod times. Because the earlier history-check guarantees that i + 1 is in-bounds, the inner test && i+1 < bars would be redundant and is therefore omitted. Removing that guard simplifies the code path and eliminates a branch, improving performance on high-frequency data without compromising safety.
   double sum = 0.0;
   for(int i = sh; i < sh + atrPeriod; ++i)      // exactly atrPeriod
   {
      double tr = MathMax(H[i]-L[i],
                  MathMax(MathAbs(H[i]-C[i+1]),
                          MathAbs(C[i+1]-L[i])));
      sum += tr;
   }
   atr = sum / atrPeriod;
After the average is derived, the function classifies the candle. If the true range exceeds the upper multiple, isLarge is set; if it falls below the lower multiple, isSmall is set. A second comparison layer evaluates the relationship to the previous candle’s highs and lows, toggling isInside or isOutside as appropriate. Because all four flags are mutually exclusive, no further checks are required, and the function returns true to confirm completion.
   if(trueRange >= largeMult*atr)      isLarge   = true;
   else
   if(trueRange <= smallMult*atr)      isSmall   = true;

   if(H[sh] < H[sh+1] && L[sh] > L[sh+1])        isInside  = true;
   else
   if(H[sh] > H[sh+1] && L[sh] < L[sh+1])        isOutside = true;

   return true;
}
#endif
CRT Indicator.mq5 – visual presentation
The indicator file introduces no buffers; instead, it relies entirely on chart objects. By avoiding buffers, the script sidesteps MetaTrader’s eight-buffer ceiling, leaving room for traders to combine the overlay with other studies. On initialization, the input values from the Inputs dialog are written directly into the public fields of an internal CRangePattern instance named pat. Nothing else is stored globally, ensuring that a parameter change in MetaTrader results in a full re-initialization rather than partial state carry-over.
#property indicator_chart_window
#include <CandleRangeTheory.mqh>

input int     ATR_Period = 14;
...
CRangePattern pat;

int OnInit()
{
   pat.atrPeriod = ATR_Period;
   pat.largeMult = LargeXATR;
   pat.smallMult = SmallXATR;
   return(INIT_SUCCEEDED);
}
OnCalculate() is invoked whenever MetaTrader decides new data are available. The function first checks that the chart has at least atrPeriod + 3 bars—two extra because the ATR loop requires one bar preceding the current one and Calculate() itself references the candle at shift + 1. Only a thin slice of history of this size is copied into four local arrays (H, L, O, C). Each array is then flagged as a series so that index 0 always denotes the most recent bar.
int OnCalculate(const int rates_total,
                const int prev_calculated,
                const int begin,
                const double &price[])
{
   const int need = pat.atrPeriod + 3;
   if(rates_total < need) return rates_total;

   double H[],L[],O[],C[];
   ArrayResize(H,need); ArraySetAsSeries(H,true);
   ArrayResize(L,need); ArraySetAsSeries(L,true);
   ArrayResize(O,need); ArraySetAsSeries(O,true);
   ArrayResize(C,need); ArraySetAsSeries(C,true);

   CopyHigh (_Symbol,_Period,0,need,H);
   CopyLow  (_Symbol,_Period,0,need,L);
   CopyOpen (_Symbol,_Period,0,need,O);
   CopyClose(_Symbol,_Period,0,need,C);
With the data prepared, pat.Calculate(1, …) is called. Passing a shift of one ensures that analysis is performed on the most recently closed bar, never on the still-forming candle. If classification yields no active flag—that is, the candle is neither large nor small nor inside nor outside—the function returns immediately, and the chart remains untouched. When a pattern is present, the indicator chooses display properties: rectangle colour derived from ARGB values (allowing opacity control) and an arrow code and colour consistent with user preference.
   if(!pat.Calculate(1,H,L,O,C,need)) return rates_total;

   uint  rClr  = 0;         // rectangle colour (ARGB)
   int   aCode = 221;       // ● default arrow
   color aClr  = clrYellow;

   if(pat.isLarge)
   {
      bool bull = (C[1] > O[1]);
      rClr  = ColorToARGB(bull?clrLime:clrRed,Opacity);
      aCode = bull ? 233 /*▲*/ : 234 /*▼*/;
      aClr  = bull ? clrLime     : clrRed;
   }
   else if(pat.isSmall)     { rClr = ColorToARGB(clrYellow,Opacity); }
   else if(pat.isInside)    { rClr = ColorToARGB(clrAqua,Opacity);   }
   else if(pat.isOutside)   { rClr = ColorToARGB(clrMagenta,Opacity);}
   else return rates_total; // nothing to draw
Rectangle creation uses two-time coordinates, the opening of the bar at shift 2 and the opening of the bar at shift 1; this spans the full duration of the target candle. The high and low of the target candle define the vertical boundaries. OBJPROP_FILL is set to true, so the rectangle shows as a translucent block rather than a hollow frame. An optional arrow is then placed at a modest ATR-scaled offset above or below the candle to maintain visibility across instruments with vastly different tick sizes. Both the rectangle and the arrow are tagged with the candle’s opening timestamp, making their names unique and allowing the script to delete prior duplicates before drawing new objects.
   datetime tClosed = iTime(_Symbol,_Period,1);
   string tagR = "CRT_RECT_"+(string)tClosed;
   string tagA = "CRT_ARW_" +(string)tClosed;

   ObjectDelete(0,tagR);                     // avoid duplicates
   ObjectCreate(0,tagR,OBJ_RECTANGLE,0,
                iTime(_Symbol,_Period,2),H[1],
                tClosed,L[1]);
   ObjectSetInteger(0,tagR,OBJPROP_COLOR,rClr);
   ObjectSetInteger(0,tagR,OBJPROP_FILL,true);
   ObjectSetInteger(0,tagR,OBJPROP_BACK,true);

   double y = (aCode==233 ? H[1]+0.2*pat.atr : L[1]-0.2*pat.atr);
   ObjectCreate(0,tagA,OBJ_ARROW,0,tClosed,y);
   ObjectSetInteger(0,tagA,OBJPROP_ARROWCODE,aCode);
   ObjectSetInteger(0,tagA,OBJPROP_COLOR,aClr);
   return rates_total;
}
CandleRangeTheory.mq5 – alert generation
The Expert Advisor shares the same header and therefore the same deterministic classification logic. Upon initialization it duplicates the parameter-transfer step performed in the indicator. It additionally checks whether it is running inside the Strategy Tester’s non-visual mode; if so, it suppresses GUI functions such as Alert() or PlaySound(), thereby preventing run-time errors during batch optimization.
#include <CandleRangeTheory.mqh>
input bool Push_Alerts = false;
...
CRangePattern pat;
const bool NonVisualTest = (bool)MQLInfoInteger(MQL_TESTER) &&
                           !MQLInfoInteger(MQL_VISUAL_MODE);

int OnInit()
{
   pat.atrPeriod = ATR_Period;
   pat.largeMult = LargeXATR;
   pat.smallMult = SmallXATR;
   return INIT_SUCCEEDED;
}
When the EA is attached in a live chart or a visual test, it uses iCustom() to load the indicator automatically. Success or failure is written to the experts journal for transparency. On de-initialization any indicator handles are released manually to prevent memory leaks and chart clutter.
int indHndl = INVALID_HANDLE;

int OnInit()
{
   ...
   if(!NonVisualTest)
   {
      indHndl = iCustom(_Symbol,_Period,"CRT Indicator",
                        ATR_Period,LargeXATR,SmallXATR);
      if(indHndl != INVALID_HANDLE)
         ChartIndicatorAdd(0,0,indHndl);
   }
   return INIT_SUCCEEDED;
}

void OnDeinit(const int reason)
{
   if(indHndl != INVALID_HANDLE)
      IndicatorRelease(indHndl);
}
The core logic lives inside OnTick(). The EA records the opening time of the candle at shift 1 and refuses to run again until that value changes, guaranteeing exactly one evaluation per completed candle regardless of tick frequency. A compact history block is copied—this time the arrays are explicitly converted to series to align them with the requirements of CRangePattern. If the classification concludes with an active pattern, the EA constructs a plain-language message that includes symbol, timeframe, and the category detected. Pop-up, sound, and push notifications are issued according to user settings, but only when permissible in the current execution environment.
datetime lastDone = 0;

void OnTick()
{
   datetime tClosed = iTime(_Symbol,_Period,1);
   if(tClosed == lastDone) return;      // already processed
   lastDone = tClosed;

   const int need = pat.atrPeriod + 3;
   double H[],L[],O[],C[];
   ArrayResize(H,need); ArraySetAsSeries(H,true);
   ArrayResize(L,need); ArraySetAsSeries(L,true);
   ArrayResize(O,need); ArraySetAsSeries(O,true);
   ArrayResize(C,need); ArraySetAsSeries(C,true);

   CopyHigh (_Symbol,_Period,0,need,H);
   CopyLow  (_Symbol,_Period,0,need,L);
   CopyOpen (_Symbol,_Period,0,need,O);
   CopyClose(_Symbol,_Period,0,need,C);

   if(!pat.Calculate(1,H,L,O,C,need)) return;

   string sig;
   if(pat.isLarge)   sig="Large-Range bar";
   else if(pat.isSmall)   sig="Small-Range bar";
   else if(pat.isInside)  sig="Inside bar";
   else if(pat.isOutside) sig="Outside bar";
   if(sig=="") return;

   string msg = _Symbol+" "+EnumToString(_Period)+"  "+sig;
   Print("[CRT-EA] ",msg);

   if(!NonVisualTest) Alert(msg);
   if(Push_Alerts)    SendNotification(msg);
}
Throughout the EA, optional debug statements provide concise feedback on actions such as successful indicator attachment or the absence of adequate history. Because these messages are conditional on a DebugLog flag, production deployments can run silently, whereas development or research sessions can be fully instrumented.
input bool DebugLog = true;

if(DebugLog)
   PrintFormat("[CRT-EA] Attached on %s %s  (tester=%d)",
               _Symbol,EnumToString(_Period),
               (int)MQLInfoInteger(MQL_TESTER));
The toolkit avoids static or global mutable state beyond the objects explicitly required for operation. All dynamic objects created on the chart are either released automatically by MetaTrader when their parent indicator is removed or explicitly deleted in code. No persistent arrays grow with time; each tick triggers a fixed-size copy and classification pass whose time complexity is independent of chart length. Consequently, the system scales from weekly charts to one-second bars without modifications and without risking gradual performance degradation.
// inside any function needing history
const int need = pat.atrPeriod + 3;
double  H[need], L[need], O[need], C[need];   // stack allocation in C++17 style
// (or ArrayResize + quick release when the function exits)
Testing and Results
In this section, we examine the live-testing results presented below.
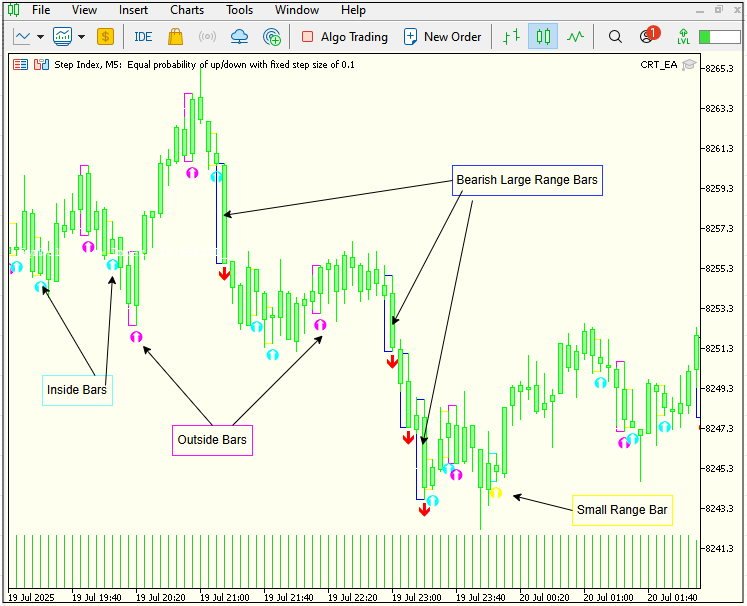
The Gif below illustrates a live 5‑minute Step‑Index chart powered by CRT_EA. As each bar closes, you’ll see colored boxes, markers, and arrows appear to indicate whether volatility is shrinking, expanding, or fully swallowing the prior range. Quiet, narrow “inside” bars cluster together, then suddenly a broad‑range candle erupts, signaling a burst of momentum. Behind the scenes, every candle is instantly measured against the current ATR and re‑classified—so you get an uninterrupted, color‑coded snapshot of market energy without ever repainting past bars. This real‑time display makes it effortless to spot when the market is coiling up, when it breaks free, and how each bar contributes to the larger volatility cycle.
| Class | Rectangle Color | Arrow/Marker | Meaning |
|---|---|---|---|
| Large-Range Bar (LR) | Royal-Blue Border | Lime if Bullish, Red if Bearish | Abnormally wide range – range ≥ largeMult × ATR |
| Small-Range Bar (SR) | Yellow Border | Small Yellow Dot | Compressed range – range ≤ smallMult × ATR |
| Inside-Bar (IS) | Aqua Border | Aqua Dot | High < previous high **and** low > previous low |
| Outside-Bar (OB) | Magenta Border | Magenta Dot | High > previous high and low < previous low |
- Step Index Chart
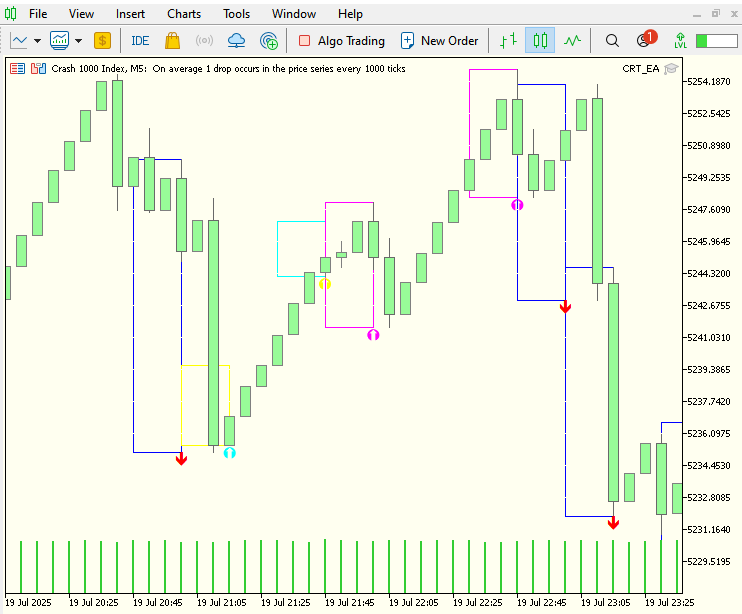
- Crash 1000 Index Chat
- Boom 1000 Index Chart
B 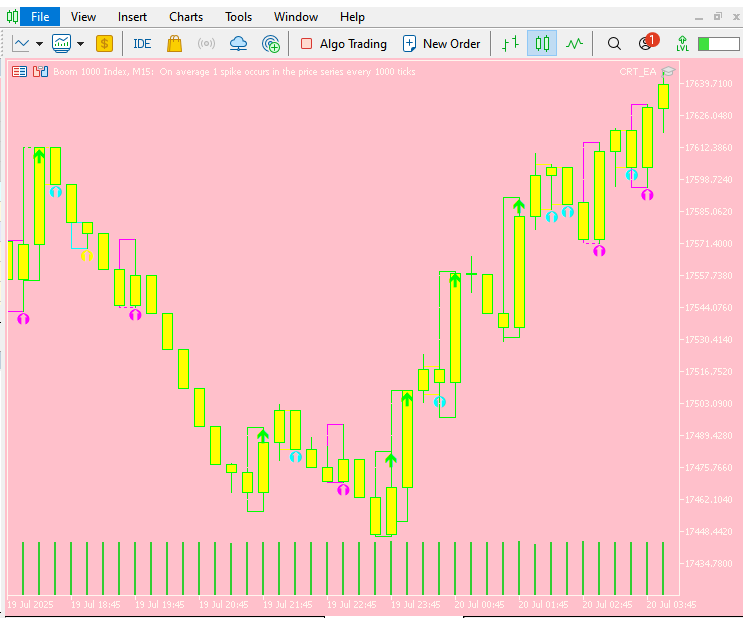
Conclusion
The Candle-Range Theory toolkit delivers a complete, modular solution for range analysis in MetaTrader 5.
- CRangePattern — a compact, self-contained class that identifies Large-Range, Small-Range, Inside, and Outside bars without repainting.
- CRT_Indicator — overlays signals with color-coded boxes and arrows for instant visual interpretation.
- CRT_EA — converts the same signals into alerts or automated orders.
All parameters—ATR length, small/large multipliers, alert rules—are fully configurable, allowing the framework to adapt to any symbol, timeframe, or volatility regime. Because the detection logic is isolated from rendering and execution layers, you can extend or embed it in scanners, dashboards, or full trading systems with minimal code changes.
The toolkit is intended for educational purposes and should be tested on a demo account before any live deployment. Combine its objective range signals with your own trade-selection and risk-management rules to ensure the methodology aligns with your overall strategy.
Used in this way, Candle-Range Theory equips you to identify, visualise, and act on volatility events with speed, clarity, and confidence.
Warning: All rights to these materials are reserved by MetaQuotes Ltd. Copying or reprinting of these materials in whole or in part is prohibited.
This article was written by a user of the site and reflects their personal views. MetaQuotes Ltd is not responsible for the accuracy of the information presented, nor for any consequences resulting from the use of the solutions, strategies or recommendations described.

- Free trading apps
- Over 8,000 signals for copying
- Economic news for exploring financial markets
You agree to website policy and terms of use