
Price Action Analysis Toolkit Development (Part 34): Turning Raw Market Data into Predictive Models Using an Advanced Ingestion Pipeline

Introduction
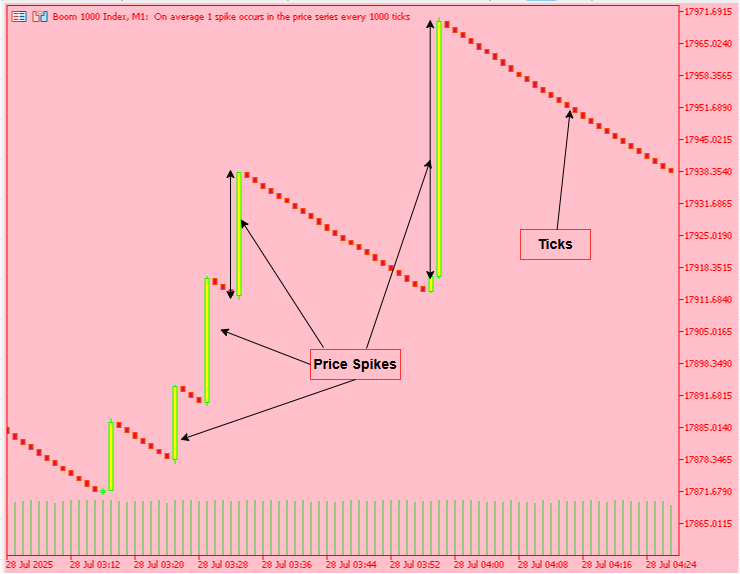
Price action and future price trajectories rest entirely on historical behavior: pivotal support and resistance levels crystallize from past price swings, and Boom‑and‑Crash traders often find themselves blindsided by sudden spikes—or too late to seize them. Without a systematic way to harvest, process, and learn from that past, every trade is a guess.
In this installment of “Price Action Analysis Toolkit Development,” we unveil an end‑to‑end framework that transforms raw MetaTrader 5 history into razor‑sharp, real‑time trading signals via machine learning. The two sides of the engine work in concert:
MQL5 Data Ingestion
- Automated Chunking: A lightweight script attached to any MetaTrader 5 chart slices multi‑symbol bar history into size‑safe JSON payloads. It dynamically halves chunk sizes if they exceed 14 MiB—so you never hit MetaTrader 5’s upload limit or manually export a CSV again.
- Robust Delivery: Each payload is POSTed via WebRequest with retry logic and detailed logging. You get clear feedback on chunk ranges, HTTP status codes, and any errors, ensuring no data gaps in your training set.
Python ML Back‑End
- Unified Feature Matrix: Incoming history and EA‑generated logs are merged and vectorized into a single table, computing spike magnitude, MACD divergence, RSI, ATR, Kalman‑derived trend slopes, envelope bands, and Prophet‑based future deltas—all in one place.
- Asynchronous Model Compilation & Caching: Prophet models fit once per symbol (cached for an hour) and gradient‑boosting classifiers train on demand, so live analysis never stalls. A global fallback model ensures coverage if individual symbol data is sparse.
- Comprehensive API & CLI: Flask endpoints (/upload_history, /upload_spike_csv, /analyze) handle bulk back‑fills, live collection loops, and real‑time signal requests, while a unified CLI covers history import, training, backtesting, and diagnostics.
Before any model can learn to anticipate Boom‑and‑Crash spikes, it needs reliable, high‑volume history. The History Ingest module is our data workhorse:
- Chart-agnostic consistency: No matter which instrument or period (M1, H1, etc.) you test, supplying identical symbol- and timeframe-selection parameters will always return the same dataset—an essential requirement for reproducible research.
- Size‑Limit Compliance: Every JSON payload stays under 14 MiB, never risking MetaTrader 5’s 16 MiB ceiling or half‑sent data.
- Low-Latency Operation: Even 20,000 bars upload in well under a second, making both bulk back‑fills and live polling feasible without slowing MetaTrader 5.
- Centralized Logging & Audit: Printouts show chunk indices, payload sizes, HTTP response details, and retry counts—so you can trace precisely what data reached your Python engine and when.
With this foundation in place, our pipeline guarantees the rich, consistent history feed necessary for training models that detect—and act on—price spikes before they blindside you.
Upcoming Sections:
- Will dissect our feature‑engineering suite and show how we turn raw bars into predictive inputs.
- Digs into model training, caching strategies, and performance tuning.
- Demonstrates deploying those models back into MetaTrader 5 for on‑chart signal alerts and trade execution.
By the end of this series, you’ll have a bulletproof, fully automated toolkit—from historical data capture to live ML‑driven trade signals, designed to give you the edge in fast‑moving Boom‑and‑Crash markets.
Implementation
MQL5 Data Ingestion
This section explains how to implement data ingestion in MQL5; follow the step-by-step instructions below to integrate it into your project.
Script Metadata and Inputs
The top section of the script declares metadata like copyright, version, and author, followed by user-configurable input parameters. These include:
- DaysBack: how many days of historical data to retrieve.
- Timeframe: the chart timeframe (e.g., M1).
- StartChunkBars: initial size of data slices to try sending.
- Timeout_ms: how long to wait for a response from the Python server.
- MaxRetry: how many times to retry a failed POST.
- PauseBetween_ms: pause duration between POST requests.
- PythonURL: the local Python server endpoint.
These inputs make the script adaptable to various needs and network environments.
#property strict
#property script_show_inputs
#property version   "1.0"

input int              DaysBack        = 120;             // how many days of history to fetch
input ENUM_TIMEFRAMES  Timeframe       = PERIOD_M1;       // timeframe for bars
input int              StartChunkBars  = 5000;            // initial slice size (bars)
input int              Timeout_ms      = 120000;          // WebRequest timeout in ms
input int              MaxRetry        = 3;               // retry attempts per chunk
input int              PauseBetween_ms = 200;             // gap between chunk posts
input string           PythonURL       = "http://127.0.0.1:5000/upload_history";
Constants and Inline Helper Functions
A few #define constants are set for controlling maximum JSON size (MAX_BYTES) and the minimum chunk size (MIN_CHUNK). Then, helper functions like L2S (long to string) and D2S (double to string) are defined for formatting numerical values. The add() function appends a value to a growing JSON string and optionally adds a comma, streamlining the JSON building process later in the script.
#define MAX_BYTES  14000000   // keep under MT5’s 16 MiB limit
#define MIN_CHUNK  1000       // don’t slice smaller than this many bars

inline string L2S(long v)        { return StringFormat("%I64d", v); }
inline string D2S(double v)      { return StringFormat("%.5f", v); }
void add(string& s, const string v, bool comma) { s += v; if(comma) s += ","; }
JSON Builder Function
The BuildJSON() function constructs a JSON string from a slice of the historical data arrays (time, close, high, and low). It builds a clean JSON structure representing a chunk of historical bars from from to to, suitable for sending to the Python backend. This approach ensures data consistency and compactness while making each chunk individually serializable.
string BuildJSON(
    const string& sym,
    const long& T[], const double& C[],
    const double& H[], const double& L[],
    int from, int to
) {
    // start JSON with symbol & time array
    string j = "{\"symbol\":\"" + sym + "\",\"time\":[";
    for(int i = from; i < to; i++)
        add(j, L2S(T[i]), i < to - 1);
    j += "],\"close\":[";
    // append close prices
    for(int i = from; i < to; i++)
        add(j, D2S(C[i]), i < to - 1);
    // likewise for high
    j += "],\"high\":[";
    for(int i = from; i < to; i++)
        add(j, D2S(H[i]), i < to - 1);
    // and low
    j += "],\"low\":[";
    for(int i = from; i < to; i++)
        add(j, D2S(L[i]), i < to - 1);
    j += "]}";
    return j;
}
POST Sender with Retry Logic
PostChunk() is responsible for sending the JSON chunk to the Python server using WebRequest. It builds the HTTP headers, converts the JSON to a byte array, and handles retries up to MaxRetry times in case of connection failures or HTTP errors. Each attempt logs status information, making it easier to debug failed transmissions. If all retries fail, the chunk is skipped and the process aborts.
bool PostChunk(const string& json, int from, int to) {
    // convert the JSON string into a UTF‑8 char array
    char body[];
    StringToCharArray(json, body, 0, StringLen(json), CP_UTF8);
    char reply[];
    string hdr = "Content-Type: application/json\r\n", rep_hdr;

    for(int r = 1; r <= MaxRetry; r++) {
        int http = WebRequest("POST", PythonURL, hdr, Timeout_ms,
                              body, reply, rep_hdr);
        if(http != -1 && http < 400) {
            PrintFormat("Chunk %d-%d  HTTP %d  %s", from, to, http,
                        CharArrayToString(reply, 0, WHOLE_ARRAY, CP_UTF8));
            return true;
        }
        // on failure, log and retry
        PrintFormat("Chunk %d-%d  retry %d failed (http=%d err=%d)",
                    from, to, r, http, GetLastError());
        Sleep(500);
    }
    return false;
}
Main Logic in OnStart()
The main routine begins by logging that the uploader is ready, then derives the requested history window (t1 … t2) from the current server time and the DaysBack parameter. Using CopyRates() it retrieves the OHLC data for that window and breaks the result into separate arrays—timestamps, close, high and low—so the information can be serialized efficiently.
Bar data are transmitted in chunks. The loop starts with the user-defined StartChunkBars size, converts that slice into a JSON payload via BuildJSON(), and verifies that the payload is smaller than MAX_BYTES. If the payload exceeds the limit, the chunk size is halved until the payload fits or the fallback threshold MIN_CHUNK is reached. A compliant chunk is dispatched to the Python back-end with PostChunk(), the script pauses for PauseBetween_ms, and then continues with the next slice.
int OnStart() {
    Print("History Ingestor v1.0 ready (timeout=", Timeout_ms, " ms)");
    datetime t2 = TimeCurrent();
    datetime t1 = t2 - (datetime)DaysBack * 24 * 60 * 60;

    // 1) Pull bar history from MT5
    MqlRates r[];
    int total = CopyRates(_Symbol, Timeframe, t1, t2, r);
    if(total <= 0) {
        Print("CopyRates error ", GetLastError());
        return INIT_FAILED;
    }
    ArraySetAsSeries(r, false);

    // 2) Unpack into simple arrays
    long   T[];  double Cl[], Hi[], Lo[];
    ArrayResize(T, total);
    ArrayResize(Cl, total);
    ArrayResize(Hi, total);
    ArrayResize(Lo, total);
    for(int i = 0; i < total; i++) {
        T[i]  = r[i].time;
        Cl[i] = r[i].close;
        Hi[i] = r[i].high;
        Lo[i] = r[i].low;
    }

    // 3) Loop over the data in chunks
    for(int i = 0; i < total;) {
        int  step = StartChunkBars;
        bool sent = false;

        // adaptively shrink chunk until it fits
        while(step >= MIN_CHUNK) {
            int to      = MathMin(total, i + step);
            string js   = BuildJSON(_Symbol, T, Cl, Hi, Lo, i, to);
            double size = double(StringLen(js)) / 1e6;
            PrintFormat("Testing %d–%d  size=%.2f MB", i, to, size);

            if(StringLen(js) < MAX_BYTES) {
                // post & advance index
                if(!PostChunk(js, i, to))
                    return INIT_FAILED;
                i    = to;
                sent = true;
                Sleep(PauseBetween_ms);
                break;
            }
            step /= 2;
        }

        // abort if even the minimum chunk is too big
        if(!sent) {
            Print("Unable to fit minimum chunk – aborting");
            return INIT_FAILED;
        }
    }

    Print("Upload finished: ", total, " bars.");
    return INIT_SUCCEEDED;
}
To set up the “History Ingestor” in MetaEditor, open MetaTrader 5 and press F4 to launch MetaEditor, then choose:
File → New → MQL5 Script
Name it (e.g. HistoryIngestor) and finish the wizard; replace the generated template with your full code (including #property declarations and the OnStart function), save it to the Scripts folder, and press F7 to compile—confirm “0 errors, 0 warnings.” Back in MetaTrader 5’s Navigator under Scripts, drag HistoryIngestor onto a chart and, in the input dialog, adjust parameters like
DaysBack, Timeframe, chunk sizes, timeouts, and PythonURL
Make sure to allow your PythonURL domain under:
Tools → Options → Expert Advisors
This is for WebRequest calls, and ensure sufficient chart history is loaded so CopyRates can fetch the requested bars. Once you click OK, monitor the Experts and Journal tabs for upload progress and any retry or error messages.
Python ML Back-end
This system relies on a range of Python libraries (including models for spike detection), but this article focuses primarily on data ingestion; other components will be covered in future installments. Below is a complete list of third‑party libraries, along with their purposes, followed by the standard‑library modules used:
Third‑party libraries
- numpy, pandas: array and DataFrame handling
- pyarrow (or fastparquet): columnar data serialization
- flask: lightweight web API
- MetaTrader 5: market-data retrieval
- ta: technical-analysis indicators
- scikit-learn, joblib: model training and persistence
- prophet, cmdstanpy: time‑series forecasting
- pykalman: Kalman filtering
- pytz: timezone support
You can install them with:
pip install numpy pandas pyarrow flask MetaTrader5 ta scikit-learn \
            joblib prophet cmdstanpy pykalman pytz
Installing prophet will automatically pull in dependencies such as tqdm, holidays, and lunarcalendar
Built‑in (no installation required)
os, sys, logging, warnings, argparse, threading, io, datetime, pathlib, typing, time
| Package | Purpose in the Script | Where it is used |
|---|---|---|
| Numpy | Vectorized maths on large arrays; foundation for Pandas, TA-lib, scikit-learn. | All feature helpers (np.diff, np.std, predict_proba, …). |
| pandas | Time-series DataFrame, fast CSV/Parquet IO, rolling windows. | Construct DF in /upload_history, deduplicate, feature engineering, model training, back-tests. |
| pyarrow (or fastparquet) | Engine for df.to_parquet() / read_parquet() ; much smaller & faster than CSV, keeps nanosecond timestamps. | cDisk storage of uploaded history per symbol. |
| flask | Lightweight HTTP server that exposes /upload_history, /upload_spike_csv, /analyze. Converts JSON - Python. | All REST endpoints. |
| MetaTrader 5 | Python bridge to a head-less MetaTrader 5 terminal: login, copy_rates_range , symbol subscription. | History import, live collect_loop, back-tester. |
| ta | Pure-python technical-analysis indicators (MACD, RSI, ATR). | Features macd_div, rsi_val, offline_atr. |
| scikit-learn | Machine-learning core (StandardScaler + GradientBoostingClassifier + Pipeline). | Training models, probability inference inside /analyze and back-test. |
| joblib | Fast (de)serialization of scikit models; implements the per-symbol model cache. | joblib.dump/load everywhere models/*.pkl are read or written. |
| cmdstanpy | Stan backend that Prophet compiles to; Prophet will not fit without it. | Imported indirectly by Prophet during fit(). |
| pykalman | Linear Kalman Filter smoothing; returns last/5-bar slope. | kalman_slope() feature. |
| pytz | Explicit UTC localization of datetime objects to avoid broker- vs-system-time confusion. | Conversions in history/back-test ranges. |
| prophet | Low-frequency trend forecast; provides “delta” feature (future price estimate). | prophet_delta() helper and async compilation cache. |
Next, we’ll dive into the portion of the code that handles data collection and storage—right before model training.
Receiving MetaTrader 5 History via WebRequest
On the Python side, a lightweight Flask API (typically running at http://127.0.0.1:5000/upload_history) is set up to handle incoming HTTP POST requests. When the MQL5 script posts a JSON payload containing historical data (symbol name, timestamps, OHLC arrays), this Flask endpoint parses and validates the data. This avoids manual CSV handling and ensures the Python back-end can receive data in real time, automatically, from any MetaTrader 5 chart or EA script using the uploader.
@app.route('/upload_history', methods=['POST'])
def upload_history():
    data = request.get_json()
    df = pd.DataFrame({
        'time': pd.to_datetime(data['time'], unit='s'),
        'close': data['close'],
        'high': data['high'],
        'low': data['low']
    })
    symbol = data['symbol']
    os.makedirs('uploaded_history', exist_ok=True)
    df.to_parquet(f'uploaded_history/{symbol}.parquet', index=False)
    return jsonify({"status": "ok", "rows": len(df)})
Storing and Preprocessing the Data
Once received, the JSON payload is parsed into a Pandas DataFrame and optionally stored in a local file (e.g. .parquet, .csv, or .feather) or written to a time-series database. This provides durability and allows the system to replay past market conditions as needed. The ingested bar data is cleaned, deduplicated, and timestamp-indexed to ensure consistent behavior across repeated uploads or sessions. Preprocessing may also include timezone normalization or zero-bar filtering.
def load_preprocess(symbol):
    df = pd.read_parquet(f'uploaded_history/{symbol}.parquet')
    df.drop_duplicates(subset='time', inplace=True)
    df.set_index('time', inplace=True)
    return df
Feature Engineering Pipeline
The raw OHLC history is transformed into a rich feature matrix that includes both classic technical indicators and ML-relevant metrics. These features may include spike intensity (custom formulas), MACD values, RSI, ATR, Kalman-filtered slopes, and Prophet-generated trend deltas. These features allow the model to understand both short-term volatility and long-term trend context—critical for correctly forecasting price spikes or significant breakouts.
def generate_features(df):
    df['return'] = df['close'].pct_change()
    df['volatility'] = df['return'].rolling(10).std()
    df['range'] = df['high'] - df['low']
    df['spike'] = (df['range'] > df['range'].rolling(50).mean() * 2).astype(int)
    return df.dropna()
Per-Symbol Model Caching and Management
For each symbol ingested, the Python system maintains a per-symbol ML model. These models are either trained fresh using the uploaded historical data or updated incrementally. They are serialized (via joblib, Pickle, or ONNX) and stored in a dedicated cache. This design makes it easy to load the latest model for each symbol when signals need to be served, enabling both reproducibility and speed.
def train_model(symbol, df):
    X = df[['return', 'volatility', 'range']]
    y = df['spike']
    model = RandomForestClassifier(n_estimators=100)
    model.fit(X, y)
    os.makedirs('models', exist_ok=True)
    joblib.dump(model, f'models/{symbol}_model.pkl')
    return model
Command-Line and API Access for Training and Inference
The Python tool provides both command-line utilities (e.g. python train.py --symbol BOOM500) and live Flask endpoints (e.g./predict) to trigger model training, run backtests, or fetch live predictions. This dual interface supports both batch operations and real-time integration with EAs or dashboards. For example, once a model is trained, an MQL5 EA can later query the /predict endpoint and receive “BUY”, “SELL”, or “NO ACTION” signals.
@app.route('/predict', methods=['POST'])
def predict():
    data = request.get_json()
    features = pd.DataFrame([data['features']])
    model = joblib.load(f"models/{data['symbol']}_model.pkl")
    prediction = model.predict(features)[0]
    return jsonify({'signal': 'BUY' if prediction == 1 else 'NO ACTION'})
Backfilling, Retraining, and Continuous Learning
The ingestion system can also operate in continuous mode—listening for new historical slices or live bars as they arrive and triggering periodic retraining or signal generation. This supports adaptive models that remain up to date as market behavior evolves, especially valuable in synthetic instruments like Boom/Crash, which may change volatility or spike frequency over time.
def backfill_and_train(symbol):
    df = load_preprocess(symbol)
    df = generate_features(df)
    train_model(symbol, df)
Logging, Monitoring, and Debugging Tools
To support transparency, the Python side logs every upload, feature generation step, model training event, and signal served. These logs are optionally saved to files or external dashboards. This makes the pipeline auditable, helps trace model behavior, and ensures that both developers and traders can understand why certain predictions were made.
def log_upload(symbol, rows):
    logging.info(f"{symbol} upload received with {rows} rows.")
History Ingestion
In this section, I’ll demonstrate how our automated system performed. After configuring the environments on both the MetaTrader 5 and Python sides, we start by navigating to the directory where our Python script resides using command prompt: PATH TO YOUR FOLDERC:\Users\hp>cd C:\Users\hp\Pictures\Saved Pictures\Analysis EAThen launch the server with: python script_name.py serveYou should see the server start successfully—in my case, the console displayed something like:
 * Running on all addresses (0.0.0.0)
 * Running on http://127.0.0.1:5000
Once the server is up and running, simply drag the script onto the MetaTrader 5 chart—data ingestion and integration will begin immediately.
MetaTrader 5 Experts tab logs:
2025.07.28 22:37:58.239 History Ingestor (Crash 1000 Index,M1)  HistoryUploader v3.20  (timeout=120000 ms) ready
2025.07.28 22:37:58.365 History Ingestor (Crash 1000 Index,M1)  Test 0-5000  size=0.22 MB
2025.07.28 22:38:01.895 History Ingestor (Crash 1000 Index,M1)  Chunk 0-5000  HTTP 200  {"rows_written":4990,"status":"ok"}
2025.07.28 22:38:01.895 History Ingestor (Crash 1000 Index,M1)
2025.07.28 22:38:02.185 History Ingestor (Crash 1000 Index,M1)  Test 5000-10000  size=0.22 MB
2025.07.28 22:38:07.794 History Ingestor (Crash 1000 Index,M1)  Chunk 5000-10000  HTTP 200  {"rows_written":4990,"status":"ok"}
2025.07.28 22:38:07.794 History Ingestor (Crash 1000 Index,M1)
2025.07.28 22:38:08.118 History Ingestor (Crash 1000 Index,M1)  Test 10000-15000  size=0.22 MB
2025.07.28 22:38:13.531 History Ingestor (Boom 1000 Index,M1)   HistoryUploader v3.20  (timeout=120000 ms) ready
2025.07.28 22:38:13.677 History Ingestor (Boom 1000 Index,M1)   Test 0-5000  size=0.24 MB
2025.07.28 22:38:17.710 History Ingestor (Boom 1000 Index,M1)   Chunk 0-5000  HTTP 200  {"rows_written":4990,"status":"ok"}
Command Prompt Python Logs:
Crash 1000 Index            4990 rows
22:38:01  INFO    127.0.0.1 - - [28/Jul/2025 22:38:01] "POST /upload_history HTTP/1.1" 200 -
22:38:01  DEBUG   cmd: where.exe tbb.dll
cwd: None
22:38:02  DEBUG   Adding TBB (C:\Users\hp\AppData\Local\Programs\Python\Python313\Lib\site-packages\
prophet\stan_model\cmdstan-2.33.1\stan\lib\stan_math\lib\tbb) to PATH
22:38:02  DEBUG   input tempfile: C:\Users\hp\AppData\Local\Temp\tmpjw4u6es7\0j91e5cb.json
22:38:02  DEBUG   input tempfile: C:\Users\hp\AppData\Local\Temp\tmpjw4u6es7\lzpoq1nb.json
22:38:02  DEBUG   idx 0
22:38:02  DEBUG   running CmdStan, num_threads: None
22:38:02  DEBUG   CmdStan args: ['C:\\Users\\hp\\AppData\\Local\\Programs\\Python\\Python313
\\Lib\\site-packages\\prophet\\stan_model\\prophet_model.bin', 'random', 'seed=46049', 'data',
'file=C:\\Users\\hp\\AppData\\Local\\Temp\\tmpjw4u6es7\\0j91e5cb.json', 'init=C:\\Users\\hp\\
AppData\\Local\\Temp\\tmpjw4u6es7\\lzpoq1nb.json', 'output', 'file=C:\\Users\\hp\\AppData\\
Local\\Temp\\tmpjw4u6es7\\prophet_modelo4ioyzqc\\prophet_model-20250728223802.csv',
'method=optimize', 'algorithm=lbfgs', 'iter=10000']
22:38:02 - cmdstanpy - INFO - Chain [1] start processing
22:38:02  INFO    Chain [1] start processing
22:38:07  DEBUG   cmd: where.exe tbb.dll
cwd: None
Crash 1000 Index            4990 rows
22:38:07  INFO    127.0.0.1 - - [28/Jul/2025 22:38:07] "POST /upload_history HTTP/1.1" 200 -
22:38:07  DEBUG   TBB already found in load path
22:38:07  DEBUG   input tempfile: C:\Users\hp\AppData\Local\Temp\tmpjw4u6es7\flzd3tj5.json
22:38:08  DEBUG   input tempfile: C:\Users\hp\AppData\Local\Temp\tmpjw4u6es7\et_obcyf.json
22:38:08  DEBUG   idx 0
22:38:08  DEBUG   running CmdStan, num_threads: None
22:38:08  DEBUG   CmdStan args: ['C:\\Users\\hp\\AppData\\Local\\Programs\\Python\\Python313
\\Lib\\site-packages\\prophet\\stan_model\\prophet_model.bin', 'random', 'seed=15747', 'data'
, 'file=C:\\Users\\hp\\AppData\\Local\\Temp\\tmpjw4u6es7\\flzd3tj5.json', 'init=C:\\Users\\hp
\\AppData\\Local\\Temp\\tmpjw4u6es7\\et_obcyf.json', 'output', 'file=C:\\Users\\hp\\AppData\\
Local\\Temp\\tmpjw4u6es7\\prophet_modelgjfhjsn1\\prophet_model-20250728223808.csv',
'method=optimize', 'algorithm=lbfgs', 'iter=10000']
22:38:08 - cmdstanpy - INFO - Chain [1] start processing
22:38:08  INFO    Chain [1] start processing
22:38:10 - cmdstanpy - INFO - Chain [1] done processing
22:38:10  INFO    Chain [1] done processing
22:38:10  INFO    Prophet compiled for Crash 1000 Index
22:38:15 - cmdstanpy - INFO - Chain [1] done processing
22:38:15  INFO    Chain [1] done processing
22:38:15  INFO    Prophet compiled for Crash 1000 Index
22:38:17  DEBUG   cmd: where.exe tbb.dll
cwd: None
Boom 1000 Index             4990 rows
22:38:17  INFO    127.0.0.1 - - [28/Jul/2025 22:38:17] "POST /upload_history HTTP/1.1" 200 -
22:38:17  DEBUG   TBB already found in load path
22:38:17  DEBUG   input tempfile: C:\Users\hp\AppData\Local\Temp\tmpjw4u6es7\9tu4ni1m.json
22:38:17  DEBUG   input tempfile: C:\Users\hp\AppData\Local\Temp\tmpjw4u6es7\dbjg87e6.json
22:38:17  DEBUG   idx 0
22:38:17  DEBUG   running CmdStan, num_threads: None
22:38:17  DEBUG   CmdStan args: ['C:\\Users\\hp\\AppData\\Local\\Programs\\Python\\Python313
\\Lib\\site-packages\\prophet\\stan_model\\prophet_model.bin', 'random', 'seed=45546', 'data',
 'file=C:\\Users\\hp\\AppData\\Local\\Temp\\tmpjw4u6es7\\9tu4ni1m.json', 'init=C:\\Users\\hp
\\AppData\\Local\\Temp\\tmpjw4u6es7\\dbjg87e6.json', 'output', 'file=C:\\Users\\hp\\AppData
\\Local\\Temp\\tmpjw4u6es7\\prophet_modele7mw_egb\\prophet_model-20250728223817.csv',
'method=optimize', 'algorithm=lbfgs', 'iter=10000']
22:38:17 - cmdstanpy - INFO - Chain [1] start processing
22:38:17  INFO    Chain [1] start processing
Crash 1000 Index            4990 rows
22:38:18  INFO    127.0.0.1 - - [28/Jul/2025 22:38:18] "POST /upload_history HTTP/1.1" 200 -
22:38:23 - cmdstanpy - INFO - Chain [1] done processing
22:38:23  INFO    Chain [1] done processing
22:38:24  INFO    Prophet compiled for Boom 1000 Index
Boom 1000 Index             4990 rows
22:38:27  INFO    127.0.0.1 - - [28/Jul/2025 22:38:27] "POST /upload_history HTTP/1.1" 200 -
Crash 1000 Index            4990 rows
22:38:28  INFO    127.0.0.1 - - [28/Jul/2025 22:38:28] "POST /upload_history HTTP/1.1" 200 -
Boom 1000 Index             4990 rows
22:38:37  INFO    127.0.0.1 - - [28/Jul/2025 22:38:37] "POST /upload_history HTTP/1.1" 200 -
Crash 1000 Index            4990 rows
22:38:38  INFO    127.0.0.1 - - [28/Jul/2025 22:38:38] "POST /upload_history HTTP/1.1" 200 -
22:38:49  DEBUG   cmd: where.exe tbb.dll
The logs show that 4,990 rows of historical data for both the Crash 1000 and Boom 1000 indices were ingested and posted successfully to the Python server (HTTP 200), after which CmdStan via cmdstanpy ran optimization chains to compile Prophet models for each index—confirming start and completion of each chain and final “Prophet compiled” messages for both instruments.
Conclusion
We’ve successfully collected historical price data in MetaTrader 5, relayed it to a Python service, and stored it for model training—evidence of which appears in both MetaTrader 5’s Experts tab and our PC’s console logs. This robust data‑ingestion pipeline lays the groundwork for our spike‑detection system. Next, we’ll train the detection model in Python and integrate it back into MetaTrader 5 via an MQL5 EA, so that real‑time signals can be generated and received directly on the trading platform. We’ve successfully collected historical price data in MetaTrader 5, relayed it to a Python service, and stored it for model training—evidence of which appears in both MetaTrader 5’s Experts tab and our PC’s console logs. This robust data‑ingestion pipeline lays the groundwork for our spike‑detection system.
Next, we’ll train the detection model in Python and integrate it back into MetaTrader 5 via an MQL5 EA, so that real‑time signals can be generated and received directly on the trading platform.
If you encounter any difficulties during the setup, please feel free to contact me at any time.
Warning: All rights to these materials are reserved by MetaQuotes Ltd. Copying or reprinting of these materials in whole or in part is prohibited.
This article was written by a user of the site and reflects their personal views. MetaQuotes Ltd is not responsible for the accuracy of the information presented, nor for any consequences resulting from the use of the solutions, strategies or recommendations described.

- Free trading apps
- Over 8,000 signals for copying
- Economic news for exploring financial markets
You agree to website policy and terms of use