Creating Custom Indicators in MQL5 (Part 1): Building a Pivot-Based Trend Indicator with Canvas Gradient

Introduction
In this article, we develop a Pivot-Based Trend Indicator in MetaQuotes Language 5 (MQL5) that calculates fast/slow pivot lines, detects trends with directional arrows, extends pivot lines forward on the chart, and, for enhanced readability, offers optional canvas gradients that highlight bullish or bearish areas. The topics we'll cover in this article include:
By the conclusion, you will have a fully functional MQL5 indicator for pivot trend detection with flexible visual settings. Let us begin the development process.
Understanding the Pivot-Based Trend Indicator Framework
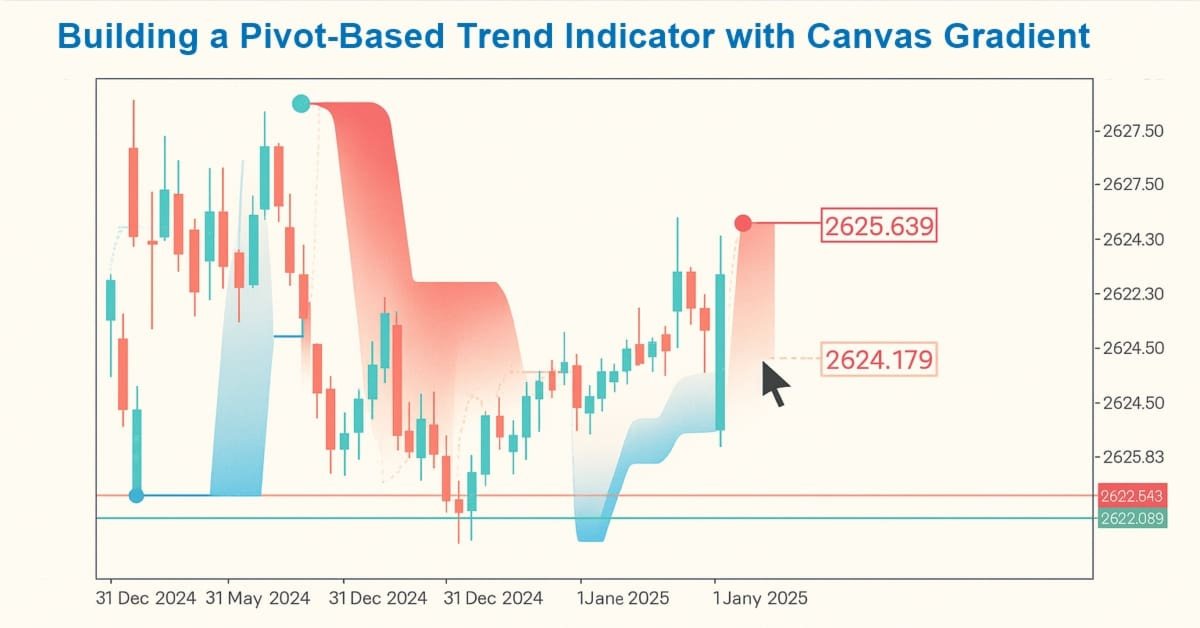
The Pivot Trend Detector indicator is a technical tool that uses fast and slow pivot lines based on high/low ranges over defined periods to identify trend directions and potential reversals, smoothing price data while highlighting shifts through color-coded lines and arrows. It consists of three main lines: a slow line acting as the primary trend reference (up or down based on price position), a fast dotted line that changes color on trend flips, and arrows marking the start of new trends when price crosses both lines.
This setup helps us spot momentum changes, with the slow line providing support/resistance and the fast line offering early signals, adaptable to volatility through period adjustments. In practice, the indicator aids trend-following by confirming uptrends when price stays above the slow line (drawn in up color) and downtrends when price stays below the slow line (drawn in down color), with arrows signaling entry points on crosses and optional extensions protruding from the lines for future projections. Its dynamic line filling visualizes trend strength with gradient opacity, fading from slow to fast for intuitive area highlighting.
We will build the indicator’s architecture on a clear separation of responsibilities: input parameters, indicator buffers, and graphical properties. We will begin by defining the key inputs, such as fast/slow periods, colors, opacity, arrow code, and extensions, which will dictate the behavior of the indicator. We will then allocate eight buffers to store slow-up/down lines, fast lines with colors, trend arrows with colors, and internal calculations for trend/slow values. These buffers will be linked to graphical plots, with properties such as type (line/color line/arrow), color, width, and shift configured using MQL5’s built-in functions. Additionally, we will use the canvas class to fill the space between lines with gradients, ensuring the indicator adapts dynamically to market volatility. In a nutshell, here is an example of what we will be getting.

Implementation in MQL5
To create the indicator in MQL5, just open the MetaEditor, go to the Navigator, locate the Indicators folder, click on the "New" tab, and follow the prompts to create the file. Once it is created, in the coding environment, we will define the indicator properties and settings, such as the number of buffers, plots, and individual line properties, such as the color, width, and label.
//+------------------------------------------------------------------+
//|                                      1. Pivot Trend Detector.mq5 |
//|                           Copyright 2025, Allan Munene Mutiiria. |
//|                                   https://t.me/Forex_Algo_Trader |
//+------------------------------------------------------------------+
#property copyright "Copyright 2025, Allan Munene Mutiiria."
#property link      "https://t.me/Forex_Algo_Trader"
#property version   "1.00"

#property indicator_chart_window
#property indicator_buffers 8
#property indicator_plots 4

#property indicator_label1 "PTD slow line up"
#property indicator_type1 DRAW_LINE
#property indicator_color1 clrDodgerBlue
#property indicator_width1 2

#property indicator_label2 "PTD slow line down"
#property indicator_type2 DRAW_LINE
#property indicator_color2 clrCrimson
#property indicator_width2 2

#property indicator_label3 "PTD fast line"
#property indicator_type3 DRAW_COLOR_LINE
#property indicator_color3 clrDodgerBlue,clrCrimson
#property indicator_style3 STYLE_DOT

#property indicator_label4 "PTD trend start"
#property indicator_type4 DRAW_COLOR_ARROW
#property indicator_color4 clrDodgerBlue,clrCrimson
#property indicator_width4 2
We begin the implementation by defining the indicator's metadata with property directives, specifying it draws in the main chart window with "indicator_chart_window", allocating 8 buffers with indicator_buffers, and configuring 4 plots with "indicator_plots". For the first plot, we label it "PTD slow line up", type as DRAW_LINE, color dodger blue, width 2. The second plot labels "PTD slow line down", type line, color crimson, width 2. The third label, "PTD fast line", type color line, colors dodger blue and crimson, style dot. The fourth labels "PTD trend start", type color arrow, colors dodger blue and crimson, width 2. These properties establish the visual structure for slow up/down lines, color-changing fast lines, and trend start arrows. Then, we will define some input parameters and global variables for use in the program.
#include <Canvas/Canvas.mqh>
//+------------------------------------------------------------------+
//| Global Variables                                                 |
//+------------------------------------------------------------------+
CCanvas obj_Canvas;                                               //--- Canvas object
//--- input parameters
input int    fastPeriod       = 5;                                // Fast period
input int    slowPeriod       = 10;                               // Slow period
input color  upColor          = clrDodgerBlue;                    // Up trend color
input color  downColor        = clrCrimson;                       // Down trend color
input int    fillOpacity      = 128;                              // Fill opacity (0-255)
input int    arrowCode        = 77;                               // Arrow code for trend start
input bool   showExtensions   = true;                             // Show line extensions
input bool   enableFilling    = true;                             // Enable canvas fill (disable for speed)
input int    extendBars       = 1;                                // Extension bars to protrude lines/fill

//--- indicator buffers
double slowLineUpBuffer[],slowLineDownBuffer[],slowLineBuffer[],fastLineBuffer[],fastLineColorBuffer[],trendArrowColorBuffer[],trendArrowBuffer[],trendBuffer[]; //--- Indicator buffers

//--- chart properties
int    currentChartWidth = 0;                                     //--- Current chart width
int    currentChartHeight = 0;                                    //--- Current chart height
int    currentChartScale = 0;                                     //--- Current chart scale
int    firstVisibleBarIndex = 0;                                  //--- First visible bar index
int    visibleBarsCount = 0;                                      //--- Visible bars count
double minPrice = 0.0;                                            //--- Minimum price
double maxPrice = 0.0;                                            //--- Maximum price

//--- optimization flags
static datetime lastRedrawTime = 0;                               //--- Last redraw time
static double   previousTrend = -1;                               //--- Previous trend
string objectPrefix = "PTD_";                                     //--- Object prefix
Here, we include the canvas library with "#include <Canvas/Canvas.mqh>" to enable custom graphical drawing, such as gradient fills between indicator lines for enhanced visualization. We then declare "obj_Canvas" as a global instance of the CCanvas class to manage the bitmap canvas for filling areas. We define input parameters for customization: "fastPeriod" defaulting to 5 for the fast pivot calculation window, "slowPeriod" to 10 for the slow, "upColor" as dodger blue for uptrends, "downColor" as crimson for down, "fillOpacity" to 128 (half transparent) for area fills ranging 0-255, "arrowCode" to 77 for Wingdings trend start symbols, "showExtensions" true to protrude lines beyond the current bar, "enableFilling" true to toggle canvas fills (disable for performance), "extendBars" to 1 for how many bars to extend. You can change the arrow code to use any of the MQL5-defined Wingdings font as below.

Then, we allocate eight global arrays as indicator buffers: "slowLineUpBuffer" and "slowLineDownBuffer" for separate up/down slow lines, "slowLineBuffer" for internal slow calculations, "fastLineBuffer" for the fast line, "fastLineColorBuffer" for its colors, "trendArrowColorBuffer" and "trendArrowBuffer" for arrow positions/colors, and "trendBuffer" for trend states. We set globals for chart properties: "currentChartWidth"/"Height" to 0 for initial size, "currentChartScale" to 0, "firstVisibleBarIndex" to 0 for leftmost bar, "visibleBarsCount" to 0, "minPrice" and "maxPrice" to 0.0 for range. For optimization, we use static "lastRedrawTime" as 0 to debounce redraws, static "previousTrend" to -1 for change detection, and "objectPrefix" as "PTD_" for naming extensions. On compilation, we get the following input parameters window.

With the inputs done, we can move on to the initialization event handler and initialize the program. Here is the logic we use for that.
//+------------------------------------------------------------------+
//| Custom indicator initialization function                         |
//+------------------------------------------------------------------+
int OnInit() {
// Set chart properties
   currentChartWidth = (int)ChartGetInteger(0, CHART_WIDTH_IN_PIXELS);      //--- Get chart width
   currentChartHeight = (int)ChartGetInteger(0, CHART_HEIGHT_IN_PIXELS);    //--- Get chart height
   currentChartScale = (int)ChartGetInteger(0, CHART_SCALE);                //--- Get chart scale
   firstVisibleBarIndex = (int)ChartGetInteger(0, CHART_FIRST_VISIBLE_BAR); //--- Get first visible bar
   visibleBarsCount = (int)ChartGetInteger(0, CHART_VISIBLE_BARS);          //--- Get visible bars
   minPrice = ChartGetDouble(0, CHART_PRICE_MIN, 0);                        //--- Get min price
   maxPrice = ChartGetDouble(0, CHART_PRICE_MAX, 0);                        //--- Get max price

// Indicator buffers
   SetIndexBuffer(0,slowLineUpBuffer,INDICATOR_DATA);             //--- Set slow up buffer
   SetIndexBuffer(1,slowLineDownBuffer,INDICATOR_DATA);           //--- Set slow down buffer
   SetIndexBuffer(2,fastLineBuffer,INDICATOR_DATA);               //--- Set fast buffer
   SetIndexBuffer(3,fastLineColorBuffer,INDICATOR_COLOR_INDEX);   //--- Set fast color buffer
   SetIndexBuffer(4,trendArrowBuffer,INDICATOR_DATA);             //--- Set arrow buffer
   SetIndexBuffer(5,trendArrowColorBuffer,INDICATOR_COLOR_INDEX); //--- Set arrow color buffer
   SetIndexBuffer(6,trendBuffer,INDICATOR_CALCULATIONS);          //--- Set trend buffer
   SetIndexBuffer(7,slowLineBuffer,INDICATOR_CALCULATIONS);       //--- Set slow buffer

// Plot settings
   PlotIndexSetInteger(0,PLOT_DRAW_BEGIN,slowPeriod);             //--- Set slow draw begin
   PlotIndexSetInteger(1,PLOT_DRAW_BEGIN,slowPeriod);             //--- Set slow draw begin
   PlotIndexSetInteger(2,PLOT_DRAW_BEGIN,fastPeriod);             //--- Set fast draw begin
   PlotIndexSetInteger(3,PLOT_DRAW_BEGIN,fastPeriod);             //--- Set fast draw begin
   PlotIndexSetInteger(4,PLOT_DRAW_BEGIN,slowPeriod);             //--- Set arrow draw begin
   PlotIndexSetInteger(3,PLOT_ARROW,arrowCode);                   //--- Set arrow code

// Line extensions
   PlotIndexSetInteger(0,PLOT_SHIFT,extendBars);                  //--- Set slow up shift
   PlotIndexSetInteger(1,PLOT_SHIFT,extendBars);                  //--- Set slow down shift
   PlotIndexSetInteger(2,PLOT_SHIFT,extendBars);                  //--- Set fast shift
   PlotIndexSetInteger(3,PLOT_SHIFT,0);                           //--- Set arrow shift

// Set plot colors dynamically
   PlotIndexSetInteger(0, PLOT_LINE_COLOR, 0, upColor);           //--- Set slow up color
   PlotIndexSetInteger(1, PLOT_LINE_COLOR, 0, downColor);         //--- Set slow down color
   PlotIndexSetInteger(2, PLOT_LINE_COLOR, 0, upColor);           //--- Set fast up color
   PlotIndexSetInteger(2, PLOT_LINE_COLOR, 1, downColor);         //--- Set fast down color
   PlotIndexSetInteger(4, PLOT_LINE_COLOR, 0, upColor);           //--- Set arrow up color
   PlotIndexSetInteger(4, PLOT_LINE_COLOR, 1, downColor);         //--- Set arrow down color

// Short name
   string shortName = "PTD(" + IntegerToString(fastPeriod) + "," + IntegerToString(slowPeriod) + ")"; //--- Set short name
   IndicatorSetString(INDICATOR_SHORTNAME, shortName);            //--- Set indicator short name

   return(INIT_SUCCEEDED);                                        //--- Return success
}
In the OnInit event handler, which executes when the indicator is attached to the chart or reloaded, we first retrieve and store current chart dimensions and view parameters as we will need them in canvas rendering later: we get the width in pixels with ChartGetInteger using CHART_WIDTH_IN_PIXELS into "currentChartWidth", height with CHART_HEIGHT_IN_PIXELS into "currentChartHeight", scale with CHART_SCALE into "currentChartScale", first visible bar with CHART_FIRST_VISIBLE_BAR into "firstVisibleBarIndex", visible bars count with CHART_VISIBLE_BARS into "visibleBarsCount", minimum price with ChartGetDouble and "CHART_PRICE_MIN" into "minPrice", and maximum with CHART_PRICE_MAX into "maxPrice". These values will enable adaptive drawing based on the current view.
We then map the eight buffers to plots: we assign "slowLineUpBuffer" to index 0 as data, "slowLineDownBuffer" to 1 as data, "fastLineBuffer" to 2 as data, "fastLineColorBuffer" to 3 as color index, "trendArrowBuffer" to 4 as data, "trendArrowColorBuffer" to 5 as color index, "trendBuffer" to 6 as calculations, "slowLineBuffer" to 7 as calculations, using SetIndexBuffer with appropriate types. We configure plot drawing starts with PlotIndexSetInteger and PLOT_DRAW_BEGIN: slow plots from "slowPeriod", fast and arrow from "fastPeriod" or "slowPeriod". We set the arrow plot's symbol with PLOT_ARROW to "arrowCode". For extensions, we apply shifts with "PLOT_SHIFT": extendBars for slow up/down and fast, 0 for arrows. We dynamically set plot colors using "PlotIndexSetInteger" and "PLOT_LINE_COLOR": index 0 to "upColor", 1 to "downColor", fast line index 2 with "upColor" at 0 and "downColor" at 1, arrows index 4 similarly. We create a short name string as "PTD(" plus fast and slow periods separated by a comma plus ")", set it with IndicatorSetString and INDICATOR_SHORTNAME. We return INIT_SUCCEEDED to confirm successful initialization. Upon compilation, we get the following outcome.

From the image, we can see that we set the indicator on load accurately. We can see the buffers in the data window, and what we need to do now is fill in them and the indicator calculations to get the indicator values using our strategy. We will do that in the OnCalculate event handler as follows.
//+------------------------------------------------------------------+
//| Custom indicator iteration function                              |
//+------------------------------------------------------------------+
int OnCalculate(const int rates_total,
                const int prev_calculated,
                const datetime& time[],
                const double& open[],
                const double& high[],
                const double& low[],
                const double& close[],
                const long& tick_volume[],
                const long& volume[],
                const int& spread[]) {
// Always calculate buffers
   int startBar = prev_calculated - 1;                            //--- Set start bar
   if(startBar < 0) startBar = 0;                                 //--- Adjust start bar
   for(int barIndex = startBar; barIndex < rates_total && !_StopFlag; barIndex++) {
      int fastStartBar = barIndex - fastPeriod + 1;               //--- Calc fast start
      if(fastStartBar < 0) fastStartBar = 0;                      //--- Adjust fast start
      int slowStartBar = barIndex - slowPeriod + 1;               //--- Calc slow start
      if(slowStartBar < 0) slowStartBar = 0;                      //--- Adjust slow start
      double slowHigh = high[ArrayMaximum(high, slowStartBar, slowPeriod)]; //--- Get slow high
      double slowLow = low[ArrayMinimum(low, slowStartBar, slowPeriod)];    //--- Get slow low
      double fastHigh = high[ArrayMaximum(high, fastStartBar, fastPeriod)]; //--- Get fast high
      double fastLow = low[ArrayMinimum(low, fastStartBar, fastPeriod)];    //--- Get fast low
      if(barIndex > 0) {
         slowLineBuffer[barIndex] = (close[barIndex] > slowLineBuffer[barIndex-1]) ? slowLow : slowHigh; //--- Set slow line
         fastLineBuffer[barIndex] = (close[barIndex] > fastLineBuffer[barIndex-1]) ? fastLow : fastHigh; //--- Set fast line
         trendBuffer[barIndex] = trendBuffer[barIndex-1];          //--- Set trend
         if(close[barIndex] < slowLineBuffer[barIndex] && close[barIndex] < fastLineBuffer[barIndex]) trendBuffer[barIndex] = 1; //--- Set up trend
         if(close[barIndex] > slowLineBuffer[barIndex] && close[barIndex] > fastLineBuffer[barIndex]) trendBuffer[barIndex] = 0; //--- Set down trend
         trendArrowBuffer[barIndex] = (trendBuffer[barIndex] != trendBuffer[barIndex-1]) ? slowLineBuffer[barIndex] : EMPTY_VALUE; //--- Set arrow
         slowLineUpBuffer[barIndex] = (trendBuffer[barIndex] == 0) ? slowLineBuffer[barIndex] : EMPTY_VALUE; //--- Set slow up
         slowLineDownBuffer[barIndex] = (trendBuffer[barIndex] == 1) ? slowLineBuffer[barIndex] : EMPTY_VALUE; //--- Set slow down
      } else {
         trendArrowBuffer[barIndex] = slowLineUpBuffer[barIndex] = slowLineDownBuffer[barIndex] = EMPTY_VALUE; //--- Set empties
         trendBuffer[barIndex] = fastLineColorBuffer[barIndex] = trendArrowColorBuffer[barIndex] = 0; //--- Set zeros
         fastLineBuffer[barIndex] = slowLineBuffer[barIndex] = close[barIndex]; //--- Set first lines
      }
      fastLineColorBuffer[barIndex] = trendArrowColorBuffer[barIndex] = trendBuffer[barIndex]; //--- Set colors
   }

   return(rates_total);                                           //--- Return total rates
}
Here, in the OnCalculate event handler, which is the core iteration handler called on each new tick or bar to update the indicator buffers with fresh price data, ensuring the plots reflect current market conditions, we determine the starting bar for calculations as "prev_calculated - 1", adjusting to 0 if negative to avoid invalid indices. We then loop from "startBar" to "rates_total - 1" while not stopped: for each "barIndex", we calculate the start for fast period as "barIndex - fastPeriod + 1" (clamp to 0), slow as "barIndex - slowPeriod + 1" (clamp to 0). We find the slow high as the maximum high over slow period with ArrayMaximum on high array from "slowStartBar", slow low as minimum low with ArrayMinimum, fast high as max high over fast period, fast low as min low.
For "barIndex > 0", we set "slowLineBuffer[barIndex]" to slow low if close above prior slow line (up pivot) else slow high (down); "fastLineBuffer[barIndex]" to fast low if close above prior fast else fast high. We copy the prior trend into "trendBuffer[barIndex]", then update to 1 (up) if close below both current slow and fast lines, or 0 (down) if above both. We place an arrow in "trendArrowBuffer[barIndex]" at slow line value if trend changed from prior, else empty. We set "slowLineUpBuffer[barIndex]" to slow line if trend 0 else empty, "slowLineDownBuffer[barIndex]" to slow line if trend 1 else empty. For the first bar ("barIndex == 0"), we set arrows and slow up/down to empty, trend/fast color/arrow color to 0, fast/slow lines to close[0] for initialization. We assign "fastLineColorBuffer[barIndex]" and "trendArrowColorBuffer[barIndex]" to the trend value for color indexing. We return "rates_total" to indicate all bars processed. Now, upon compilation, we get the following outcome.

From the image, we can see the indicator is calculated perfectly and visualized onthe chart and buffer arrays filled with data values. What remains is adding prices to the right of the indicator lines so we can know the exact line prices for information. That is easy. We will house the logic in a function for modularity.
//+------------------------------------------------------------------+
//| Draw right price extension line/label                            |
//+------------------------------------------------------------------+
bool drawRightPrice(string objectName, datetime lineTime, double linePrice, color lineColor, ENUM_LINE_STYLE lineStyle = STYLE_SOLID) {
   bool objectExists = (ObjectFind(0, objectName) >= 0);          //--- Check exists
   if(!objectExists) {
      if(!ObjectCreate(0, objectName, OBJ_ARROW_RIGHT_PRICE, 0, lineTime, linePrice)) {
         Print("Failed to create ", objectName);                  //--- Log failure
         return false;                                            //--- Return failure
      }
   } else {
      ObjectSetInteger(0, objectName, OBJPROP_TIME, 0, lineTime);  //--- Set time
      ObjectSetDouble(0, objectName, OBJPROP_PRICE, 0, linePrice); //--- Set price
   }
   long currentScale = ChartGetInteger(0, CHART_SCALE);           //--- Get scale
   int lineWidth = 1;                                             //--- Init width
   if(currentScale <= 1) lineWidth = 1;                           //--- Set width small
   else if(currentScale <= 3) lineWidth = 2;                      //--- Set width medium
   else lineWidth = 3;                                            //--- Set width large
   ObjectSetInteger(0, objectName, OBJPROP_COLOR, lineColor);     //--- Set color
   ObjectSetInteger(0, objectName, OBJPROP_WIDTH, lineWidth);     //--- Set width
   ObjectSetInteger(0, objectName, OBJPROP_STYLE, lineStyle);     //--- Set style
   ObjectSetInteger(0, objectName, OBJPROP_BACK, false);          //--- Set foreground
   ObjectSetInteger(0, objectName, OBJPROP_SELECTABLE, false);    //--- Set not selectable
   ObjectSetInteger(0, objectName, OBJPROP_SELECTED, false);      //--- Set not selected
   ChartRedraw(0);                                                //--- Redraw chart
   return true;                                                   //--- Return success
}


// we then call this function in the "OnCalculate" event handler

// Draw line extensions if enabled
   if(showExtensions && rates_total > 0) {
      int latestBarIndex = rates_total - 1;                       //--- Get latest index
      double slowLineValue = slowLineBuffer[latestBarIndex];      //--- Get slow value
      double fastLineValue = fastLineBuffer[latestBarIndex];      //--- Get fast value
      double currentTrend = trendBuffer[latestBarIndex];          //--- Get trend
      color lineColor = (currentTrend == 0.0) ? upColor : downColor; //--- Set line color
      datetime currentBarTime = iTime(_Symbol, _Period, 0);       //--- Get current time
      long timeOffset = (long)extendBars * PeriodSeconds(_Period); //--- Calc offset
      datetime extensionTime = currentBarTime + (datetime)timeOffset; //--- Calc extension time
      drawRightPrice(objectPrefix + "SLOW", extensionTime, slowLineValue, lineColor, STYLE_SOLID); //--- Draw slow extension
      drawRightPrice(objectPrefix + "FAST", extensionTime, fastLineValue, lineColor, STYLE_DOT); //--- Draw fast extension
   }
For the right price rendering logic, we define the "drawRightPrice" function to create or update a right price arrow object that extends indicator lines horizontally to the right, providing visual protrusion for future bars based on input settings. We first check if the object exists with ObjectFind — if not, we create an OBJ_ARROW_RIGHT_PRICE at the given "lineTime" and "linePrice" using ObjectCreate, logging failure and returning false if unsuccessful. If it exists, we update its time and price anchors with ObjectSetInteger for OBJPROP_TIME and ObjectSetDouble for "OBJPROP_PRICE". We retrieve the current chart scale with ChartGetInteger and CHART_SCALE into "currentScale", then set "lineWidth" based on scale: 1 for scale <=1, 2 for <=3, 3 for larger, to ensure visibility at different zooms.
We configure the object: set color with OBJPROP_COLOR to "lineColor", width to "lineWidth", style to "lineStyle" (default solid), foreground with "OBJPROP_BACK" false, not selectable or selected with "OBJPROP_SELECTABLE" and "OBJPROP_SELECTED" false. We redraw the chart with ChartRedraw and return true on success. We call this function in the OnCalculate event handler if "showExtensions" is true and bars exist: we get the latest index as "rates_total - 1", fetch slow and fast values from buffers, trend from "trendBuffer", choose "lineColor" as "upColor" if trend 0.0 else "downColor", get current bar time with iTime at shift 0, calculate offset as "extendBars * PeriodSeconds(_Period)", extension time as current plus offset, then invoke "drawRightPrice" for slow with solid style and fast with dot, using "objectPrefix + "SLOW"" or "FAST". When we compile, we get the following outcome.

With the right price rendered, we are now all complete with the main indicator. What remains is rendering the canvas to fill the indicator boundaries as we wanted, and that will be all. We will define some helper functions for that.
//+------------------------------------------------------------------+
//| Convert chart scale to bar width                                 |
//+------------------------------------------------------------------+
int BarWidth(int chartScale) {
   return (int)MathPow(2.0, chartScale);                          //--- Return bar width
}

//+------------------------------------------------------------------+
//| Convert bar shift to x pixel                                     |
//+------------------------------------------------------------------+
int ShiftToX(int barShift) {
   return (int)((firstVisibleBarIndex - barShift) * BarWidth(currentChartScale) - 1); //--- Return x pixel
}

//+------------------------------------------------------------------+
//| Convert price to y pixel                                         |
//+------------------------------------------------------------------+
int PriceToY(double price) {
   if(maxPrice - minPrice == 0.0) return 0;                      //--- Return zero if no range
   return (int)MathRound(currentChartHeight * (maxPrice - price) / (maxPrice - minPrice) - 1); //--- Return y pixel
}
First, we define the "BarWidth" function to calculate the pixel width of each bar based on the current chart scale, returning an integer from "MathPow(2.0, chartScale)" — this provides an exponential estimate (1 at scale 0, 2 at 1, 4 at 2, etc.) for positioning in canvas coordinates. Then, we implement the "ShiftToX" function to convert a bar shift (relative to the leftmost visible bar) to an x-pixel position on the chart, computing "(firstVisibleBarIndex - barShift) * BarWidth(currentChartScale) - 1" cast to int — this positions elements from right (recent) to left (older), adjusted by 1 for alignment. Finally, we create the "PriceToY" function to map a price value to a y-pixel coordinate on the canvas, returning 0 if no price range ("maxPrice - minPrice == 0.0"), else rounding "currentChartHeight * (maxPrice - price) / (maxPrice - minPrice) - 1" with MathRound cast to int — this inverts the y-axis (higher prices at top) and adjusts by 1 for precise drawing. We will now use these functions to create the main function to do the heavy lifting.
//+-----------------------------------------------------------------------------------------+
//| Fill area between two lines using trend for color with gradient alpha from slow to fast |
//+-----------------------------------------------------------------------------------------+
void DrawFilling(const double &slowLineValues[], const double &fastLineValues[], const double &trendValues[], color fillUpColor, color fillDownColor, uchar fillAlpha = 255, int extendShift = 0) {
   int firstVisibleBar = firstVisibleBarIndex;                    //--- Get first visible
   int totalBarsToDraw = visibleBarsCount + extendShift;          //--- Calc bars to draw
   int bufferSize = (int)ArraySize(slowLineValues);               //--- Get buffer size
   if(bufferSize == 0 || bufferSize != ArraySize(fastLineValues) || bufferSize != ArraySize(trendValues)) return; //--- Return if invalid
   int previousX = -1;                                            //--- Init previous X
   int previousY1 = -1;                                           //--- Init previous Y1
   int previousY2 = -1;                                           //--- Init previous Y2
   for(int offset = 0; offset < totalBarsToDraw; offset++) {
      int barPosition = firstVisibleBar - offset;                 //--- Calc bar position
      int x = ShiftToX(barPosition);                              //--- Calc x
      if(x >= currentChartWidth) break;                           //--- Break if beyond width
      int dataBarShift = firstVisibleBar - offset + extendShift;  //--- Calc data shift
      int bufferBarIndex = bufferSize - 1 - dataBarShift;         //--- Calc buffer index
      if(bufferBarIndex < 0 || bufferBarIndex >= bufferSize) {
         previousX = -1;                                          //--- Reset previous X
         continue;                                                //--- Continue
      }
      double value1 = slowLineValues[bufferBarIndex];             //--- Get value1
      double value2 = fastLineValues[bufferBarIndex];             //--- Get value2
      if(value1 == EMPTY_VALUE || value2 == EMPTY_VALUE) {
         previousX = -1;                                          //--- Reset previous X
         continue;                                                //--- Continue
      }
      int y1 = PriceToY(value1);                                  //--- Calc y1
      int y2 = PriceToY(value2);                                  //--- Calc y2
      double currentTrend = trendValues[bufferBarIndex];          //--- Get trend
      uint baseColorRGB = (currentTrend == 0.0) ? (ColorToARGB(fillUpColor, 255) & 0x00FFFFFF) : (ColorToARGB(fillDownColor, 255) & 0x00FFFFFF); //--- Set base RGB
      if(previousX != -1 && x > previousX) {
         double deltaX = x - previousX;                           //--- Calc delta X
         int endColumn = MathMin(x, currentChartWidth - 1);       //--- Calc end column
         double maxT = (double)(endColumn - previousX) / deltaX;  //--- Calc max T
         for(int column = previousX; column <= endColumn; column++) {
            double t = (column - previousX) / deltaX;             //--- Calc t
            double interpolatedY1 = previousY1 + t * (y1 - previousY1); //--- Interpolate Y1
            double interpolatedY2 = previousY2 + t * (y2 - previousY2); //--- Interpolate Y2
            int upperY = (int)MathRound(MathMin(interpolatedY1, interpolatedY2)); //--- Calc upper Y
            int lowerY = (int)MathRound(MathMax(interpolatedY1, interpolatedY2)); //--- Calc lower Y
            if(upperY > lowerY) continue;                        //--- Continue if invalid
            double slowLineY = interpolatedY1;                    //--- Set slow Y
            double height = MathAbs(interpolatedY1 - interpolatedY2); //--- Calc height
            if(height == 0.0) continue;                          //--- Continue if no height
            // Fill per row with gradient from slow (opaque) to fast (transparent)
            for(int row = upperY; row <= lowerY; row++) {
               double distanceFromSlow = MathAbs(row - slowLineY); //--- Calc distance
               double gradientFraction = distanceFromSlow / height; //--- Calc fraction
               uchar alphaValue = (uchar)(fillAlpha * (1.0 - gradientFraction)); //--- Calc alpha
               if(alphaValue > fillAlpha) alphaValue = fillAlpha; //--- Cap alpha
               uint pixelColor = ((uint)alphaValue << 24) | baseColorRGB; //--- Set pixel color
               obj_Canvas.FillRectangle(column, row, column, row, pixelColor); //--- Fill pixel
            }
         }
      }
      previousX = x;                                              //--- Update previous X
      previousY1 = y1;                                            //--- Update previous Y1
      previousY2 = y2;                                            //--- Update previous Y2
   }
}

//+------------------------------------------------------------------+
//| Redraw the canvas                                                |
//+------------------------------------------------------------------+
void Redraw(void) {
   if(currentChartWidth <= 0 || currentChartHeight <= 0) return;  //--- Return if invalid size
   uint defaultColor = 0;                                         //--- Default color
   obj_Canvas.Erase(defaultColor);                                //--- Erase canvas
   DrawFilling(slowLineBuffer, fastLineBuffer, trendBuffer, upColor, downColor, (uchar)fillOpacity, extendBars); //--- Draw filling
   obj_Canvas.Update();                                           //--- Update canvas
}
We define the "DrawFilling" function to render the area between the slow and fast lines on the canvas with a gradient fill, using the trend to select up or down colors and fading opacity from the slow line (full "fillAlpha") to the fast line (transparent), creating a smooth visual taper while extending by "extendShift" bars if enabled. We first get the first visible bar and calculate "totalBarsToDraw" as visible count plus "extendShift", fetch buffer size from "slowLineValues", and return early if invalid or mismatched with fast/trend buffers. We initialize previous X/Y1/Y2 to -1 for interpolation tracking, then loop over offsets from 0 to "totalBarsToDraw - 1": for each, we compute the bar position as "firstVisibleBar - offset", x pixel with "ShiftToX", breaking if beyond chart width; data shift as visible bar minus offset plus "extendShift", buffer index as size minus 1 minus data shift — skipping if out of bounds or values empty, resetting previous X.
Then, we get slow value1 and fast value2 from buffers, convert to y1/y2 with "PriceToY", determine trend from "trendValues", and set base RGB from "fillUpColor" or "fillDownColor" using ColorToARGB masked to RGB. If previous X is valid and current X> previous, we interpolate: calculate delta X, end column as min of X and width minus 1, max t as (end - previous) / delta. For each column from previous to end, we compute t as (column - previous) / delta, interpolate y1 and y2, round min/max to upper/lower Y — skipping if upper > lower. We set "slowLineY" to interpolated y1, height as abs y1 minus y2 — skipping if zero. For each row from upper to lower, we calculate distance from slow, fraction as distance / height, alpha as "fillAlpha * (1.0 - fraction)" cast to uchar, cap at "fillAlpha", combine pixel color as alpha shifted 24 bits or-ed with base RGB, and fill a single pixel at column/row with "obj_Canvas.FillRectangle" (1x1). We update previous X to current X, Y1 to Y1, and Y2 to Y2 for the next iteration.
We implement the "Redraw" function to refresh the canvas drawing when needed, returning early if the width or height is invalid (<=0). We set the default color to 0 (transparent), erase the canvas with "obj_Canvas.Erase", call "DrawFilling" passing slow/fast/trend buffers, up/down colors, "fillOpacity" cast to uchar, and "extendBars", then update the canvas display with "obj_Canvas.Update". This is the function that we will call when we want to fill the indicator boundaries, as shown below in the calculation event handler.
if(!enableFilling) return(rates_total);                       //--- Return if no filling

// Canvas logic only if enabled
bool isNewBar = (rates_total > prev_calculated);               //--- Check new bar
bool hasTrendChanged = false;                                  //--- Init trend changed
if(rates_total > 0 && trendBuffer[rates_total-1] != previousTrend) {
   hasTrendChanged = true;                                     //--- Set changed
   previousTrend = trendBuffer[rates_total-1];                 //--- Update previous trend
}

// Update chart properties (only if changed)
bool hasChartChanged = false;                                  //--- Init chart changed
int newChartWidth = (int)ChartGetInteger(0, CHART_WIDTH_IN_PIXELS); //--- Get new width
int newChartHeight = (int)ChartGetInteger(0, CHART_HEIGHT_IN_PIXELS); //--- Get new height
int newChartScale = (int)ChartGetInteger(0, CHART_SCALE);     //--- Get new scale
int newFirstVisibleBar = (int)ChartGetInteger(0, CHART_FIRST_VISIBLE_BAR); //--- Get new first visible
int newVisibleBars = (int)ChartGetInteger(0, CHART_VISIBLE_BARS); //--- Get new visible bars
double newMinPrice = ChartGetDouble(0, CHART_PRICE_MIN, 0);    //--- Get new min price
double newMaxPrice = ChartGetDouble(0, CHART_PRICE_MAX, 0);    //--- Get new max price
if(newChartWidth != currentChartWidth || newChartHeight != currentChartHeight) {
   obj_Canvas.Resize(newChartWidth, newChartHeight);               //--- Resize canvas
   currentChartWidth = newChartWidth;                          //--- Update width
   currentChartHeight = newChartHeight;                        //--- Update height
   hasChartChanged = true;                                     //--- Set changed
}
if(newChartScale != currentChartScale || newFirstVisibleBar != firstVisibleBarIndex || newVisibleBars != visibleBarsCount ||
      newMinPrice != minPrice || newMaxPrice != maxPrice) {
   currentChartScale = newChartScale;                          //--- Update scale
   firstVisibleBarIndex = newFirstVisibleBar;                  //--- Update first visible
   visibleBarsCount = newVisibleBars;                          //--- Update visible bars
   minPrice = newMinPrice;                                     //--- Update min price
   maxPrice = newMaxPrice;                                     //--- Update max price
   hasChartChanged = true;                                     //--- Set changed
}

// Redraw only on: new bar, trend change, or chart resize/scroll. Debounce to 1x/sec max.
datetime currentTime = TimeCurrent();                          //--- Get current time
if((isNewBar || hasTrendChanged || hasChartChanged) && (currentTime - lastRedrawTime >= 1)) {
   Redraw();                                                   //--- Redraw canvas
   lastRedrawTime = currentTime;                               //--- Update last redraw
}
Here, we return "rates_total" early if "enableFilling" is false, skipping canvas logic to improve performance when filling is disabled. We then handle canvas-specific operations only if filling is enabled: we check for a new bar with "rates_total > prev_calculated" into "isNewBar", detect trend changes by comparing "trendBuffer[rates_total-1]" to "previousTrend" if bars exist, setting "hasTrendChanged" true, and updating "previousTrend" if different. We monitor for chart changes: initialize "hasChartChanged" to false, fetch new width/height/scale/first visible/visible bars/min price/max price with the ChartGetInteger and ChartGetDouble functions. If width or height differs, we resize the canvas with "obj_Canvas.Resize" to new dimensions, update "currentChartWidth" and "currentChartHeight", and set "hasChartChanged" to true. If scale, first visible, visible count, min or max price changed, we update the globals accordingly and set "hasChartChanged" true.
Finally, we optimize redraws: get current time with TimeCurrent into "currentTime", and if new bar, trend changed, or chart changed, and at least 1 second since "lastRedrawTime", we call "Redraw" to refresh the canvas, update "lastRedrawTime" to current time. This debounces to at most once per second, reducing unnecessary computations. Now we just need to re-render the changes when the chart events are detected and delete them on de-initialization, as below.
//+------------------------------------------------------------------+
//| Chart event handler                                              |
//+------------------------------------------------------------------+
void OnChartEvent(const int id, const long& lparam, const double& dparam, const string& sparam) {
   if(id != CHARTEVENT_CHART_CHANGE || !enableFilling) return;
   int newChartWidth = (int)ChartGetInteger(0, CHART_WIDTH_IN_PIXELS); //--- Get new width
   int newChartHeight = (int)ChartGetInteger(0, CHART_HEIGHT_IN_PIXELS); //--- Get new height
   if(newChartWidth != currentChartWidth || newChartHeight != currentChartHeight) {
      obj_Canvas.Resize(newChartWidth, newChartHeight);               //--- Resize canvas
      currentChartWidth = newChartWidth;                          //--- Update width
      currentChartHeight = newChartHeight;                        //--- Update height
      Redraw();                                                   //--- Redraw canvas
      return;                                                     //--- Return
   }
   int newChartScale = (int)ChartGetInteger(0, CHART_SCALE);      //--- Get new scale
   int newFirstVisibleBar = (int)ChartGetInteger(0, CHART_FIRST_VISIBLE_BAR); //--- Get new first visible
   int newVisibleBars = (int)ChartGetInteger(0, CHART_VISIBLE_BARS); //--- Get new visible bars
   double newMinPrice = ChartGetDouble(0, CHART_PRICE_MIN, 0);    //--- Get new min price
   double newMaxPrice = ChartGetDouble(0, CHART_PRICE_MAX, 0);    //--- Get new max price
   if(newChartScale != currentChartScale || newFirstVisibleBar != firstVisibleBarIndex || newVisibleBars != visibleBarsCount ||
         newMinPrice != minPrice || newMaxPrice != maxPrice) {
      currentChartScale = newChartScale;                          //--- Update scale
      firstVisibleBarIndex = newFirstVisibleBar;                  //--- Update first visible
      visibleBarsCount = newVisibleBars;                          //--- Update visible bars
      minPrice = newMinPrice;                                     //--- Update min price
      maxPrice = newMaxPrice;                                     //--- Update max price
      Redraw();                                                   //--- Redraw canvas
   }
}

//+------------------------------------------------------------------+
//| Custom indicator deinitialization function                       |
//+------------------------------------------------------------------+
void OnDeinit(const int reason) {
   if(enableFilling) obj_Canvas.Destroy();                            //--- Destroy canvas if enabled
   ObjectsDeleteAll(0,objectPrefix,0,OBJ_ARROW_RIGHT_PRICE);      //--- Delete right price arrows
   ChartRedraw(0);                                                //--- Redraw chart
}
Here, we call the OnChartEvent event handler to handle chart-related events, specifically responding to changes only if filling is enabled with "enableFilling" true; otherwise, we return early. We first fetch the new chart width and height with ChartGetInteger using CHART_WIDTH_IN_PIXELS and CHART_HEIGHT_IN_PIXELS. If either differs from "currentChartWidth" or "currentChartHeight", we resize the canvas to the new dimensions with "obj_Canvas.Resize", update the globals, call "Redraw" to refresh the fill, and return. We then get the new scale with CHART_SCALE, first visible bar with "CHART_FIRST_VISIBLE_BAR", visible bars with "CHART_VISIBLE_BARS", min price with ChartGetDouble and "CHART_PRICE_MIN", max with CHART_PRICE_MAX. If any of scale, first visible, visible count, min or max price changed from stored globals, we update "currentChartScale", "firstVisibleBarIndex", "visibleBarsCount", "minPrice", "maxPrice", and call "Redraw" to adapt the canvas fill to the new view.
In the OnDeinit event handler, which runs when the indicator is removed, or the terminal closes, to clean up resources: if "enableFilling" is true, we destroy the canvas with "obj_Canvas. Destroy"; we delete all right price arrow objects starting with "objectPrefix" using ObjectsDeleteAll specifying chart 0, window 0, type OBJ_ARROW_RIGHT_PRICE; then redraw the chart with the ChartRedraw function. Upon compilation, we get the following outcome.

From the visualization, we can see that we calculate the indicator and fill the canvas when allowed, hence achieving our objectives. The thing that remains is backtesting the program, and that is handled in the next section.
Backtesting
We did the testing, and below is the compiled visualization in a single Graphics Interchange Format (GIF) bitmap image format.

Conclusion
In conclusion, we’ve created a Pivot-Based Trend Indicator in MQL5 that computes fast and slow pivot lines from high/low ranges, identifies trend directions with color-coded lines and arrows, optionally extends lines for projections, and fills areas with gradient canvas for visual depth, all while optimizing redraws on new bars or chart changes. This indicator provides a flexible tool for trend detection, with customizable inputs. In upcoming parts, we will explore advanced indicators like volatility channels or momentum oscillators with machine learning elements. Stay tuned.
Warning: All rights to these materials are reserved by MetaQuotes Ltd. Copying or reprinting of these materials in whole or in part is prohibited.
This article was written by a user of the site and reflects their personal views. MetaQuotes Ltd is not responsible for the accuracy of the information presented, nor for any consequences resulting from the use of the solutions, strategies or recommendations described.

- Free trading apps
- Over 8,000 signals for copying
- Economic news for exploring financial markets
You agree to website policy and terms of use