 MetaTrader 5
 Uzmanlar
 Göstergeler
 Kütüphaneler
 Yardımcı programlar
 Widget'lar
 Kurallar
YouTube'dan Mağaza ile ilgili öğretici videoları izleyin
Bir alım-satım robotu veya gösterge nasıl satın alınır?
Uzman Danışmanınızı
sanal sunucuda çalıştırın
sanal sunucuda çalıştırın
Satın almadan önce göstergeyi/alım-satım robotunu test edin
Mağazada kazanç sağlamak ister misiniz?
Satış için bir ürün nasıl sunulur?
MetaTrader 5 için ücretli Teknik Göstergeler - 89
 Teknik göstergelerden gelen sinyaller, borsa ve Forex piyasalarında işlemler açılması ve kapatılmasında çok önemli bir rol oynar. Göstergeler, fiyat değişikliklerini tahmin etmeyi amaçlayan, finansal sembol fiyatının matematiksel dönüşümüdür.
Piyasa davranışını daha iyi tahmin etmek ve bundan kar elde etmek için teknik göstergeleri test edin.

Description — DS Weekly Percent The DS Weekly Percent indicator is designed to track the weekly performance of an asset, using the weekly opening price as its reference point. It automatically draws a percentage grid above and below the weekly open, creating levels that represent price variations in configurable increments (for example, ±1%, ±2%, ±3%, etc.). These levels help traders identify reaction zones and equilibrium areas in the market throughout the week. Main Features: Clear visua

Gold Flow Master — Institutional Flow Analyzer for XAUUSD Gold Flow Master reveals the hidden structure behind gold price movements by mapping institutional footprints such as Order Blocks, Fair Value Gaps, Liquidity levels, Support/Resistance, Kill Zones, and Fibonacci pockets.
It then scores the current price context to highlight the highest-probability trading zones based on real institutional behavior. Main Features Automatic Detection Bullish and Bearish Order Blocks Fair Value Gaps (FVG) L

Institutional Liquidity Map Pro is a professional MetaTrader 5 indicator designed to map institutional liquidity zones using monthly highs and lows. It automatically detects stop-hunt areas, potential reversal zones, and institutional accumulation/distribution levels. The indicator dynamically tracks up to three liquidity levels on both buy and sell sides, updated in real time. Key Features: Automatic detection of monthly high/low levels Real-time institutional liquidity zones (buy/sell) Dynamic
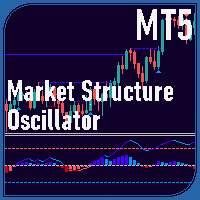
Market Structure Oscillator Overview The Market Structure Oscillator is a technical indicator designed for MetaTrader platforms to analyze market trends across multiple timeframes. It provides a clear visualization of short-term, intermediate-term, and long-term market structures through an oscillator and histogram display in a separate window. The indicator also supports optional chart objects to highlight key market structure points. Features Displays a composite oscillator combining short-ter

DailyPOC 4X — See the Market Like Never Before! If you’re tired of trading in the dark, DailyPOC 4X is designed to change the way you read price action.
This indicator highlights the most important decision zones of institutional traders, including: Daily POC (Point of Control) — the true “magnet” of price, where the highest trading volume of the day occurs. Value Area High and Low (VAH / VAL) — key regions defining the balance between buyers and sellers. Previous Days’ POCs — track how price r
Simple Smart Signal, trend ve momentum doğrulamasını genişleme (widening) prensibine dayalı olarak yapan adaptif bir göstergedir.
İç hareketli ortalamalar arasındaki fark sinyal yönünde genişlediğinde alım veya satım sinyali üretir. Bu yaklaşım, yatay piyasa koşullarında yanlış sinyalleri azaltır ve gerçek momentum artışlarını ortaya çıkarır. Kullanıcı, sinyallerin yalnızca kapanan mumlarda hesaplanmasını seçebilir. Bu durumda sinyaller sabit kalır ve yeniden çizim olmaz. Ayrıca kaç mumun genişl
THE DAILY DECIDER BUYSELL PRO INDICATOR OVERVIEW Unlock the Market's Daily Secret: The Daily Decider BuySell Indicator is Here!
Tired of analysis paralysis? Struggling with false signals and noisy markets? What if you could know the market's primary intention within the first few hours of the day and trade with unwavering confidence?
Introducing the Daily Decider BuySell Indicator for MetaTrader 5. Pro Tip: Never Miss the first signal of the day This isn't just another indicator cluttering yo

ProxyFootprint — Genel Bakış ProxyFootprint Advanced , MetaTrader 5 için geliştirilmiş bir emir akışı görselleştirme indikatörüdür.
Farklı fiyat seviyelerinde alım ve satım baskısı hakkında bilgi sağlar. Nedir (ve ne değildir) Önemli: Bu, gerçek bir footprint grafiği değildir.
Gerçek footprint grafikleri, her fiyat seviyesindeki emir defteri verilerine (alış/satış hacimleri) erişim gerektirir ve bu veriler borsalar veya özel veri sağlayıcıları tarafından sunulur.
Bu gösterge, herkese açık tick v
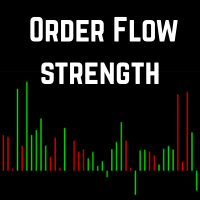
Order Flow Strength (OFS) Açıklama:
Bu gösterge, her mumun kapanış fiyatının aralıkta nerede olduğunu analiz ederek, hacim ile ağırlıklandırılmış şekilde sipariş akışının gücünü ölçer. Ayrı bir panelde alım baskısı (yeşil) ve satım baskısı (kırmızı) gösterir. Formül Order Flow Strength = Close − Low High − Low × Volume \text{Order Flow Strength} = \frac{\text{Close} - \text{Low}}{\text{High} - \text{Low}} \times \text{Volume} Order Flow Strength = High − Low Close − Low × Volume Close : mum k
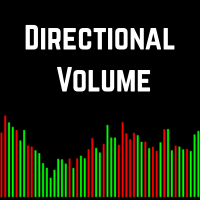
Directional Volume — Alım ve satım baskısını görselleştir Directional Volume , alıcı ve satıcı baskısını sezgisel bir biçimde ayıran hafif ama güçlü bir hacim göstergesidir.
Sadece toplam hacmi göstermek yerine, işlem hacminin ne kadarının alıcılardan, ne kadarının satıcılardan geldiğini vurgular — böylece yatırımcılar piyasa duyarlılığını ve momentumu anında değerlendirebilir. Klasik hacim göstergesinden farkı Standart hacim çubukları yalnızca her mumdaki toplam hacmi gösterirken, Directional V

Tick Speed & Volume Burst Açıklama
Gerçek zamanlı olarak anormal likidite girişlerini iki tamamlayıcı metrikle tespit eden profesyonel bir indikatör: Tick Speed (mavi): emir defterindeki olağandışı aktiviteyi gösteren tick akışının hızlanmasını ölçer. Volume Burst (kırmızı): standart sapma analiziyle istatistiksel olarak anormal hacim patlamalarını tespit eder. Araç, verileri ayarlanabilir bir dönem boyunca normalize eder ve etkinlik belirlenen sapma eşiğini aştığında uyarılar (ses / popup / e-

Piyasaları Akıllıca Takip Etmenin Yolu Big Mindset Session Finder EA ile net, doğru ve güvenli bir şekilde işlem yapın — MT5 grafiğinizde Asya, Londra ve New York oturumlarını otomatik olarak belirleyen hepsi bir arada araç. Artık oturumların yüksek ve düşük noktalarını tahmin etmenize gerek yok — bu Expert Advisor sizin için her şeyi yapar! Ana Özellikler Otomatik Oturum Tespiti
Asya, Londra ve New York oturumlarını grafik üzerinde anında renkli dikey çizgilerle vurgular ve piyasa yapı

Tepki Göstergesi – MT5 için Ekonomik Olay Piyasa Tepkisi Ölçümü Tepki Göstergesi , ekonomik takvim olaylarına piyasanın tepkisini gerçek zamanlı olarak analiz eder ve nicelendirir. Önemli ekonomik açıklamalardan 10, 30 ve 60 saniye sonra fiyat hareketini (pip cinsinden) otomatik olarak ölçer. Ana Özellikler Otomatik Olay Alımı
MT5’in yerleşik Takvim API’si ile entegrasyon, ek yapılandırma gerektirmez. Haber Sonrası Volatilite Ölçümü
Her açıklamadan sonra fiyat hareket hızını (pip/dakika) hes

Heikin Ashi RSI Indicator for MT5 (HARSI) Overview
The Heikin Ashi RSI (HARSI) indicator combines Heikin Ashi candle smoothing with RSI momentum analysis, providing a dual-layer view of price action and relative strength. It offers a clear visualization of market direction, RSI-based overbought and oversold conditions, and optional backtesting and alert systems for strategy validation and trade signal automation. How It Works
The indicator applies RSI values to Heikin Ashi calculations, creati

FiboCircles Zones — Fibonacci Circles, Fan, Zones & Time Analysis Suite An all-in-one Fibonacci indicator for MT5. It combines the most widely used Fibonacci tools into a single indicator — Circles, Fan, Zones, HLines, Time Period Wave, and Time Zones — with draggable, persistent anchor lines that remember their position permanently. No need to redraw anything every time you reopen the chart. Built for traders who rely on Fibonacci as a core tool for finding support/resistance, reversal points,

Indicator: Color MACD Description:
The Color MACD Indicator is an enhanced version of the classic MACD, designed to give traders a clearer and more intuitive visual signal of market momentum and trend changes.
Unlike the standard MACD, this version adds color-coded bars and signal lines to help you identify bullish and bearish momentum instantly — without having to interpret raw histogram data. Key Features: Color-coded histogram and signal line for quick visual analysis. Detects trend

TrapSniper Pro is a professional-grade indicator built to detect genuine price action setups while identifying potential market manipulation zones.
It combines advanced candlestick pattern recognition with smart filtering logic to highlight areas where institutional players may be trapping liquidity before major price reversals or continuations. This tool is designed for traders who rely on price action, smart money concepts, and clean chart analysis without unnecessary noise. It provides visual
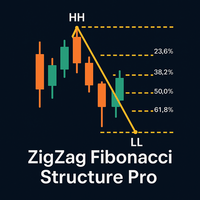
Trade smarter with ZigZag Fibonacci Structure Pro — a professional indicator that dynamically detects Higher Highs (HH), Higher Lows (HL), Lower Highs (LH), and Lower Lows (LL) in real time.
Each structural swing automatically maps a precise Fibonacci retracement , drawn only from true impulses — not minor corrections. With its elegant design, smooth visuals, and intuitive input settings, this indicator turns complex structure reading into a simple, visual process. Key features: Auto-detectio

AI SuperTrend Final – Adaptive Intelligence for Smarter Trading
The AI SuperTrend Final is not just another trend indicator—it is a next‑generation trading tool powered by adaptive intelligence. Designed for MetaTrader, this indicator combines the proven logic of SuperTrend with advanced filters such as Moving Average (MA), Average Directional Index (ADX), and a unique self‑learning mechanism. The result is a smart, evolving system that adapts to market conditions and continuously improves its
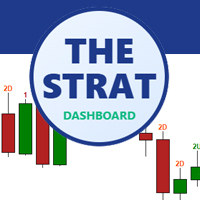
The Strat Dashboard - Rob Smith’in “The Strat” Stratejisi için Çoklu Sembol Tarayıcı Gerçek Zamanlı Çoklu Sembol Analiziyle İşlemlerinizi Dönüştürün The Strat Dashboard, Rob Smith’in ünlü “The Strat” fiyat hareketi stratejisini kullanan trader’lar için özel olarak tasarlanmış profesyonel bir göstergedir.
Birden fazla sembolü aynı anda farklı zaman dilimlerinde izleyin, yüksek olasılıklı formasyonları anında bulun ve hiçbir fırsatı kaçırmayın. MT4 Version :- https://www.mql5.com/en/market/pr
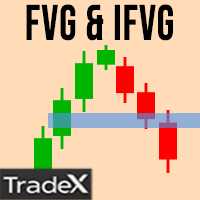
Click the link to view our products: LINK Click the link to view my best tool: LINK Description: Smart FVG & iFVG Zones Indicator MT5 accurately detects Fair Value Gaps and Inverse Fair Value Gaps based on ICT Smart Money Concepts . It automatically plots imbalance zones to reveal liquidity voids , mitigation areas , and institutional trading levels . Designed for professional traders, this tool helps you identify premium and discount zones with real-time updates. The indicator supports both bu

Symbol Changer Indicator
This is a simple yet intuitive indicator.
The indicator provide easy navigation across various symbols and across different time frames all in a chart.
The buttons are displayed on the main chart.
It is flexible and easy to use with fast response speed.
FEATURES
Use Custom Pairs : If set to true, load all the available symbols in the Market Watch. No means it loads the pairs selected below.
Pairs (Separated by Comma) : This enables selected pairs
BigMindset Liquidity & Volatility Indicator – $120 Price: $120 USD Overview:
The BigMindset Liquidity & Volatility Indicator is a powerful stand-alone tool for MetaTrader 5 that visually identifies low liquidity, high liquidity, and consolidation zones in the market. It provides traders with actionable insights to help avoid whipsaws, recognize strong momentum, and make smarter trading decisions—all without cluttering the chart. Why You Need This Indicator: Instant Market Clarity Quickly see th

Scanner Intelligence Hub - Multi-Active Monitoring 28+ Pairs Stop jumping from one chart to another. Scanner Intelligence Hub is the ultimate command center for the professional trader. Monitor dozens of assets and multiple timeframes from a single dashboard.
Technical Capabilities:
Real-time scanning: It detects candlestick patterns, mean crossovers, and RSI levels in 28 pairs simultaneously.
Customizable Panel: Choose which indicators and timeframes you want the Scanner to monitor f

VolumeTracker 4X – High-Volume Candle & VWAP Main Description: VolumeTracker 4X automatically identifies the highest-volume candle of the day in the Forex market and calculates the volume-weighted average price (VWAP) from that candle. It draws dynamic channels based on the high and low prices from the highest-volume candle to the current candle , helping you visualize key support and resistance areas . Created for traders who want more precise decisions using real trading volume as a reference.

SmartCandle 4X – Volume-Based Candles Main Description: SmartCandle 4X automatically colors each candle based on the detected volume . Low-volume candles start with soft blue tones , progressing to white, yellow, orange, red, and purple as volume increases. This allows traders to quickly identify whether the market is calm or active , supporting more strategic decisions in Forex trading. Key Benefits: Instant visualization of market activity levels . Candles colored intuitively, from low to high
Selected Range Volume — Buyers and Sellers Balance + Volume Levels Selected Range Volume is an advanced indicator for analyzing volumes and the imbalance between buyers and sellers. It doesn't just show where the volume was—it highlights who exactly dominated: buyers or sellers, and where the market might stop in the future. You select any section of the chart, and the indicator instantly calculates the volume activity within the range, builds a volume profile by prices, and displays the balance

AMD Uyarlanabilir Hareketli Ortalama (AAMA)
AAMA, MetaTrader 4 için geliştirilmiş, piyasa koşullarına göre tepkisini otomatik olarak ayarlayan bir uyarlanabilir hareketli ortalama göstergesidir. Temel Özellikler: Kaufman Verimlilik Oranı’na dayalı uyarlanabilir hareketli ortalama – güçlü trendlerde hızlı tepki verir, yatay piyasalarda gürültüyü filtreler 4 AMD piyasa aşamasının otomatik tespiti: Birikim (Accumulation), Yükseliş (Markup), Dağıtım (Distribution), Düşüş (Markdown) ATR aracılığıyla
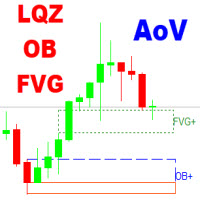
The Area of Value Detection indicator automatically identifies and highlights key institutional price zones, including Liquidity areas, Order Blocks, and Fair Value Gaps (FVG). It is designed to help traders visualize market imbalances and potential points of interest (POIs) used by smart money participants.
Main Features Liquidity Zones: Detects clusters of equal highs/lows and liquidity pools where stop orders are likely accumulated.
Order Blocks: Highlights potential bullish and bearish or
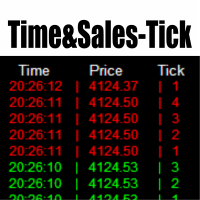
Time & Sales Tick Indicator, MetaTrader 5 için geliştirilen bir göstergedir ve gerçek zamanlı tick verilerini gösterir.
Fiyat, tick hacmi ve zamanı doğrudan grafikte görüntüler.
Özellikler Fiyat, hacim ve zaman bilgilerini içeren tick verilerini grafik üzerindeki bir panelde gösterir. Tick verilerini kullanıcı tarafından belirlenen aralıklara göre gruplandırır, yükselişler yeşil, düşüşler kırmızı renkle gösterilir. Panel, grafiğin istenilen köşesine yerleştirilebilir.

True Range Normalized Momentum ( TRNM) The TRNM is a volatility and momentum oscillator designed to identify real shifts in price strength , filtering out random market noise.
It combines the True Range with statistical normalization techniques to provide a clear, responsive signal of the current momentum strength and direction . ️ Concept and Functionality TRNM measures the effective volatility of an asset using the True Range and transforms these values into a normalized momentum indicator ,

Z-Corr — это инструмент, разработанный для анализа корреляции между двумя валютными парами. Индикатор в реальном времени отображает отклонения в движении инструментов, помогая трейдеру определить моменты, когда валютные пары начинают расходиться, и своевременно открыть позицию для получения прибыли на их последующем схождении. Основные возможности: Отображает два инструмента и сравнивает их движение. Линии и гистограммы показывают текущую динамику отклонения пар. Жёлтая гистограмма сигнализирует

MARKET SENTIENCE PRO - INSTITUTIONAL GRADE MARKET INTELLIGENCE INDICATOR Copyright 2025, Amuyunzu OVERVIEW Market Sentience Pro is a comprehensive, institutional-grade trading indicator designed to decode market behavior by combining smart money concepts, market structure analysis, liquidity zone detection, and trend confirmation into a unified system. This all-in-one solution helps traders anticipate market movements before they occur by displaying a clear, layered view of institutional footpri

Simple Delta – Müşteri Açıklaması Simple Delta, MetaTrader 5 için temiz ve verimli bir hacim delta göstergesidir ve her mum çubuğunun üzerinde normalize edilmiş alım ve satım baskısını gösterir. Sunduğu Özellikler Göstergeler, delta’yı (alım hacmi eksi satış hacmi) hesaplamak için gerçek zamanlı tick verilerini analiz eder ve her mum çubuğunun üzerinde tek bir normalize değer (-10 ila +10) gösterir. Pozitif değerler alıcı baskısını gösterir (seçtiğiniz alım rengiyle), negatif değerler ise satıcı

LiquidX Pro - Precision Reversal Engine "Professional multi-confluence reversal detector that identifies high-probability tops and bottoms using institutional liquidity sweeps, volume exhaustion, and momentum divergence" Overview LiquidX Pro - Precision Reversal Engine is a sophisticated, professional-grade indicator designed for serious traders who want to catch high-probability market reversals with institutional precision. Stop chasing breakouts that fail—start trading reversals that pay. Thi
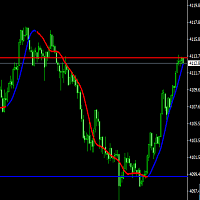
This is a professional trader's breakthrough system indicator that can be used for trading in various categories. Using the Hull moving average to create trend charts and provide price pressure and support positions, it provides traders with trading references for each cycle. Welcome to use it, if you have any questions, please contact us. The last 50 candlesticks for price pressure and support settings can be reset according to your needs
FVG Box– The Ultimate Fair Value Gap Indicator for MetaTrader 5
Developed by LiquidWave | Mohd Firuz Fahmi (Moff17) Precision Trading with Automated Fair Value Gaps
FVG Box is the next-generation Fair Value Gap (FVG) detection indicator designed for serious traders who rely on smart money concepts and institutional imbalance zones . With ultra-smooth performance and real-time updates, it automatically scans your chart to highlight potential liquidity gaps and trading opportunities wi

The Current Price Line indicator displays the current price as a real-time horizontal line on the chart. Features of the Current Price Line Unlike standard buy/sell lines, it is unaffected by spreads, enabling precise price identification. It instantly identifies reactive price zones (such as resistance/support lines), facilitating high-precision entries. It delivers high performance for scalping and day trading. Simultaneous display of lines across multiple timeframes supports multi-timeframe a

DS Candle Percent Panel – A complete market overview at a glance The DS Candle Percent Panel is an advanced indicator that displays in real time the percentage change of price relative to the opening of each candle across multiple timeframes — from M1 to D1 , including custom periods like H2 and H6 . With this tool, you no longer need to switch between multiple charts to see whether the market is rising on H1 while falling on M1. Everything is shown clearly, coherently, and instantly in a com

Here our more valuable tools
SMC Trend Trading , Easy SMC Trading , Institutional SMC Architect Volume Analysis Tools , Volume flow Profile , Market volume profile , FVG with Volume , Liquidity Heatmap Profile , Volume Spread Analysis Purpose : Measures market pressure by analyzing tick movements, volume, and speed within a time window. How it works : Calculates weighted price changes, considers tick velocity and volatility, and applies EMA smoothing. Trading use : Strong po

Instantly identify key price action signals with an intuitive visualization indicator:
Pin Bar: The Rejection Candle. Green for a bullish close, red for a bearish close. Defined by a long wick and a small body, signaling a strong price rejection.
Inside Bar: The Consolidation Candle. Highlighted in blue, this pattern occurs when a candle trades entirely within the range of the previous one. It represents a period of market indecision and compression.
Fakey Bar: The Failed Breakout

OrderFlow Pro - Institutional Order Flow Detector Professional Order Flow Analysis for MT5 OrderFlow Pro is an advanced technical indicator designed to detect and analyze institutional order flow in real-time. The indicator provides traders with comprehensive insights into market dynamics by identifying buying and selling pressure, volume imbalances, absorption zones, trapped traders, and delta divergences. KEY FEATURES Order Flow Detection: Real-time buy and sell pressure calculation with perce

MA MTF Fijo: Smooth Curves, Clean Charts
Eliminates the visual "steps" of multi-timeframe moving averages.
Fixed MA MTF: It offers a smooth and professional line of any higher timeframe directly on your current chart.
Key Points:
No Steps: Real and smooth curve between candles (Goodbye to rough straight lines). High Performance: Optimized code; does not slow down your MetaTrader 5. Maximum Versatility: Supports all 21 timeframes and all methods (SMA, EMA, SMMA, LWMA). Multi-Market: Ideal fo

Swing and Liquidity Sweep Finder is a powerful tool designed to automatically detect swing points and liquidity sweeps on your chart.
It helps traders identify where the market is likely to grab liquidity before reversing, showing both internal and external liquidity zones with high accuracy.
This indicator is ideal for ICT and Smart Money Concept traders who rely on swing structure and liquidity manipulation for their entries and exits.
Our Team Services: If you are want to see our products cl

Composite MA Indicator - Comprehensive Guide Description:
The Composite MA indicator is a sophisticated multi-timeframe trend analysis tool that calculates the average value of multiple moving averages across a user-defined period range. It provides comprehensive market trend visualization through both a color-coded composite moving average line on the chart and an Excel-style panel displaying trend direction across 21 different timeframes. The indicator uses canvas technology for smooth GUI r

Magic History is a detailed trade visualization indicator designed to bring the full story of your trading activity directly onto the chart. If you’re a developer or trader who uses magic numbers, this is made for you. Smart pagination - never lose track of your trades again. Pagination means dividing content into separate pages instead of showing everything all at once.
In the context of your Magic History indicator:
Pagination is a system that lets you view your trades in sections (pages) — f
Advanced ZigZag Histogram with Divergence Detection and Order Flow Simulation ZigDeltaSwingPro is a comprehensive technical analysis indicator for MetaTrader 5, built on the classic ZigZag algorithm and enhanced with modern features such as divergence detection, dynamic histogram visualization, swing pattern recognition, and simulated order flow insights. Designed for scalpers and swing traders alike, it leverages MT5’s internal tick volume to deliver actionable signals—no external data feeds r
Trade Like a Serpent — Calm, Precise, Lethal. The Serpent Strategy equips you with a visual edge — clarity in confusion, precision in volatility, and confidence in timing.
Let your trades strike like a serpent — swift, silent, and accurate. Overview The Serpent Strategy is a powerful custom-built MetaTrader 5 indicator designed to identify high-probability trade zones using a unique combination of market volatility, trend direction, and momentum confirmation.
It visualizes price action in th
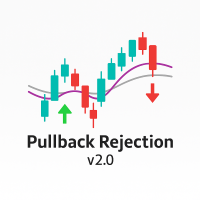
Overview Pullback Rejection v2.0 is a professional-grade visual indicator that spots continuation setups after pullbacks using Heiken Ashi logic and multi-EMA trend bias.
It is designed for scalpers and intraday traders who want clean, rule-based BUY and SELL signals aligned with trend direction only — no repainting, no noise, no counter-trend traps. Trading Concept The indicator combines EMA 7, EMA 50, and EMA 200 to define directional bias: Bias Condition Trades Allowed Bullish EMA7 > EMA200

İşte Türkçe çevirisi: Dönüşleri Gerçekleşmeden Önce Yakalayın Bu İndikatör Neleri YAPMAZ Bu bir al/sat sinyal üreteci değildir. Size işlemlere ne zaman gireceğinizi veya ne zaman çıkacağınızı otomatik olarak söylemez. Bu İndikatör Neleri Yapar Early Reversal Detector, fiyat davranışındaki değişimleri tespit ederek optimum giriş noktalarını hassas bir şekilde belirler. Nasıl Çalışır İndikatör, ana grafiğinizdeki fiyat mumlarına benzeyen mumları ayrı bir panelde oluşturur - ancak önemli bir farkla

ICT Unicorn Hunter – Multi-Timeframe Smart Setup Detector IMPORTANT: This is a Multi-Timeframe Scanner, looking for 'Unicorn' setups. A Unicorn in this definition is a liquidity sweep, market structure shift and creation of a Fair Value Gap overlapping with the last opposite-close candle before the liquidity sweep (breaker). This scanner does NOT provide visualisation of the Unicorn on the chart.
For visualisation, use the Unicorn Tracker indicator, which is designed to work with the Unicorn

# Ralli Düşüş ve Taban Mumları - Profesyonel Desen Tanıma
## Genel Bakış
Ralli Düşüş ve Taban Mumları, yatırımcıların yüksek olasılıklı arz ve talep bölgelerini tespit etmelerine yardımcı olmak için tasarlanmış profesyonel bir mum deseni tanımlama sistemidir. Bu gösterge, kurumsal yatırım stratejilerinin temelini oluşturan üç kritik mum türünü otomatik olarak belirler ve vurgular: Ralli mumları (güçlü alım baskısı), Düşüş mumları (güçlü satış baskısı) ve Taban mumları (konsolidasyon bölgeleri

MQL5 Blogları = https://www.mql5.com/en/blogs/post/776162 MT4 Sürümü = https://www.mql5.com/en/market/product/188797 MT5 Sürümü = https://www.mql5.com/en/market/product/154022
CONTRARIAN ZONES [tambangEA]; swing (salınım) yapısı, momentum koşulları, volatilite, hacim davranışı, reddetme (rejection) özellikleri ve bölge etkileşim geçmişini birleştirerek potansiyel dönüş alanlarını belirlemek üzere tasarlanmış profesyonel bir piyasa bölgesi göstergesidir.
Geleneksel bir destek ve direnç gösterg

Kurumsal Likidite Sıkışma Göstergesi Bu gösterge, Bollinger Bantlarının normalize edilmiş genişliğini, hacmi ve ortalama spread’i kullanarak likidite daralmasını gerçek zamanlı olarak ölçer ve fiyat kırılmalarından önceki sıkışma evrelerini tespit eder. Görünüm:
Profesyonel tarzda ayrı bir pencerede “Compression Score” histogramı ve “Threshold” referans çizgisi. Temel Özellikler Erken tespit: Fiyat hareketlerinden önce daralma bölgelerini belirler. Çok faktörlü ölçüm: Normalize edilmiş Bollinge
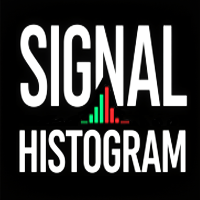
Signal Histogram — MetaTrader 5 platformu için güvenilir bir teknik göstergedir, mevcut trendi fiyat kapanışını hareketli ortalama ile karşılaştırarak görsel olarak belirlemek için tasarlanmıştır. Gösterge ayrı bir pencerede bir histogram görüntüler: yeşil çubuklar fiyatın ortalamanın üzerinde olduğunu, kırmızı çubuklar ise fiyatın ortalamanın altında veya eşit olduğunu gösterir. Bu yaklaşım, trend yönünü hızla değerlendirmeye ve potansiyel dönüş noktalarını belirlemeye olanak tanır. Gösterge,
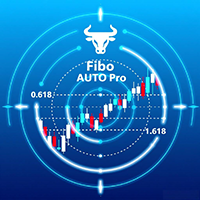
Fibo AUTO Pro: Redefining Fibonacci Analysis - Smarter, More Intuitive, More Efficient Product Overview
Fibo AUTO Pro is a professional-level technical analysis indicator designed specifically for modern traders. Based on the classic Fibonacci retracement theory, it has been comprehensively enhanced with intelligence to address the pain points of traditional drawing tools in terms of efficiency, visualization, and accuracy. Fibo AUTO Pro is not merely a line-drawing tool; it is your intellige
Mean Reversion Probability – İstatistiksel Dönüş Göstergesi Kısa açıklama
Piyasa yorgunluk bölgelerini nicel hassasiyetle tanımlayan, 200 hareketli ortalamaya geri dönüş olasılığını tarihsel aşırılıklar analizine dayanarak hesaplayan kurumsal bir göstergedir. Temel Özellikler
Gelişmiş istatistiksel analiz – Gerçek olasılıkları hesaplamak için 500+ tarihsel aşırılık veritabanı oluşturur
Olasılık skoru 0–99% – Ortalama dönüş olasılığını kesin olarak ölçer
Yorgunluk tespiti – Aşırılığın süresini

ARB , yüksek olasılıklı kırılma (breakout) fırsatlarını belirlemek için tasarlanmış bir göstergedir.
Adaptif ATR kanal sistemi ve hassas çok faktörlü puanlama modeli (0–100) sayesinde çalışır.
Volatilite, hacim, momentum ve çoklu zaman dilimi trendini birleştirerek, filtrelenmiş, görsel ve gerçek zamanlı olarak kullanılabilir sinyaller sunar. ÇALIŞMA PRENSİPLERİ Gösterge, Adaptive Range Breakout (ARB) kavramına dayanır — bu modern kırılma ticareti yaklaşımı, piyasa volatilitesine (ATR) ve fiyatı
Enhance your trading strategy with this indicator from tr1cky.com This indicates buying and selling strength. Look for correlation on multiple timeframes for best indication and confidence in your trade. This indicator is simply RSI-MFI for buying and MFI-RSI for selling and is used in the successful expert advisors by tr1cky,com that just use this indicator for execution.

Hi Traders,
On purchase this tool we will give lifetime free updates for this tool
you can contact me how to use this tool better or your suggestion for improvement
This tool will work on any accounts
Where When Enter Exit – Trade Plotter helps traders easily see, track, and review their sell trades directly on the chart.
It clearly shows where you entered, when you exited, and why , so you can quickly learn from every trade. Key Features Auto Plot Entries & Exits –
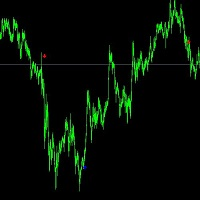
The 5-minute trend buying point reference for gold has an accuracy rate of 90%. All signals are not redrawn, Parameters need to be adjusted for different varieties and periods. The default value for gold trading is the 5-minute period. You can carefully study what direction guidance is suitable for you. We hope you can make money and it is worth referring to for professionals and novice traders. Stop loss is at the end of the line, real-time signal. Welcome to use it. If you have any question

Hidden Trend Channel Project 17 Tool
SPECIAL NOVEMBER SALE is now finished. Price goes back to normal.
This is an Automated Tool for Multi Timeframe Trend Channel Analysis Visualization with Intelligent Range Market, Trending Market, Reversal, Breakout Detection. It draws multiple Trend Channels with multiple sub-trendlines levels inside the channel for perfectly give you the trader, the crystal clear Trend channels where price trend direction is moving.
This tool is accurately useful for T
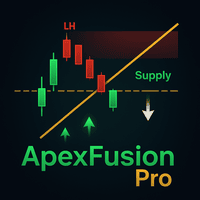
Reach the apex of precision trading with ApexFusion Pro — a next-generation indicator that fuses RSI divergence , diagonal support & resistance trendlines , Order Blocks , and Fair Value Gaps (FVG) into one visual system. Built for professional traders, it reveals the hidden balance between momentum and liquidity , showing where institutions accumulate, where reversals form, and where the true market flow begins. Key Features: Detects RSI divergences (bullish & bearish) with visual signals Dr
TuMz TrendSignal – Your Reliable Trading Compass in Volatile Markets Tired of noisy indicators that give false signals? Meet TuMz TrendSignal — a clean, non-repainting, ATR-based trend indicator built for serious MT5 traders. Using a smart combination of mid-price (HL/2) and adaptive ATR bands , TuMz TrendSignal dynamically draws: Green trend line during uptrends Red trend line during downtrends Dotted support/resistance zones that adjust to market volatility Clear buy/sell arrows at tr

CVD (Cumulative Volume Delta) for MT5 CVD (Cumulative Volume Delta) for MT5 Simple, fast CVD for volume and order flow trading. It tracks net buying vs selling pressure and plots CVD as candles. The Data Window also shows tick count per candle. What it does Accumulates volume delta from ticks or a chosen timeframe Optional reset: No Reset, Current Chart Period, or a specific timeframe Works on any symbol and timeframe How it’s calculated Tick-based: each incoming tick is labeled as buyer- or sel

- What does this do?
This indicator draws the standard session boxes used in Steve Mauro's BTMM (Beat the Market Maker) method:
• Asian session boxes
• Brinks boxes: London and New York session changeover boxes
• New York session boxes
• Stop-hunt boxes
- Is this for me?
If you use the BTMM trading system and you are on MetaTrader5, this is for you.
• The one provided by Steve Mauro was for MetaTrader4. This is its first MetaTrader5 adaptation. You cannot find this anyw
Bankalar Seans Çizgileri Göstergesi Banklar Seans Çizgileri, fiyatın hareket ettiği saatleri otomatik olarak vurgular. Akıllı yatırımcıların, bankaların faaliyet gösterdiği Asya, Londra ve New York gibi önemli kurumsal işlem seanslarını, grafikleriniz için tamamen özelleştirilebilir seans çizgileriyle net bir şekilde işaretlemelerine ve takip etmelerine yardımcı olur.
Volatilite döngülerini takip ederken netlik ve kesinliğe ihtiyaç duyan yatırımcılar için tasarlanmıştır.
Neden Bankalar Seans
Shadow Pulse Kısa Açıklama Shadow Pulse, ortalamaya dönüş yöntemine dayalı olarak dönüş noktalarını belirlemek için profesyonel bir göstergedir. Akıllı çok seviyeli filtreleme sistemi kullanarak son derece doğru alım ve satım sinyalleri üretir. İşlem Stratejisi Gösterge, M1'den H4'e kadar tüm zaman dilimlerinde çalışacak şekilde tasarlanmıştır ve altın (XAUUSD) scalping'inde olağanüstü sonuçlar gösterir. Düşük periyotlarda agresif işlemler için ve yüksek zaman dilimlerinde orta vadeli pozisyonla

Find potential stop-run zones before price gets there. Bank Levels Tracker highlights potential liquidity levels around obvious swing highs and lows, where retail stop losses may cluster. These areas can become important stop-run zones, often watched by Smart Money Concepts traders for possible liquidity grabs, fakeouts, and reversal setups. Instead of manually marking the same highs and lows over and over again, Bank Levels Tracker plots the levels in advance and sends an instant alert when pr
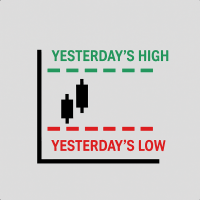
- What does this do?
This indicator draws previous day's high and low as blue tracers on the chart. It is used in Steve Mauro's BTMM (Beat the Market Maker) method.
- What improvement does this indicator offer?
The original version provided by Steve Mauro was for MetaTrader4. This is the first adaptation for MetaTrader5.
Highly optimized for computing resources. It does not affect your computer's performance at all.
MetaTrader Mağazasının neden alım-satım stratejileri ve teknik göstergeler satmak için en iyi platform olduğunu biliyor musunuz? Reklam veya yazılım korumasına gerek yok, ödeme sorunları yok. Her şey MetaTrader Mağazasında sağlanmaktadır.

Alım-satım fırsatlarını kaçırıyorsunuz:
- Ücretsiz alım-satım uygulamaları
- İşlem kopyalama için 8.000'den fazla sinyal
- Finansal piyasaları keşfetmek için ekonomik haberler
Kayıt
Giriş yap
Web sitesi politikasını ve kullanım şartlarını kabul edersiniz
Hesabınız yoksa, lütfen kaydolun