 MetaTrader 5
 Uzmanlar
 Göstergeler
 Kütüphaneler
 Yardımcı programlar
 Widget'lar
 Kurallar
YouTube'dan Mağaza ile ilgili öğretici videoları izleyin
Bir alım-satım robotu veya gösterge nasıl satın alınır?
Uzman Danışmanınızı
sanal sunucuda çalıştırın
sanal sunucuda çalıştırın
Satın almadan önce göstergeyi/alım-satım robotunu test edin
Mağazada kazanç sağlamak ister misiniz?
Satış için bir ürün nasıl sunulur?
MetaTrader 5 için ücretli Teknik Göstergeler - 91
 Teknik göstergelerden gelen sinyaller, borsa ve Forex piyasalarında işlemler açılması ve kapatılmasında çok önemli bir rol oynar. Göstergeler, fiyat değişikliklerini tahmin etmeyi amaçlayan, finansal sembol fiyatının matematiksel dönüşümüdür.
Piyasa davranışını daha iyi tahmin etmek ve bundan kar elde etmek için teknik göstergeleri test edin.

TrendScan: Multi-Asset Trend Radar
It is a high-speed scanner that monitors 23 symbols and 7 timeframes on a single screen. It identifies real trends and filters sideways markets using a triple EMA and ATR volatility algorithm.
Instant Detection: Bullish, bearish, or neutral trend signals. Noise Filter: It only shows strongly confirmed trends (Slope filter). Quick Access: Click on any signal to open the chart with your template. Clean Interface: Massive analysis without cluttering your workspac

AureX Indicator AureX Indicator is a technical analysis tool for MetaTrader 5.
It is based on a momentum‑style oscillator that measures price accelerates and decelerates. The indicator is designed to: calculate a smoothed internal momentum curve from price data highlight regular, hidden and exaggerated divergence between price and the oscillator mark areas where price movement and internal momentum are not aligned AureX is intended to support your own market analysis and trading plan. It does no

TrendScanner ALMA — A Lightweight Trend Watcher That Works Silently TrendScanner ALMA quietly monitors the trend status of your selected symbols and timeframes, scanning at regular intervals to detect subtle shifts and notify you—without cluttering your chart. Features ALMA-Based Trend Detection Built on the Arnaud Legoux Moving Average (ALMA), this scanner delivers smooth, responsive trend signals while filtering out market noise. Silent Monitoring of Trend Changes Detects not only uptren
Range Cycle Indicator. Gives signal on price range cycling smoothed by moving average. It is better to use it on H1+ timeframes and avoid side markets. Because if market is flat this indicator will give too many zero profit or even losing signals. Parameters: PopUpAlert - to allow it to alert when trend changes; EMailAlert - for email alerts; period - this is a smoothing criteria, use higher values on lower timeframes; TimeFrame(new) - higher timeframe (or the same) to use for calculation, defa
Hayal edin: Büyük bir karın eşiğindesiniz, ancak pazar aniden değişiyor ve bir şansı kaçırıyorsunuz. Ya da daha kötüsü, kar yerine kayıplar alıyorsunuz. Ya önceden “Hazırlanın, dalgalar geliyor!” diye fısıldayan güvenilir bir müttefikiniz olsaydı? Kaosdan bıkmış ve piyasa değişikliklerini tahmin etmek isteyen tüccarlar için özel olarak tasarlanmış devrim niteliğinde bir gösterge olan Harbinger ile tanışın! Harbinger , yaklaşan gerilemeleri, geri dönüşleri veya birikimleri inanılmaz bir doğrulukl

Acceleration Bias — Price Acceleration Impulse Indicator Acceleration Bias is a modern analytical tool designed to measure changes in price acceleration and visualize impulse asymmetry using a robust mathematical model.
This indicator is intended for traders working with market volatility, impulse phases, and price-movement structure, as well as those who need algorithmic, rule-based analytical support. Purpose and Core Concept Unlike traditional oscillators that analyze only velocity changes (f

WHAT IS HTF CANDLES PRO? HTF Candles Pro is an advanced Multi-Timeframe indicator that constructs custom higher-timeframe candles directly from H1 bars, combining this visualization with a complete system of internal Fibonacci levels and projections. Unlike other HTF indicators that only display standard MetaTrader timeframes, this indicator allows you to create completely customized timeframes (24H, 48H, 72H, 96H, etc.) by aggregating 1-hour bars. KEY FEATURES 1. CUSTOM CANDLE CONSTRUCTION Cust

Elliott Wave Drawing Tool for MT5 – The Ultimate Professional Wave Mapping System Take your market analysis to the next level with the Elliott Wave Drawing Tool for MT5 , an advanced charting solution designed for traders who demand precision, speed, and complete control in wave labeling. Engineered for both beginners and expert Elliotticians, this tool transforms manual wave marking into a smooth, intuitive, and highly accurate experience. Built with a smart drawing engine , this indicator lets

you tired of exporting your trading history to Excel just to figure out your stats? Do you struggle to know if your EA is actually profitable, or if your manual trades are hurting your performance? Stop guessing and start analyzing. The Trade Performance Dashboard is a powerful, all-in-one utility that replaces guesswork with facts. It loads directly onto your chart and instantly analyzes your entire trading history, presenting all vital statistics in one clean, professional panel.
Finally, Kn
N/B: All our product purchase comes with our free ‘’DAILY SCALPER EA’’ - bit.ly/4qlFLNh Whatsapp Developer for yours after successful purchase
DAY TRADER PLUS: The Institutional Order Flow System
Finally See Where Banks Place Their Orders - And Profit With Them
ARE YOU SICK OF THIS?
"I entered the trade at what seemed like the perfect time... only to watch price reverse immediately and hit my stop loss."
"I took profits too early, then watched the market run another 100 pips w
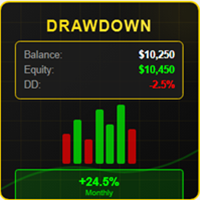
# DRAWDOWN INDICATOR V4.0 - The Essential Tool to Master Your Trading
## Transform Your Trading with a Complete Real-Time Performance Overview
In the demanding world of Forex and CFD trading, **knowing your real-time performance** isn't a luxury—it's an **absolute necessity**. The **Drawdown Indicator V4.0** is much more than a simple indicator: it's your **professional dashboard** that gives you a clear, precise, and instant view of your trading account status.
---
## Why This Indicator
Harmonic based indicator. Recognizes several patterns: ABCD, 3 Drives, Gartley, Butterfly, Bat, Atlternative Bat, Deep Bat, Crab, Deep Crab, Cypher and Shark. Able to set SL and three levels of TP based on Fibonacci Levels. Three types of alerts are available: PopUp, Email and Push. Trade advices on chart and stats also printed for visual estimation. All patterns are formed by not repainting ZigZiag. Parameters for it are classic: InpDepth, InpDeviation,InpBackstep. MinComplete means the level
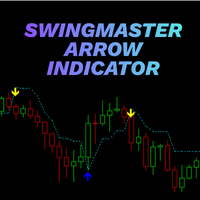
Swing Master Arrow Indicator Clear Swing Signals • Trend-Aligned Entries Swing Master Arrow Indicator is a swing-based trading tool designed to identify potential market turning points and highlight structured Buy and Sell opportunities. It uses a volatility-aware trend logic to detect meaningful swing reversals while filtering out minor market noise. The indicator provides clear arrow signals directly on the chart, helping traders follow price movement with greater clarity and consistency. Cor
HeatMap Regression Confluence: Kurumsal Likidite Radarınız Fiyatın ziyaret etmek zorunda olduğu seviyeleri belirlemek ister misiniz? Heatmap Regression , grafikteki kurumsal aktivitenin ayak izlerini tespit eden gelişmiş bir ısı haritasıdır. Güçlü sermaye emilimi veya dağıtımının gerçekleştiği anahtar bölgeleri tanımlar ve piyasanın düzeltmeye meyilli olduğu bekleyen dengesizlikleri geride bırakır. Bu gösterge size fiyatın en olası geri dönüş hedeflerini gösterir. Anahtar Bölge Anali
Smash FX System — Inside-Bar Breakouts, Reversals & Continuations (Indicator) Tagline: Smash the noise, catch the clear moves — high-clarity inside-bar breakout, reversal and continuation arrows designed for clean entries and professional journaling. Short promo Smash FX System pinpoints high-probability inside-bar breakouts, smart reversals and continuation setups with on-chart arrows and exact levels — built for traders who want clear, repeatable setups and perfect order-management handoffs f
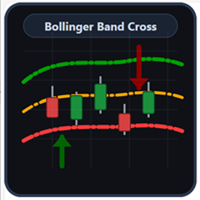
Bollinger Band Cross — Oklar ve Bant lar “Y eniden giriş” ve “dokunup içeri kapanma” siny allerini net oklarla gösteren, sin yal odaklı Boll inger Bantları göstergesi . Ne yapar Bollinger Bantlarını çizer (Üst: Yeşil , Orta: Turuncu , Alt : Kır mızı), Dash DotDot st iliyle. Alt bant dışından kan ala dönüşte koyu yeş il yukarı ok. Üst bant dışından kan ala dönüşte koyu kırmızı aşağı ok. Stratejinize uygun iki hesap lama modu . S inyal mod ları Reentry (cross _reentry

Range Perfect Göstergesine Giriş Range Perfect (RP), MX Robots tarafından geliştirilen özel bir MetaTrader 5 göstergesidir. Özellikle yatay (range) piyasalarda veya trendin yorulma aşamalarında işlem yapan trader’lar için tasarlanmıştır. Bu gösterge, trend zayıflamasını tespit eder ve XAUUSD, EURUSD, başlıca Forex pariteleri, Bitcoin gibi kripto varlıklar ve diğer yüksek volatiliteye sahip enstrümanlarda yüksek olasılıklı dönüş bölgelerini işaretler. Birçok geleneksel gösterge çoklu onay gerekti
N/B: All our product purchase comes with our free ‘’DAILY SCALPER EA’’ - bit.ly/4qlFLNh Whatsapp Developer for yours after successful purchase
HolyGrail Premium System: The Ultimate Supply & Demand Trading Solution
Finally Discover the "Unfair Advantage" That Professional Traders Have Been Using For Years
"I went from inconsistent guessing to precision trading with 83% accuracy once I started combining multi-timeframe confirmation with institutional order flow zones"
Note: After pur
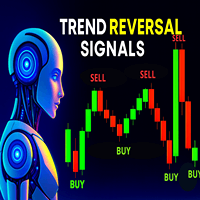
TREND REVERSAL SIGNALS – trend dönüşleri için kesin sinyaller TREND REVERSAL SIGNALS, trend dönüş noktalarını en yüksek doğrulukla belirlemek için geliştirilmiş ileri seviye bir göstergedir. Fiyat verilerini (OHLC) analiz eder ve olası dönüşleri işaret eden mum formasyonlarını tanır. Fiyat hareketi, volatilite (ATR) ve piyasa yapısını birleştirerek grafikte net AL / SAT sinyalleri üretir. Analiz temeli: Fiyat Hareketi (OHLC) – çift tepe/çift dip, omuz-baş-omuz gibi dönüş formasyonlarını te
N/B: All our product purchase comes with our free ‘’DAILY SCALPER EA’’ - bit.ly/4qlFLNh Whatsapp Developer for yours after successful purchase
DayTrader Premium System Indicator: Complete Trading Mastery
The DayTrader Premium System Indicator represents the culmination of institutional trading methodology made accessible to retail traders. By combining order block analysis, supply/demand zone identification, and multi-factor confirmation, it provides a comprehensive framework for consis
RSI Nexus Multi-timeframe (RSI-Nexus-MTF) RSI-Nexus-MTF is a multi-timeframe RSI engine designed to help algorithmic traders identify structure, context and trigger signals simultaneously. Inspired by Fractal Market Rhythm analysis, the indicator extracts the RSI trend from three layers of market flow: Long-Term Structure (HTF) Mid-Term Context (MTF) Short-Term Trigger (current timeframe) This makes the indicator especially powerful for robot developers , allowing EAs to read market conditions

AutoLevels – Akıllı Destek ve Direnç Tespiti AutoLevels, gerçek zamanlı grafik verilerini kullanarak önemli fiyat bölgelerini otomatik olarak belirleyen güçlü bir indikatördür. Swing zirve ve dip noktalarını, piyasa volatilitesini (ATR) ve fiyatın belirli seviyelere tekrar tekrar verdiği tepkileri analiz ederek güvenilir destek ve direnç seviyelerini ortaya çıkarır. Temel bileşenler: Swing High ve Swing Low noktaları, ayarlanabilir hassasiyet (LeftBars & RightBars) ATR’ye dayalı dinamik bö

AutoLevelsPro — fiyat verilerini analiz ederek otomatik olarak destek ve direnç bölgelerini işaretleyen bir indikatördür.
Özellikle düşük zaman dilimleri için tasarlanmıştır; en iyi sonuçları 15 dakikalık grafiklerde verir ve piyasanın en dinamik tepkilerini yakalar. Kullandığı veriler: High — mumun en yüksek fiyatı Low — mumun en düşük fiyatı Close — ATR hesaplamasında kullanılır Her mumun zaman damgası, bölgelerin doğru konumlandırılması için ️ Analiz süreci: Yerel zirveleri

Smart Risk Manager Pro – Sürükle & Bırak ile Güvenle İşlem Yap Smart Risk Manager Pro, dolar bazlı riskine göre pozisyon büyüklüğünü hesaplayan profesyonel bir grafik üstü risk yönetimi aracıdır. Sadece grafikte tıklayıp sürüklemen yeterli; indikatör anında şunları gösterir: Yön (Buy / Sell) Mesafe (puan cinsinden) Önerilen lot büyüklüğü (RiskUSD değerinize göre) Araç ultra hafif, son derece hızlıdır ve temiz bir grafik ile riske odaklı, hassas bir işlem akışı isteyen traderlar için tasarlanmışt
Red and Green Light – Intelligent Trading Signal Indicator Product Overview Red and Green Light is a professional trading signal indicator based on the multi-stage T3 smoothing algorithm. It integrates a visual traffic light system, intelligent signal recognition, risk alerts, and multiple notification features. Whether you're a manual trader or an Expert Advisor (EA) developer, this indicator helps you capture market opportunities with greater precision and effectively avoid the risks of

Comprehensive Trading Analysis Tool This tool has four main parts that help traders understand the market and manage risk in a simple way 1 Risk and Reward Visual Tool It shows two boxes on the chart a pink box for risk and a navy blue box for reward It shows the risk to reward ratio You can move and resize the boxes It shows pips and possible money for risk and reward It gives a clear picture of possible profit and loss It helps plan trades before entering It keeps risk levels consistent It hel
King Smart Liquidity MT5, forex, altın, endeksler, Bitcoin ve diğer piyasalardaki kurumsal para akışlarını ve büyük bankaları takip etmek için özel olarak tasarlanmış gelişmiş bir analitik göstergedir. Bu gösterge, fiyat hareketi, likidite bölgeleri ve büyük finansal kurumların piyasadaki davranışlarını anlamaya dayanan "Smart Money Concept" metodolojisine dayanarak geliştirilmiştir. Bu gösterge sadece çizgiler veya bölgeler çizmez, aynı zamanda geleneksel gecikmeli göstergelerden uzak, gerçek
What It Does for xauusd only Finds Order Blocks (ANN + SMC) on big and small timeframes. Marks them with clean bullish/bearish zones. Drops arrows (blue = BUY, red = SELL) right inside each block. Shows an info panel on the right with the exact high/low of the newest blocks. Lets you change chart colors (background, bull candle, bear candle) instantly. How To Use It Drop the indicator into MQL5/Indicators → restart MT5. Add it to your chart. In the settings: Pick your background , bull candle ,

Moving Polynomial Regression The Moving Polynomial Regression indicator provides traders with a statistically robust and adaptive method for identifying the true trend, predicting immediate momentum shifts, and filtering market noise. Unlike traditional moving averages that simply lag the price, this tool fits an optimal polynomial curve to the market, giving you a dynamic and predictive view of price action. Key Advantages Superior Noise Filtering: Uses advanced mathematical techniques
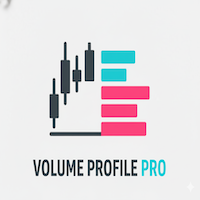
Turkish (ตุรกี) Volume Profile Pro Göstergesi Bu gösterge, "en çok işlem hacminin hangi fiyatta gerçekleştiğini" analiz etmeye yardımcı olan Volume Profile Pro aracıdır. Aşağıdaki gelişmiş özelliklere sahiptir: Görüntüleme Modları (Display Modes) Volume Profile (Normal): Önemli destek ve direnç bölgelerini görmek için her fiyat seviyesindeki toplam işlem hacmini (Total Volume) gösterir. Delta / Money Flow: O fiyatta piyasayı kimin kontrol ettiğini görmek için alış ve satış baskısı (Buy vs S

TradingView Uzantısı TradingView tarzı çizim ve analiz araçlarını doğrudan MetaTrader grafiğinize ekleyin Platform sınırlaması olmadan sınırsız grafik kullanın Özel koşullara dayalı sınırsız alarm oluşturun ve yönetin MetaTrader içinde TradingView tarzı popüler göstergeleri kullanın Satın alma sonrası, ek göstergeler ve kurulum rehberi içeren bir klasör alacaksınız Giriş
Trading View Extension, gelişmiş TradingView çizim araçlarını ve analiz yeteneklerini MetaTrader ortamına taşımak için gelişt

PİYASA SKORLAMA SİSTEMİ – Gelişmiş Çok-Zaman Dilimli (Multi-TF) Trading İndikatörü Teknik göstergeler, makine öğrenimi modelleri ve çok zaman dilimli onaylamayı birleştiren profesyonel bir piyasa analiz sistemi. Yüksek hassasiyetli işlem sinyalleri üretir. ANA ÖZELLİKLER Çok Zaman Dilimli Analiz:
Sinyaller M5 - H1 gibi farklı zaman dilimleri arasında doğrulanır Akıllı Skorlama Motoru:
Son 25 mum üzerinde trend, range ve belirsizlik puanlaması Piyasa Niyeti Algılama:
Son 6 mum ve hacim ağırlığ

LiquidZones Pro automatically detects and visualizes supply and demand zones on your chart. By analyzing swing highs and lows over a configurable lookback period, the indicator highlights critical areas where price has historically reacted. Key Features: Automatic detection of supply (resistance) and demand (support) zones. Configurable lookback period , swing strength , and zone width . Zones merge automatically if price levels are close, keeping charts clean. Minimum touch filter to avoid wea

Dashboard for account exposure. MT5:
- List of pairs
- Account Profit/Loss - Lots open for each pair - Total PnL for each pair - Balance, equity, margin
Simple to use indicator. Just drag and drop. Minimal input required. Must enable Algo trading and DLL import. This indicator provide real time info of account status and health. Easy to make decision across pairs.
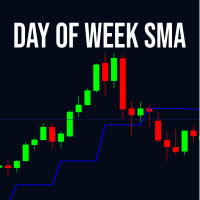
Haftanın Günü SMA göstergesi, kullanıcı tarafından seçilen haftanın belirli bir gününün kapanış fiyatlarına dayalı olarak bir hareketli ortalama hesaplar. Basit (SMA), Üstel (EMA), Pürüzsüzleştirilmiş (SMMA) ve Doğrusal Ağırlıklı (LWMA) dahil olmak üzere çeşitli hareketli ortalama türlerini destekler. Dönem, hesaplamaya dahil edilecek seçilen günün kaç örneğini belirler. Bu araç, finansal piyasalarda haftalık desenleri analiz etmek için kullanışlıdır ve tüccarların belirli günlere özgü trendleri
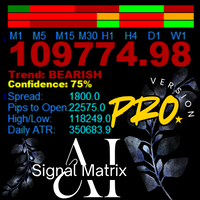
AanIsnaini Signal Matrix MT5 PRO - Bayesian Multi-Timeframe Dashboard "Advanced multi-timeframe dashboard with Bayesian Learning, real-time Signal Strength, and persistent memory. The older it runs, the smarter it becomes."
The free version (v1.3) gave you visibility. The PRO Version gives you the edge . AanIsnaini Signal Matrix MT5 PRO is a sophisticated multi-timeframe analysis system that combines classical technical indicators with adaptive probabilistic reasoning. Designed for serious tra
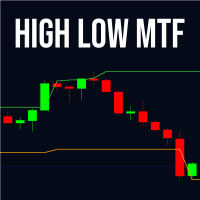
High Low MTF – Çoklu Zaman Dilimi Yüksek ve Düşük Seviyeleri High Low MTF, herhangi bir zaman dilimindeki en yüksek ve en düşük seviyelere dayalı güçlü destek ve direnç bölgelerini görüntülemek için tasarlanmış profesyonel bir göstergedir. Daha yüksek veya daha düşük dönemlerden gelen seviyeleri mevcut grafikte doğrudan göstererek kapsamlı bir çoklu zaman dilimi piyasa görünümü sunar. Scalping, gün içi işlem, swing ve iCustom üzerinden kullanılan algoritmik sistemler için uygundur. Göstergede se

BUY and SELL smart The BUY and SELL Smart Indicator is a next-generation trading tool engineered for precision scalpers, intraday strategists, and professional analysts who demand both speed and clarity in market visualization. It seamlessly integrates smart candle-based analytics, adaptive ATR logic, and real-time economic event awareness — giving you a fully synchronized view of market volatility and momentum. Through an elegant and optimized interface, FlashScalp delivers instant signal fee
Fine Timeframes, MT5 için bir dakika altı zaman dilimi göstergesidir. 1 ila 30 saniyelik aralıklarla grafikler oluşturarak, dakika ve saatlik grafiklerde görünmeyen piyasa hareketlerine erişmenizi sağlarken, tüm işlem işlevlerini korur: Standart zaman dilimlerinde olduğu gibi pozisyon açıp kapatabilirsiniz. Fine Timeframes yalnızca canlı tiklerde çalışır ve Strateji Test Cihazı için tasarlanmamıştır; demo sürümünü indirin ve göstergeyi EURUSD ve AUDUSD'de gerçek piyasa koşullarında test edin. Te
Squeeze Momentum Alert 1. Fiyat "Patlama" Noktalarını Belirler (The "Squeeze") Bu indikatörün en büyük avantajı, büyük bir hareketten önce piyasanın "konsolide olduğu" veya "enerji topladığı" anları yakalayabilmesidir. Neden iyi: Piyasalar durgunluk ve oynaklık arasında gidip gelir. Bu araç size, "Grafik şu an sıkışıyor, bir sonraki büyük yükselişe hazırlanın" diyerek büyük trendi kaçırmamanızı sağlar. 2. Trend "Gücünü" Detaylı Ayırt Eder (Color Coded Momentum) Histogram, trendin sağlığını göste

Engulfing Signal Pro is a powerful and lightweight MQL5 indicator designed to deliver high-probability market entries based on candlestick Engulfing patterns combined with advanced internal calculations. This indicator is built for traders who demand accuracy, clarity, and speed—without repainting. Key Features Smart Engulfing Detection
Automatically detects bullish and bearish Engulfing patterns using strict candle-body rules, ensuring that only meaningful price reversals trigger signals. Mult

RSI Divergence PRO (Non-Repaint) – MT5 Indicator Overview
RSI Divergence PRO automatically detects Bullish and Bearish Divergence between price and RSI and plots clear arrows on the chart. The indicator is 100% non-repainting because signals are generated only after pivot points are fully confirmed.
This is one of the most reliable reversal detection tools used by both beginners and professional traders. ------------------------------------------------------------------ -------------------
This is MT5 version only. For MT4 visit: https://www.mql5.com/en/market/product/156000/
Detailed blog post with screenshots: https://www.mql5.com/en/blogs/post/765529
Features Overview Bull and Bear Power Visualization: Histograms or Lines or Bands Combined Bull/Bear Power (BBP) Mode: To see the net power balance Customize Colors: for instant pattern recognition Smoothing (Optional): reduces noise for cleaner signals Additional Filter Options: Price Divergence visualization to spot potential
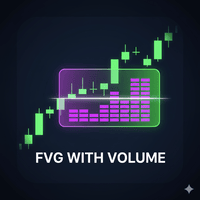
FVG Volume Profile (Institutional Price Action) Unlock the hidden liquidity inside Market Imbalances. The FVG Volume Profile is an advanced Price Action indicator that goes beyond standard Fair Value Gap detection. It looks inside the gap using lower timeframe data to construct a Volume Profile specifically for that imbalance. This helps you identify exactly where the "Smart Money" is defending positions. Key Features: Internal Volume Profile: Automatically scans lower timeframes
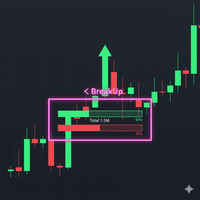
Breakout Boxes with Volume Pressure This indicator automates the identification of key consolidation zones (Supply and Demand) based on Market Pivots and Volatility (ATR). Unlike standard support/resistance tools, this indicator provides a unique Volume Pressure Analysis inside every box, giving you insight into the battle between Buyers and Sellers before a breakout occurs. Key Features Automated Supply & Demand Zones: Automatically detects significant Pivot Highs and Lows to draw dyna
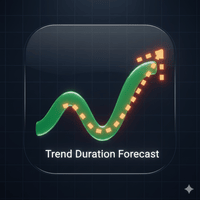
Trend Duration Forecast It utilizes a Hull Moving Average (HMA) to detect trend direction and statistically forecasts the probable duration of the current move based on historical market behavior. Key Features Smooth Trend Detection: Uses the Hull Moving Average (HMA) to filter noise while minimizing lag, providing clean Bullish/Bearish signals. Real-Time Duration Counter: Displays a dynamic label at the start of the current trend showing the "Real Length" (number of bars the trend has b

Spot high-impact reversal zones with precision. This indicator highlights candles where the wick exceeds a customizable percentage of total candle length — a key signal of price rejection and potential turning points. Features include: • Wick ratio filter (e.g. wick > 50% of candle length) • Minimum candle length threshold (in pips) • Real-time chart arrows for upper/lower wick dominance • Optional alerts for fresh wick signals Perfect for traders who rely on candlestick psychology to a

Trade in the Footsteps of the Institutions The SMC Institutional Order Flow indicator brings the power of professional trading strategies directly to your MetaTrader 5 terminal. Based on the core principles of Smart Money Concepts (SMC) , this advanced tool automatically maps the key levels and structures used by banks and large institutions to move the market. Stop guessing and start seeing the market through the lens of order flow. This all-in-one suite identifies where institutions have
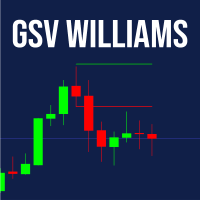
GSV – Guided Swing Value Levels GSV – Guided Swing Value Levels, piyasada istatistiksel olarak daha yüksek doğrulukla tepki verme eğiliminde olan fiyat bölgelerini bulmak isteyen traderlar için geliştirilmiş özel bir göstergedir.
Hesaplaması, Larry Williams’ın “Long-Term Secrets to Short-Term Trading” adlı kitabında sunduğu, piyasa salınımlarının istatistiksel ortalamasının fiyatın muhtemelen duracağı, düzeltme yapacağı veya tersine döneceği bölgeleri tahmin etmede önemli olduğunu vurgulayan kav
Multi Pivot Pro — Tek Göstergede 5 Pivot Yöntemi (MT5) Multi Pivot Pro, MetaTrader 5 grafiğinize beş farklı hesaplama yöntemiyle günlük pivot seviyelerini çizer. Yöntemler arasında tek bir açılır menüden geçiş yapabilirsiniz — beş ayrı gösterge kurmanıza gerek yok. Pivot noktaları; giriş, çıkış ve stop seviyelerini planlamak için yaygın kullanılan destek ve direnç seviyeleridir. Pivot yöntemleri Klasik Fibonacci Camarilla Woodie DeMark (DM) Özellikler Pivot (P), direnç R1–R3 ve destek S1–S3 sevi

Link to our products: https://www.mql5.com/en/users/alireza.saeedian/seller TradeX candlestick indicator is one of the leading indicators in the market. you can show/hide any pattern with one click or you can change the setting from setting tab.
If you don't have any information about candle stick pattern you can watch it from my YouTube channel. This indicator will be updated day by day.
Uncover Institutional Footprints with Volume-Based Supply & Demand Liquidity Zones is a sophisticated Price Action and Volume analysis tool designed for MQL5. Unlike standard Support & Resistance indicators that rely solely on price history, this indicator integrates Volume Volatility Analysis to identify high-probability reversal levels. It automatically detects key Swing Highs and Swing Lows where significant trading activity (volume) occurred. In Smart Money Concepts (SMC), these areas r
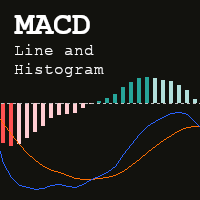
The MACD Line and Histogram is an enhanced version of the classic Moving Average Convergence Divergence (MACD) indicator. While the traditional MACD consists of two lines—the MACD (Main) line and the Signal line —the extended version introduces a Histogram that visually represents the difference between these two lines. Inputs Fast MA method (Simple, Exponential, Smothed or Linear weighted) Fast MA period Slow MA method (Simple, Exponential, Smothed or Linear weighted) Slow MA period

Multi Indicator Scanner — 10 Gösterge, Tek Panel (MT5) Multi Indicator Scanner, 10 popüler teknik göstergeyi aynı anda okur ve her birini grafik üzerindeki tek bir panelde AL, SAT veya NÖTR olarak, genel bir özetle birlikte gösterir. On göstergeyi tek tek yükleyip kontrol etmek yerine tüm tabloyu tek yerde görürsünüz. Analiz edilen göstergeler RSI (Relative Strength Index) Stochastic %K CCI (Commodity Channel Index) ADX (Average Directional Index) MACD Hareketli Ortalama Williams %R Momentum Ult
TouchGuard Alert – Advanced Price Alert & Notification Indicator for MetaTrader 5 (MT5) TouchGuard Alert is a fast, lightweight, and highly accurate price-touch Alert & Notification system designed for MetaTrader 4 (MT4) and MetaTrader 5 (MT5) . It automatically sends real-time Alerts, Pop-Up Alerts, Email Notifications, Push Notifications and early-warning notifications when price touches or approaches your chart objects. Key Features (High-Precision Alert & Notification System) Comprehensive P
Adaptive RSI is an advanced Relative Strength Index indicator. Adaptive RSI can change the look back period dynamically based on current market condition. Adaptive RSI adapts to the market changes as much as possible. Adaptive RSI is more advanced than conventional RSI.
Adaptive RSI is a tool to catch more over-bought/sold opportunities!
Features Dynamic look back period - Adaptive RSI changes the look back period dynamically basing on smartly designed adaptive methods. No worry about RSI peri
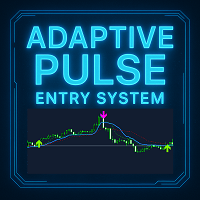
Adaptive Pulse - Profesyonel Ticaret Sinyalleri Sistemi Kısa Açıklama Adaptive Pulse, adaptif piyasa analizi teknolojisine dayanan profesyonel bir ticaret sinyali göstergesidir. Gösterge otomatik olarak volatiliteye uyum sağlar ve grafik üzerinde görsel oklar ile hassas alım ve satım sinyalleri üretir. Tüm zaman dilimlerinde ve finansal enstrümanlarda çalışır. Ana Özellikler Gösterge, her biri mevcut piyasa koşullarına göre ayarlanan üç bağımsız adaptif çizgiye sahip üç seviyeli bir analiz siste

Point and Fignure (P&F) chart plots price against changes in direction by plotting a column of Xs as the price rises and a column of Os as the price falls.
Features Support for several kinds of price types - High/Low and Close. Clean and easy-to-read chart. Displays column high and low prices as indicator values. Support for both 4 and 5-digit brokers. Customizeable colors.
Advantages Filter insignificant price movements and noise. Less noise and more stable work. Focus on important price move
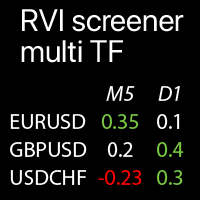
Seçilen Sembollerde Çoklu Zaman Dilimi RVI Değerleri: Mevcut Piyasa Trendlerini Karşılaştırın Gösterge , tüm seçilen zaman dilimleri ve Sembollerden Göreceli Canlılık Endeksi (RVI) değerlerini tek bir tabloda görüntüler, bu da mevcut piyasa fiyat trendlerini hızlı bir şekilde analiz etmenizi sağlar. Çok fonksiyonlu yardımcı programım : 66+ özellik | Sorularınız için bana ulaşın | MT4 sürümü Her Sembol özelleştirilebilir: kaldırılabilir veya değiştirilebilir. En fazla 40 Sembol ekle
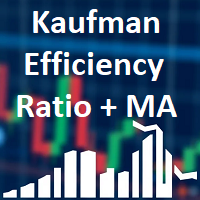
Shows Kaufman Efficiency Ratio value and smoothed by MA. Calculation is based on movement divided by volatility on a specified period. Levels are adjustable as well as visualization. Parameters: KERPeriod - period for ratio calculation. EMAPeriod - period for moving average. Shift - indicator shift. HigherLevel - low value of the higher zone. LowerLevel - high value of the lower zone. ShowHigherZone - allow higher zone drawing. HigherZoneColor - higher zone color. ShowLowerZone - allow lower zon

TradeEasy Panel - Professional Trading Control Panel Overview TradeEasy Panel is a comprehensive, professional-grade trading control panel designed for MetaTrader 5. This powerful indicator provides traders with an all-in-one solution for executing trades, managing positions, and monitoring market activity directly from the chart window. With its intuitive interface and advanced features, it streamlines the trading process for both novice and experienced traders. Key Features Real-Time Market M
Session Range Pro – Professional Session & ADR Analytics for MetaTrader 5 See what really moves the market – by session, by day, with stats that actually matter. What is Session Range Pro? Session Range Pro is a professional-grade MetaTrader 5 indicator that highlights the true behavior of price during the three main trading sessions: Asia London New York It draws clean, color-coded session ranges directly on your chart, and powers them with deep statistics : average session range, breakout win

Gamma & Volatility Levels Pro [XAUUSD Edition] – The indicator used by professional gold traders in 2025 Fully automatic indicator developed exclusively for XAUUSD (Gold). Displays in real time the most powerful institutional levels that move gold price every single day: • HVL (High Volatility Level) – Orange dashed line Dynamic extreme volatility level (20-period SMA + 1 standard deviation). Gold bounces or breaks this level 87 % of sessions with moves of +$40 to +$120. • CALL RESISTANCE – Blue
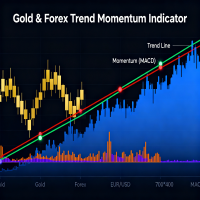
Overview QuantumEdge Oscillator is the ultimate momentum and trend detection tool for serious traders. After extensive testing and refinement, this professional indicator delivers reliable signals across all market conditions and timeframes. Used by discretionary traders and algorithmic systems worldwide. Advanced Algorithm The indicator employs a sophisticated dual-layer approach: Primary Engine : Exponential moving average applied to RSI for smooth momentum tracking Volatility Adjustment : Smo
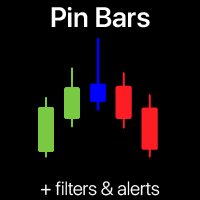
Pin Bar Deseni Tarayıcı | Akıllı Uyarılar ve Trend Filtresi Yüksek olasılıklı bir Pin Bar dönüşünü bir daha asla kaçırmayın! Bu otomatik Pin Bar Deseni tarayıcı ağır işi sizin için yapar.
Bu işlem aracı, grafiklerinizi gerçek zamanlı olarak tarar, güçlü Pin Bar (Çekiç/Akanyıldız) desenini tanımlar ve size anında sinyaller gönderir. İşlem göstergesi, tahmin yapmadan saf fiyat hareketinin gücünden yararlanmak isteyen hem yeni hem de uzman yatırımcılar için tasarlanmıştır. Benim çok fonksiyonlu

HolyGrail M N/B: All our product purchase comes with our free ‘’DAILY SCALPER EA’’ - bit.ly/4qlFLNh Whatsapp Developer for yours after successful purchase
m ost wanted Edition Overview ATTENTION ALL TRADERS!
FINALLY UNVEILED: The "HolyGrail MostWanted" Indicator - Your All-in-One Institutional Trading Dashboard for MetaTrader 5
SPECIAL BONUS (VALID TILL JUNE 2026)- OUR DAILY SCALPER EA for BTCUSD and VIX75 •·································································•
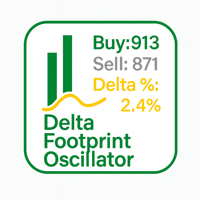
Delta Footprint Oscillator – Professional Order Flow Tool for MT5 The Delta Footprint Oscillator is a powerful order-flow indicator that lets you see buy/sell pressure directly inside your chart. It tracks micro-price movements tick-by-tick and calculates real-time Delta , Delta% , and a full per-bar footprint history .
Perfect for scalpers, day traders, volume/flow traders, and anyone who wants deeper insight into market aggression. Key Features Real order-flow delta from tick-based bid/ask m
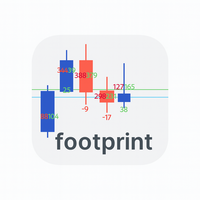
Footprint_Indicator_Fixed is a lightweight yet powerful footprint tool designed for traders who want real-time insight into market microstructure.
This indicator displays buy/sell tick counts and delta values directly on each candle, helping you instantly see which side of the market is dominant. Key Features ️ Real-time tick-based buy/sell volume counting ️ Delta footprint displayed underneath each candle ️ Clean and simple on-chart text objects—no buffers, no clutter ️ Automatic management
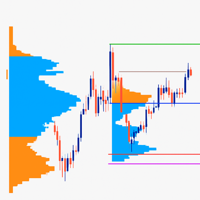
Daily Volume Profile (Multi-Day) for MT5 This indicator provides a clean, fast and highly optimized Daily Volume Profile for the last N days , updated automatically every minute without flickering or chart lag.
It draws full market structure: POC, VAH, VAL, Value Area, Day High/Low, Volume Distribution Buckets , and adapts dynamically to any timeframe using built-in shifting logic. Key Features:
Volume Profile for the last N days (configurable)
True daily POC, VAH, VAL with automatic labels
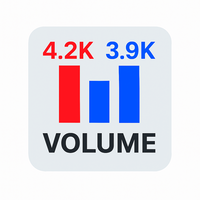
Volume Display Indicator – Clean and Powerful Volume Visualization This professional MT5 indicator displays tick volume as a color-coded histogram and automatically adds clear volume labels above each bar for the current trading day. Rising candles are painted blue, falling candles red, giving you instant insight into market strength and momentum. Key Features: Colored volume histogram (blue/red) Automatic volume labels for each bar of the current day Smart scaling for perfect readability Auto-c
MetaTrader Mağazası - yatırımcılar için alım-satım robotları ve teknik göstergeler doğrudan işlem terminalinde mevcuttur.
MQL5.community ödeme sistemi, MetaTrader Hizmetlerindeki işlemler için MQL5.com sitesinin tüm kayıtlı kullanıcıları tarafından kullanılabilir. WebMoney, PayPal veya banka kartı kullanarak para yatırabilir ve çekebilirsiniz.

Alım-satım fırsatlarını kaçırıyorsunuz:
- Ücretsiz alım-satım uygulamaları
- İşlem kopyalama için 8.000'den fazla sinyal
- Finansal piyasaları keşfetmek için ekonomik haberler
Kayıt
Giriş yap
Web sitesi politikasını ve kullanım şartlarını kabul edersiniz
Hesabınız yoksa, lütfen kaydolun