UR TrendExhaustion MT5

UR TrendExhaustion MT5


UR TrendExhaustion  MT5 is the best solution for traders who don't want to deal with parameter values nor other set-ups - it is both easy and visually-understandable for everyone.

Advantages of using UR TrendExhaustion MT5:
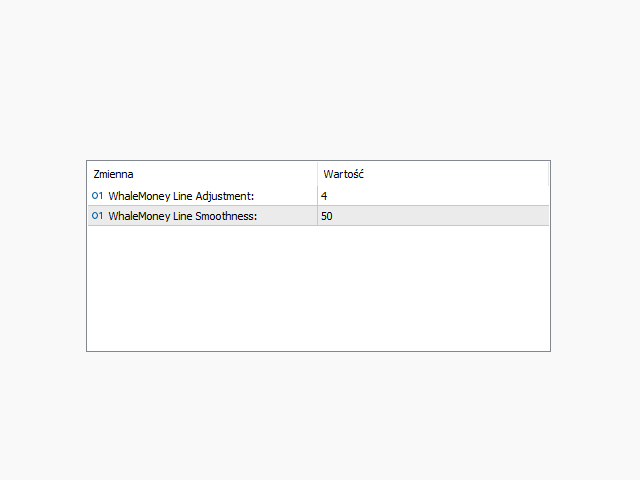
  1. No parameters
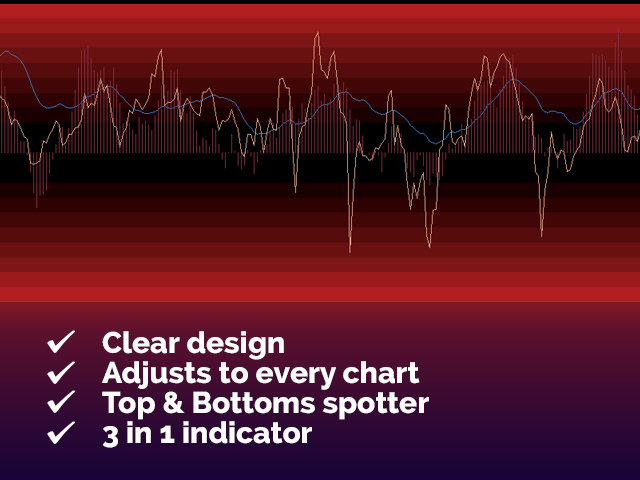
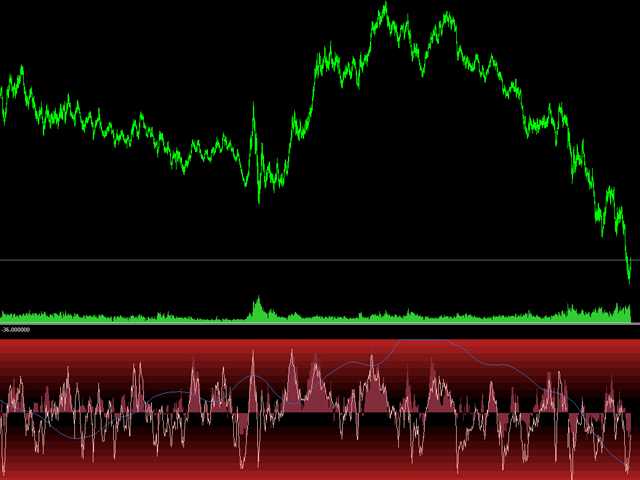
  2. You have 3 lines that describe best what's going on on the chart: Trend Exhaustion Line, Whale Money Line and Retail Money Line.
  3. The interface showcases the exhaustion of either line on both extremes (red areas)
  4. The best advantage: Easy and adjusted to all assets.

There is a special telegram chat on which you can stay up-to-date with the tools updates and also send request if you feel there is something missing!


Why UR 
TrendExhaustion MT5 ?

I have been coding many kinds of indicators throughout my career and got to a point where I gathered all my knowledge to code this simple and yet best (imo) tool to trade without the need of any other tool on the chart. Easy to understand, Easy to setup. The strategy is done in a way that it will be really hard for Market Makers to trade against it - checkmate MMs !
Any additional tool you use with UR TrendExhaustion MT5 will add to your trading, but I have been using it alone with great results. Good luck!

How to use UR TrendExhaustion  MT5 ?

There is a video on YT showing how to use the graphic panel, but also see description below to be more familiar with it:

SETTINGS
  • None

DISPLAY

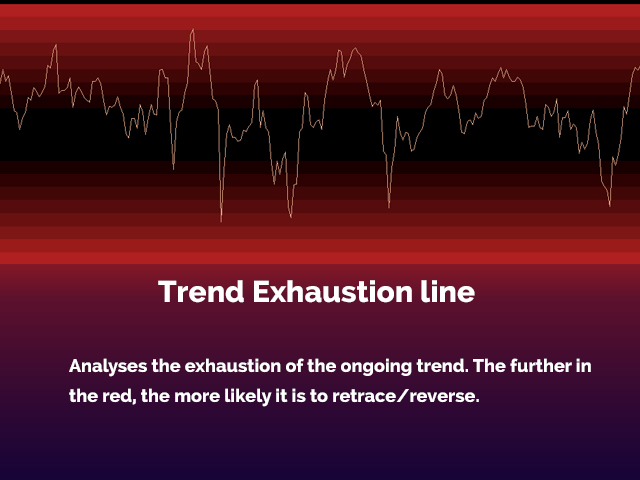
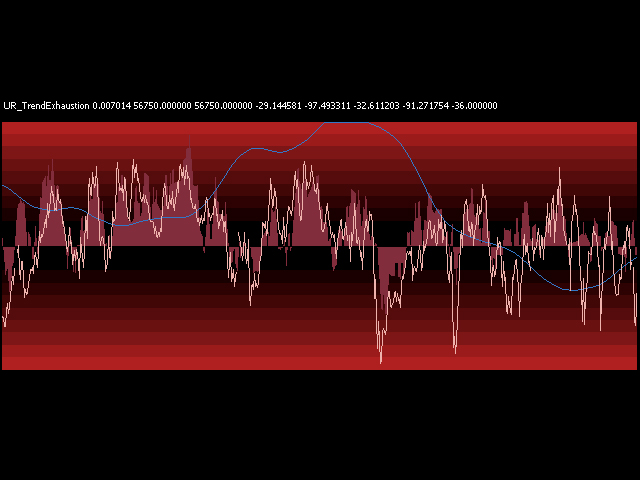
  • Trend Exhaustion Main Line: Shows the trend exhaustion. The more on the red, the higher chance of reversal.
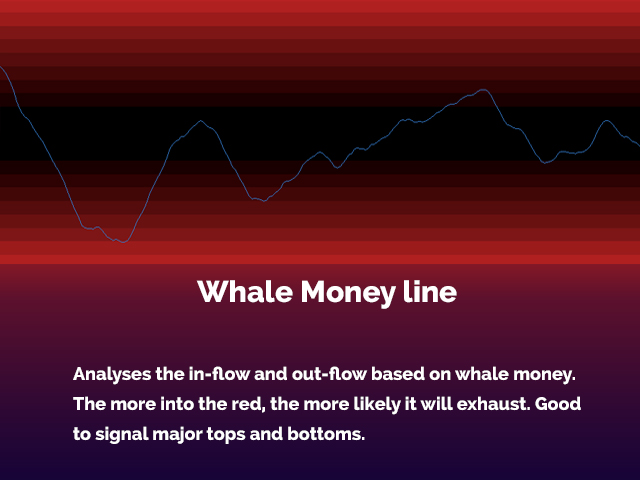
  • Whale Money Line (blue): Shows the Whale money-inflow - The higher it is - the more likely it is for whales to take a pause.
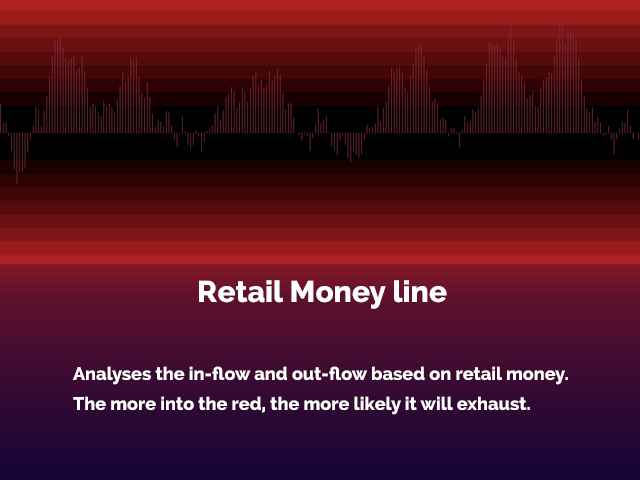
  • Retail Money Histogram:  Shows the Retail money-inflow - The higher it is - the drier retail gets.


ADDITION

  • All of my tools are working best when assembled. Meaning the accuracy of entry points is way better if used with UR DivergenceSpotter, UR VolumeTrend or/and UR HighsAndLows.

WWW -> https://urtradingcoder.carrd.co

Twitter -> https://twitter.com/URTradingCoder

Facebook -> https://www.facebook.com/profile.php?id=61559349091899

YouTube -> https://www.youtube.com/channel/UCihthoKQYrhj91jkUO8B1kg

MQL Store -> https://www.mql5.com/en/users/youreacoder/seller

Recommended products
Overview Harmonic Patterns MT5 is a technical analysis indicator designed for the MetaTrader 5 platform. It identifies and displays harmonic price patterns, such as Butterfly, Cypher, Crab, Bat, Shark, and Gartley, in both bullish and bearish directions. The indicator calculates key price levels, including entry, stop loss, and three take-profit levels, to assist traders in analyzing market movements. Visual elements and customizable alerts enhance usability on the chart. Features Detects six ha
Trade smarter, not harder: Empower your trading with Harmonacci Patterns This is arguably the most complete harmonic price formation auto-recognition indicator you can find for the MetaTrader Platform. It detects 19 different patterns, takes fibonacci projections as seriously as you do, displays the Potential Reversal Zone (PRZ) and finds suitable stop-loss and take-profit levels. [ Installation Guide | Update Guide | Troubleshooting | FAQ | All Products   |  Get Help ] It detects 19 differen
Monster Harmonics Indicator is a harmonic pattern indicator. It recognizes Gartley, Bat, Crab, Butterfly, Cypher, White Swan, Black Swan, Shark and AB=CD patterns. Projected patterns that are not yet completed are recognized, too. Monster even shows the PRZ (Potential Reversal Zone). Users can add their own user defined patterns to Monster. Besides the current pattern, Monster also shows all patterns in the symbols history. Monster will provide alerts for developing patterns. Introduced by H.M.
Volume Profile V6
Andrey Kolesnik
4.67 (3)
The volume profile indicator of the market + a smart oscillator. It works on almost all instruments-currency pairs, stocks, futures, cryptocurrency, on real volumes and on tick ones. You can set both the automatic definition of the profile range, for example, for a week or a month, etc., and set the range manually by moving the boundaries (two vertical lines red and blue). It is shown as a histogram. The width of the histogram at this level means, conditionally, the number of transactions condu
Noize Absorption Index - is the manual trading system that measures the difference of pressure between bears forces and bulls forces. Green line - is a noize free index that showing curent situation. Zero value of index shows totally choppy/flat market.Values above zero level shows how powerfull bullish wave is and values below zero measures bearish forces.Up arrow appears on bearish market when it's ready to reverse, dn arrow appears on weak bullish market, as a result of reverse expectation.
TRI Visualizer
Yoshimi Mon 三 Ura
TRI Visualizer MT5 – Thermodynamic Market Analysis Overview The TRI (Thermal Range Indicator) Visualizer Enhanced is a rare market analysis indicator that goes beyond conventional technical analysis, applying principles of thermodynamics from physics. It interprets market price fluctuations as “thermodynamic energy,” enabling the highly accurate detection of subtle market changes that are often overlooked. Innovative Mechanisms 1. Dual Calculation Engines Classic TRI Mode Formula: |Close
Premium level is a unique indicator with more than 80% accuracy of correct predictions! This indicator has been tested for more than two months by the best Trading Specialists! The author's indicator you will not find anywhere else! From the screenshots you can see for yourself the accuracy of this tool! 1 is great for trading binary options with an expiration time of 1 candle. 2 works on all currency pairs, stocks, commodities, cryptocurrencies Instructions: As soon as the red arrow app
"Impulses and Corrections 5" is created to help traders navigate the market situation. The indicator shows multi-time frame upward and downward "Impulses" of price movements. These impulses are the basis for determining the "Base" , which is composed of zones of corrections of price movements, as well as "Potential" zones for possible scenarios of price movement. Up and down impulses are determined based on a modified formula of Bill Williams' "Fractals" indicator. The last impulse is always "U
Precision trading: leverage wolfe waves for accurate signals Wolfe Waves are naturally occurring trading patterns present in all financial markets and represent a fight towards an equilibrium price. These patterns can develop over short and long-term time frames and are one of the most reliable predictive reversal patterns in existence, normally preceding strong and long price movements. [ Installation Guide | Update Guide | Troubleshooting | FAQ | All Products  |  Get Help ] Clear trading si
Introducing the Power Trade Plus indicator designed by a small group of traders with a few years of experience trading the market profitably.  The Power Trade Plus is derived from the Power Trade indicator,  the indicator strive in powerful sniper entries and take profit levels,  with an algorithm that's can determine the markets volatility and Provides entries based on the current market volatility. This indicator is much more effective in stock ,currencies and indices.
Price Magnet — Price Density and Attraction Levels Indicator Price Magnet is a professional analytical tool designed to identify key support and resistance levels based on statistical Price Density. The indicator analyzes a specified historical period and detects price levels where the market spent the most time. These zones act as “magnets,” attracting price action or forming a structural base for potential reversals. Unlike traditional Volume Profile tools, Price Magnet focuses on price-time d
##   ONLY GOLD ##   Тiльки Золото ## **Mercaria Professional Trading Zones - Complete Guide** ## **Mercaria Professional Trading Zones - Повний посібник** ### **How Mercaria Zones Work / Як працюють зони Mercaria** **English:** Mercaria Zones is an advanced trading indicator that identifies high-probability support and resistance areas using ZigZag extremes combined with mathematical zone calculations. The indicator works on multiple timeframes simultaneously, providing a comprehensive view
The   Fibonacci Confluence Toolkit   is a technical analysis tool designed to help traders identify potential price reversal zones by combining key market signals and patterns. It highlights areas of interest where significant price action or reactions are anticipated, automatically applies Fibonacci retracement levels to outline potential pullback zones, and detects engulfing candle patterns. Its unique strength lies in its reliance solely on price patterns, eliminating the need for user-define
Harmonic Pattern Structure Harmonic Pattern Structure is a professional MetaTrader 5 indicator that automatically detects classic harmonic patterns using strict Fibonacci ratio validation and XABCD price structure. Designed for traders who value precision, clean visuals, and structured analysis, the indicator highlights potential reversal zones based on price geometry, supporting consistent and objective decision-making. SUPPORTED HARMONIC PATTERNS Gartley (222) Butterfly Bat Crab Shark Cy
# DRAWDOWN INDICATOR V4.0 - The Essential Tool to Master Your Trading ## Transform Your Trading with a Complete Real-Time Performance Overview In the demanding world of Forex and CFD trading, **knowing your real-time performance** isn't a luxury—it's an **absolute necessity**. The **Drawdown Indicator V4.0** is much more than a simple indicator: it's your **professional dashboard** that gives you a clear, precise, and instant view of your trading account status. --- ## Why This Indicator
Universal Soul Reaper
Pieter Gerhardus Van Zyl
Universal Soul Reaper is an atmospheric market-flow oscillator designed to interpret price behavior as a cycle of spiritual energy. Instead of reacting to raw price alone, it visualizes the state of the market’s soul —revealing when momentum is awakening, stabilizing, or fading. The indicator operates in a separate window and presents three interwoven entities: the Ectoplasmic Veil , the Spirit Boundary , and the Soul Core . Together, they form a living framework that helps traders sense pressu
The indicator shows harmonic patterns on the chart without repainting with the minimum possible lag. The search for indicator tops is based on the wave principle of price analysis. Advanced settings allow you to choose parameters for your trading style. At the opening of a candle (bar), when a new pattern is formed, an arrow of the probable direction of the price movement is fixed, which remains unchanged. The indicator recognizes the following patterns and their varieties: ABCD, Gartley (Butter
Welcome to the Ultimate Harmonic Patterns recognition indicator that is focused to detect advanced patterns. The Gartley pattern, Bat pattern, and Cypher pattern  are popular technical analysis tools used by traders to identify potential reversal points in the market. Our Ultimate Harmonic Patterns recognition Indicator is a powerful tool that uses advanced algorithms to scan the markets and identify these patterns in real-time. With our Ultimate Harmonic Patterns recognition Indicator, you ca
Cumulative delta indicator As most traders believe, the price moves under the pressure of market buying or selling. When someone redeems an offer standing in the cup, the deal is a "buy". If someone pours into the bid standing in the cup - the deal goes with the direction of "sale". The delta is the difference between purchases and sales. A cumulative delta - the difference between the cumulative sum of purchases and sales for a certain period of time. It allows you to see who is currently contr
Triangle Pattern Gann v3.1 - Complete Feature Documentation Core Functionality OverviewTriangle Pattern Gann v3.1 is a sophisticated MetaTrader 5 indicator that combines W.D. Gann's geometric trading principles with advanced triangle pattern recognition to deliver actionable trading signals. Primary Features1. Triangle Pattern Detection SystemAscending Triangle Recognition Function: Automatically identifies bullish continuation patterns Detection Criteria: Flat horizontal resistance line
Harmonic Pattern Hunter Harmonic Pattern Hunter is a technical indicator for MetaTrader 5 that automatically identifies and draws high-probability harmonic patterns directly on the chart. It is designed to assist traders who use harmonic analysis as part of their trading methodology. How It Works The indicator scans historical and live price data for completed XABCD harmonic structures using Fibonacci ratio validation. When a valid pattern is detected, it draws the full pattern geometry, marks t
RBreaker
Zhong Long Wu
RBreaker Gold Indicators is a short-term intraday trading strategy for gold futures that combines trend following and intraday reversal approaches. It not only captures profits during trending markets but also enables timely profit-taking and counter-trend trading during market reversals. This strategy has been ranked among the top ten most profitable trading strategies by the American magazine   Futures Truth   for 15 consecutive years. It boasts a long lifecycle and remains widely used and st
Level Volume Pro
John Samfel Bucton Josol
HAT IT DOES   MONTHLY HIGH & LOW — AUTO-DRAWN EVERY MONTH Draws the High and Low of every month for the current year (or any year you set). Each level extends as a horizontal ray into the future so you always see where price is reacting to historical monthly extremes. Color-coded (blue = high, red = low), labeled (JAN HIGH, FEB LOW etc.), fully customizable width and style. Toggle individual months on or off.   WEEKLY HIGH & LOW
**   All Symbols   x   All Timeframes   scan just by pressing scanner button ** Discount: The price is $50$, But now it is just $39, Limited time offer is active. *** Contact me  to send you instruction and add you in "Trend Reversal group" for sharing or seeing experiences with other users. Introduction: Trendlines are the most famous technical analysis in trading . Trendlines continually form on the charts of markets across all the different timeframes providing huge opportunities for traders
KT Renko Patterns MT5
KEENBASE SOFTWARE SOLUTIONS
KT Renko Patterns scans the Renko chart brick by brick to find some famous chart patterns that are frequently used by traders across the various financial markets. Compared to the time-based charts, patterns based trading is easier and more evident on Renko charts due to their uncluttered appearance. KT Renko Patterns features multiple Renko patterns, and many of these patterns are extensively explained in the book titled Profitable Trading with Renko Charts by Prashant Shah. A 100% automated
Rainbow EA MT5
Jamal El Alama
Description : Rainbow EA MT5 is a simple Expert advisor based on   Rainbow MT5 indicator witch is based on Moving average with period 34. The indicator is incorporated in the EA, therefore, it is not required for the EA to operate, but if you wish, you can download it from   my product page . The Expert Advisor settings are as follows : Suitable for Timeframes up to H1 The parameters below can be set according to your trading rules. StopLoss ( Stop Loss in pips) TakeProfit ( Take Profit in pips
Was: $249  Now: $99   Market Profile defines a number of day types that can help the trader to determine market behaviour. A key feature is the Value Area, representing the range of price action where 70% of trading took place. Understanding the Value Area can give traders valuable insight into market direction and establish the higher odds trade. It is an excellent addition to any system you may be using. Inspired by Jim Dalton’s book “Mind Over Markets”, this indicator is designed to suit the
The SMC Venom Model BPR indicator is a professional tool for traders working within the Smart Money (SMC) concept. It automatically identifies two key patterns on the price chart: FVG   (Fair Value Gap) is a combination of three candles, in which there is a gap between the first and third candles. It forms a zone between levels where there is no volume support, which often leads to a price correction. BPR   (Balanced Price Range) is a combination of two FVG patterns that form a “bridge” - a zon
Volume Delta Candle
Muhammad Muzaffar Hussan
Volume Delta Candles: A Comprehensive Tool for In-Depth Trading Analysis Unlock a seamless way to interpret trading experience within each candle. With Volume Delta Candles, there's no need for additional volume indicators—everything you need is built in. This advanced tool utilizes lower timeframes or live market data to present the percentage of buying versus selling volume within each candle as an intuitive color-coded bar. Before diving in, ensure you’re familiar with Volume and Volume Delta
The WaveTrend Oscillator MT5 is a powerful trading indicator designed to enhance your market analysis by identifying momentum shifts and potential trend reversals. Ideal for traders of all levels, this tool offers valuable insights into overbought and oversold conditions across various markets, including forex, cryptocurrencies, and commodities. With its ability to generate accurate buy and sell signals, the WaveTrend Oscillator MT5 empowers traders to make informed decisions, effectively increa
Buyers of this product also purchase
Divergence Bomber
Ihor Otkydach
4.9 (87)
Each buyer of this indicator also receives the following for free: The custom utility "Bomber Utility", which automatically manages every trade, sets Stop Loss and Take Profit levels, and closes trades according to the rules of this strategy Set files for configuring the indicator for various assets Set files for configuring Bomber Utility in the following modes: "Minimum Risk", "Balanced Risk", and "Wait-and-See Strategy" A step-by-step video manual to help you quickly install, configure, and s
Power Candles MT5
Daniel Stein
5 (7)
Power Candles V3 - The First Self-Optimizing Strength Indicator Power Candles V3 turns strength analysis into an actionable trading system. Instead of just coloring your chart by market strength, it now runs a live auto-optimization in the background and hands you the best Stop Loss, Take Profit and signal threshold for your symbol. One click adopts it for live trading. This tool is part of the Stein Investments ecosystem.  Browse all 18 tools, get AI-powered setup recommendations,  and join th
Grabber System MT5
Ihor Otkydach
4.83 (23)
Let me introduce you to an excellent technical indicator – Grabber, which works as a ready-to-use "All-Inclusive" trading strategy. Within a single code, it integrates powerful tools for technical market analysis, trading signals (arrows), alert functions, and push notifications. Every buyer of this indicator also receives the following for free: Grabber Utility for automatic management of open orders Step-by-step video guide: how to install, configure, and trade with the indicator Custom set fi
New Update of   Smart Trend Trading System MT5 For  2026 Market: If You Buy this Indicator you will Get my Professional Trade Manager + EA  for FREE . First of all Its worth emphasizing here that this Trading System is Non-Repainting   , Non Redrawing and Non Lagging Indicator Which makes it ideal from both manual and robot trading .  [Online course] , [manual] and [download presets] . The Smart Trend Trading System MT5 is a comprehensive trading solution tailored for new and experienced traders
SignalTech MT5 is a trading system for EURUSD, USDCHF, USDJPY, AUDUSD, NZDUSD, EURJPY, AUDJPY, NZDJPY, CADJPY H2 and H3 Timeframe.  It can generate signals with Buy/Sell Arrows and Pop-Up/Sound Alerts. Each signal has clear Entry and Stop Loss levels, which should be automatically flagged on the chart, as well as potential Targets 1, 2, and 3. The Entry and TP levels are fixed after the trade is taken. The exit level is dynamic. If there are signs of a potential short-term trend reversal, the
Trend Screener Pro MT5
STE S.S.COMPANY
4.85 (104)
Trend Screener Indicator --Professional Trend Trading & Market Scanning System for MetaTrader Unlock the true power of trend trading with Trend Screener Indicator — a complete multi-currency, multi-timeframe trend analysis solution powered by Fuzzy Logic,Trend Pulse Technology  and advanced market structure algorithms.   Trend Screener transforms your MetaTrader platform into a professional-grade Trend Analyzer and Market Scanner, helping you identify high-probability trend opportunities, early
Introducing   Quantum Breakout PRO , the groundbreaking MQL5 Indicator that's transforming the way you trade Breakout Zones! Developed by a team of experienced traders with trading experience of over 13 years,   Quantum Breakout PRO   is designed to propel your trading journey to new heights with its innovative and dynamic breakout zone strategy. Quantum Breakout Indicator will give you signal arrows on breakout zones with 5 profit target zones and stop loss suggestion based on the breakout b
Top indicator for MT5   providing accurate signals to enter a trade without repainting! It can be applied to any financial assets:   forex, cryptocurrencies, metals, stocks, indices .  Watch  the video  (6:22) with an example of processing only one signal that paid off the indicator! MT4 version is here It will provide pretty accurate trading signals and tell you when it's best to open a trade and close it. Most traders improve their trading results during the first trading week with the help of
Quantum TrendPulse
Bogdan Ion Puscasu
5 (23)
Introducing Quantum TrendPulse , the ultimate trading tool that combines the power of SuperTrend , RSI , and Stochastic into one comprehensive indicator to maximize your trading potential. Designed for traders who seek precision and efficiency, this indicator helps you identify market trends, momentum shifts, and optimal entry and exit points with confidence. Key Features: SuperTrend Integration: Easily follow the prevailing market trend and ride the wave of profitability. RSI Precision: Detect
Azimuth Pro
Ottaviano De Cicco
5 (7)
Azimuth Pro V2: Synthetic Fractal Structure and Confirmed Entries for MT5 Overview Azimuth Pro is a multi-level swing structure indicator by Merkava Labs . Four nested swing layers, swing-anchored VWAP, ABC pattern detection, three-timeframe structural filtering, and closed-bar confirmed entries — one chart, one workflow from micro-swings to macro-cycles. This is not a blind signal product. It is a structure-first workflow for traders who care about location, context, and timing. V2 Launch Offe
Atomic Analyst MT5
Issam Kassas
3.94 (31)
New Update of   Atomic Analyst MT5 For  2026 Market: If You Buy this Indicator you will Get my Professional   Trade Manager + EA  for   FREE . First of all Its worth emphasizing here that this Trading Indicator is   Non-Repainting   , Non Redrawing and Non Lagging Indicator   Indicator, Which makes it ideal from both manual and robot trading.  User manual: settings, inputs and strategy . The Atomic Analyst  is a PA Price Action Indicator that uses Strength and Momentum of the price to find a bet
Meravith MT5
Ivan Stefanov
5 (1)
MERAVITH provides complete liquidity map of the analyzed market. Hedge funds tool. It performs all calculations automatically using a proprietary volume-weighted average price methodology, eliminating subjective interpretation entirely. Meravith will: Analyze all timeframes and display the current trend in force. Highlight liquidity zones (volume equilibrium) where bullish and bearish volumes are equal. Display all liquidity levels across different timeframes directly on your chart. Generate an
Btmm state engine pro
Garry James Goodchild
5 (4)
BTMM State Engine Pro is a MetaTrader 5 indicator for traders who use the Beat The Market Maker approach: Asian session context, kill zone timing, level progression, peak formation detection, and a multi-pair scanner from a single chart. It combines cycle state logic with a built-in scanner dashboard so you do not need the same tool on many charts at once. What it does Draws the Asian session range; session times can follow broker server offset or be set in inputs. Tracks level progression (L
FX Trend MT5 NG
Daniel Stein
5 (4)
FX Trend NG: The Next Generation Multi-Market Trend Intelligence Overview FX Trend NG is a professional multi-timeframe trend and market monitoring tool designed to give you a complete structural overview of the market in seconds. Instead of switching between dozens of charts, you instantly see which symbols are trending, where momentum is fading, and where strong alignment exists across timeframes. This tool is part of the Stein Investments ecosystem.  Browse all 18 tools, get AI-powered set
This dashboard shows the latest available   harmonic patterns   for the selected symbols, so you will save time and be more efficient /   MT4 version . Free Indicator:   Basic Harmonic Pattern Comparison of "Basic Harmonic Pattern" vs. "Basic Harmonic Patterns Dashboard" Indicators Feature Basic Harmonic Pattern Basic Harmonic Patterns Dashboard Functionality Detects and displays harmonic patterns on a single chart Searches multiple symbols and timeframes for harmonic patterns, displays res
OmniSync Projection
Antonio-alin Teculescu
5 (1)
Chronos Fractal Engine is an innovative price projection indicator for MetaTrader 5, designed to transform your technical analysis by intelligently identifying and projecting historical price patterns. Built upon an advanced correlation algorithm and the fractal principles of the market, this powerful tool visualizes potential future price movements, giving you a unique edge in your trading decisions. What is Chronos Fractal Engine? At its core, the Chronos Fractal Engine employs a sophisticat
RelicusRoad Pro: Quantitative Market Operating System 70% OFF LIFETIME ACCESS (LIMITED TIME) - JOIN 2,000+ TRADERS Why do most traders fail even with "perfect" indicators? Because they trade Single Concepts in a vacuum. A signal without context is a gamble. To win consistently, you need CONFLUENCE . RelicusRoad Pro is not a simple arrow indicator. It is a complete Quantitative Market Ecosystem . It maps the "Fair Value Road" price travels on, distinguishing between random noise and true structur
Bill Williams Advanced
Siarhei Vashchylka
5 (11)
Bill Williams Advanced is designed for automatic chart analysis using Bill Williams' "Profitunity" system. The indicator analyzes four timeframes at once. Manual (Be sure to read before purchasing) Advantages 1. Analyzes the chart using Bill Williams' "Profitunity" system. Signals are displayed in a table in the corner of the screen and on the price chart. 2. Finds all known AO and AC signals, as well as zone signals. Equipped with a trend filter based on the Alligator. 3. Finds "Divergence Bar
ARICoins
Temirlan Kdyrkhan
ARICoin is a powerful trading companion designed to generate high-probability entry signals with dynamic TP/SL/DP levels based on volatility. Built-in performance tracking shows win/loss stats, PP1/PP2 hits, and success rates all updated live. Key Features: Buy/Sell signals with adaptive volatility bands Real-time TP/SL/DP levels based on ATR Built-in MA Filter with optional ATR/StdDev volatility Performance stats panel (Success, Profit/Loss, PP1/PP2) Alerts via popup, sound, push, or email Cust
FX Power MT5 NG
Daniel Stein
5 (31)
FX Power: Analyze Currency Strength for Smarter Trading Decisions Overview FX Power is your go-to tool for understanding the real strength of currencies and Gold in any market condition. By identifying strong currencies to buy and weak ones to sell, FX Power simplifies trading decisions and uncovers high-probability opportunities. Whether you’re looking to follow trends or anticipate reversals using extreme delta values, this tool adapts seamlessly to your trading style. Don’t just trade—trade
Meridian Pro
Ottaviano De Cicco
5 (1)
Meridian Pro: Professional Multi-Timeframe Trend Matrix for MT5 Overview Meridian Pro is a multi-timeframe trend matrix by Merkava Labs that compresses directional state, strength, momentum condition and matrix agreement into one compact panel. One adaptive engine, applied consistently from M1 to W1. No per-symbol tuning. No indicator stacking. One structured readout across every asset and every timeframe. Launch Offer — Get Meridian Pro for USD 99 (introductory). Regular price: USD 149. 1. Why
META Points PRO MT5
Polina Balahura
5 (1)
META Points PRO     — is a trend-following tool that takes the guesswork out of trading and shows where the market has already made its decision. The indicator identifies key points where trends, trends, and structures change, and highlights areas where the price returns for major players to take positions. You don't just see the movement — you understand the logic behind it. All signals are recorded after the candle closes, are not redrawn, and are saved on the chart, allowing you to confidentl
Advanced Supply Demand MT5
Bernhard Schweigert
4.53 (15)
Best Solution for any Newbie or Expert Trader! This indicator is a unique, high quality and affordable trading tool because we have incorporated a number of proprietary features and a new formula. With this update, you will be able to show double timeframe zones. You will not only be able to show a higher TF but to show both, the chart TF, PLUS the higher TF: SHOWING NESTED ZONES. All Supply Demand traders will love it. :) Important Information Revealed Maximize the potential of Advanced Supply
Gann Squares Indicator: Analyzing Markets with Geometric Patterns The Gann Squares indicator is a powerful tool for market analysis that draws upon the mathematical concepts introduced by W.D. Gann in his article on "Mathematical Formula for Market Predictions." This indicator incorporates Gann's techniques involving square numbers such as 144, 90, and 52, as well as the Square of 9. Additionally, it incorporates  method for utilizing the Square of 9 in conjunction with channels and the star pa
Cvd Divergence
Thalles Nascimento De Carvalho
CVD Divergence – Professional Flow and Divergence Analysis CVD Divergence is a technical indicator designed to detect reliable divergences between price and Cumulative Delta Volume (CVD). It accurately identifies moments when the real order flow does not confirm the price movement, revealing potential reversals, exhaustion points, and institutional manipulation. The indicator combines aggressive volume analysis with structural price reading, delivering clear, objective, and early signals. What t
Gartley Hunter Multi
Siarhei Vashchylka
5 (11)
Gartley Hunter Multi - An indicator for searching for harmonic patterns simultaneously on dozens of trading instruments and on all possible timeframes. Manual (Be sure to read before purchasing) | Version for MT4 Advantages 1. Patterns: Gartley, Butterfly, Shark, Crab. Bat, Alternate Bat, Deep Crab, Cypher 2. Simultaneous search for patterns on dozens of trading instruments and on all possible timeframes 3. Search for patterns of all possible sizes. From the smallest to the largest 4. All fou
The " Dynamic Scalper System MT5 " indicator is designed for the scalping method of trading within trend waves. Tested on major currency pairs and gold, compatibility with other trading instruments is possible. Provides signals for short-term opening of positions along the trend with additional price movement support. The principle of the indicator. Large arrows determine the trend direction. An algorithm for generating signals for scalping in the form of small arrows operates within trend wav
Presenting one-of-a-kind Gann Indicator for XAUUSD IQ Gold Gann Levels is a non-repainting, precision tool designed exclusively for XAUUSD/Gold intraday trading. It uses W.D. Gann’s square root method to plot real-time support and resistance levels, helping traders spot high-probability entries with confidence and clarity. William Delbert Gann (W.D. Gann) was an exceptional market analyst whose trading technique was based on a complex blend of mathematics, geometry, astrology, and ancient calcul
Scalping Winning Signals Pro SWS
Muhammad Usman Siddique
5 (1)
The UZFX SWS {Scalping Winning Signals} Pro Advanced v2.0 is a powerful, non-repainting indicator developed by Usman Zabir (UZFX LABS) specifically for scalpers, day traders, and swing traders seeking precise entry signals in fast-moving markets.  Ideal for traders who demand reliable, real-time signals without lag or false repaints. I RECOMMENDED*  BEST   TIME FRAMES : 15M AND ABOVE.. {1H} IS MY FAVORITE. AND RESULTS ARE MIND BLOWING...! Key Features Include: Clear visual arrows for recent a
Berma Bands
Muhammad Elbermawi
5 (8)
The Berma Bands (BBs) indicator is a valuable tool for traders seeking to identify and capitalize on market trends. By analyzing the relationship between the price and the BBs, traders can discern whether a market is in a trending or ranging phase. Visit the [ Berma Home Blog ] to know more. Berma Bands are composed of three distinct lines: the Upper Berma Band, the Middle Berma Band, and the Lower Berma Band. These lines are plotted around the price, creating a visual representation of the pric
More from author
UR Gamma MT5
Krzysztof Jan Debski
UR Gamma MT5 (powered by similar calculations found in Machine Learning systems) UR Gamma MT5   is a cutting-edge financial analysis tool that offers a new and improved take on the classic WaveTrend indicator. By incorporating advanced Digital Signal Processing techniques, UR Gamma addresses some of the limitations of traditional WaveTrend algorithms and provides a more accurate, robust and dynamic approach to identifying and measuring trends in price action. Advantages of using UR Gamma MT5 :
UR HighsAndLows MT5
Krzysztof Jan Debski
UR Highs&Lows MT5  UR Highs&Lows MT5 does an in-depth analysis of price movement and its volatility, and creates a channel within which the price is moving. That channel moves now as an oscillator and is overlayed with price's deviation to signal potential exhaustions and possible reversals. Advantages of using UR Highs&Lows MT5 : No parameters You have 3 lines that describe the price movement - White Line which is an average of the price, and Blue Lines which are its extremes The histogram is a
UR Control Panel
Krzysztof Jan Debski
5 (2)
UR Control Panel   UR   Control Panel is a tool I want to share with you for FREE. It is an interactive Panel that helped me in my trading and boosted my market scanning each day. Hope it suits your needs aswell! How to use UR   Control Panel  ? It is an movable, resizable double panel of which: - One of them shows the currency strenght on the given timeframe - The other enables options to move between symbols and timeframes way quicker, using the same chart, and additionally shows resistance/su
FREE
UR Basket
Krzysztof Jan Debski
UR Basket   The best you can do is to protect your orders from turning into losses. You can now relax and let UR Basket take care of it. Advantages of using UR Basket: All parameters are dynamically changeable in the graphic panel on your chart - You DON'T need to restart the EA to change the parameters or recall what settings you used! You can track your orders through:  - Magic Number  - EA Comment  - Both of the above  - All of your trades at once UR Basket can track your profits through your
UR DivergenceSpotter
Krzysztof Jan Debski
UR DivergenceSpotter   UR   DivergenceSpotter is the result of many years of experience and sometimes the easiest ways are the best. There is a good correlation between a few indicators, but when they mismatch - the price tries to "re-adjust" - and it's at that moment when we get a signal with UR DivergenceSpotter. Advantages of using UR Divergence Spotter: No parameters Doesn't repaint after the candle is created Signals when the signal is not valid anymore (meaning that you can hold your trade
UR VolumeTrend
Krzysztof Jan Debski
UR VolumeTrend   UR  VolumeTrend is the clearest volume indicator showing the ongoing trend in terms of volume. Works perfectly with other indicators just like UR TrendExhaustion to signal local tops and bottoms. Limited to just 2 parameters - the higher values, the longer trends it will show.  Gradient extremes show possible exhaustions of volume to catch a potential reversal. Two lines - The Volume trend and It's average. The best advantage: Easy and adjusted to all assets. There is a special
UR TrendExhaustion
Krzysztof Jan Debski
UR TrendExhaustion   UR   TrendExhaustion is the best solution for traders who don't want to deal with parameter values nor other set-ups - it is both easy and visually-understandable for everyone. Advantages of using UR TrendExhaustion: No parameters You have 3 lines that describe best what's going on on the chart:   Trend Exhaustion Line ,   Whale Money Line   and   Retail Money Line . The interface showcases the exhaustion of either line on both extremes (red areas) The best advantage: Easy a
UR HighsAndLows
Krzysztof Jan Debski
UR Highs&Lows  UR Highs&Lows does an in-depth analysis of price movement and its volatility, and creates a channel within which the price is moving. That channel moves now as an oscillator and is overlayed with price's deviation to signal potential exhaustions and possible reversals. Advantages of using UR Highs&Lows : No parameters You have 3 lines that describe the price movement - White Line which is an average of the price, and Blue Lines which are its extremes The histogram is a visualizati
UR Momenter
Krzysztof Jan Debski
UR Momenter   UR   Momenter calculates perfectly the momentum of the price in correlation to the exhaustion of the price movement represented as an oscillator. Therefore this gives us really early signals of potential reversals or retracements. This formula was discovered in 2018 after market bubble burst. Advantages of using UR   Momenter   : No parameters You have 2 lines that describe the price movement - White Line which is the Momentum of the price in correlation to price's moving average d
UR FrontEndBackEnd
Krzysztof Jan Debski
UR FrontEndBackEnd   UR FrontEndBackEnd   is my favorite formula for finding the most accurate levels of support and resistance. I have also splitted those into different categories (dashed lines, solid lines and areas) to mark how strong they are. All is stored in buffers so they are easy to access and implement within other tools. Addition : The tool may need to be adjusted to the asset it is applied on - asset's differ in terms of nr of digis in the price which affects the tool. The needed p
UR Gamma
Krzysztof Jan Debski
UR Gamma (powered by similar calculations found in Machine Learning systems) UR Gamma is a cutting-edge financial analysis tool that offers a new and improved take on the classic WaveTrend indicator. By incorporating advanced Digital Signal Processing techniques, UR Gamma addresses some of the limitations of traditional WaveTrend algorithms and provides a more accurate, robust and dynamic approach to identifying and measuring trends in price action. Advantages of using UR Gamma: Minimalistic
UR Bands
Krzysztof Jan Debski
UR Bands (with a Formula used in Machine Learning systems) UR Bands is an indicator derived through a formula that incorporates market volatility is similar in principle to those used in machine learning systems. This mathematical representation of market conditions offers a precise analysis of price trends and dynamics, taking into account the inherent volatility of financial markets. By incorporating volatility as a variable, the indicator provides a more accurate and dependable representation
UR Vortex
Krzysztof Jan Debski
UR Vortex The Probabilistic UR Vortex Formula: An Accurate System for Predictive Market Analysis using Volatility and Standard Deviation Calculations. The   UR Vortex   indicator is a technical analysis tool that uses volatility and standard deviation calculations to predict potential tops and bottoms in a market. It measures the strength of a trend by calculating the distance between the current price and a moving average, and then standardizing this distance by dividing it by the average true
UR PulseScalp
Krzysztof Jan Debski
UR PulseScalp A calibrated trading indicator for scalpers seeking the ultimate edge in fast-paced markets UR PulseScalp is a cutting-edge trading solution for scalpers seeking the ultimate edge in fast-paced markets. This innovative indicator is built on a scientifically-calibrated formula that blends the power of Volatility, MoneyFlow and Relative Strength to create a highly accurate and reliable signal. Advantages of using UR  PulseScalp : Comfortable Interactive Panel Highly Accurate on M5
UR TradeManager
Krzysztof Jan Debski
UR_TradeManager for MetaTrader 4 Initial words Hey Trader! Fist of all - this tool is created by a trader that codes, not by a coder that trades. Therefore it is minimalistic in UI, but maximizes automation and processes so the user doesn't have to rely heavily on the documentation to get to know the workflow. Also the Labels are formatted in comprehensible way, and my main goal was to provide a tool that is understandable to the user, no matter what kind of trading background he has. The tool i
UR Basket MT5
Krzysztof Jan Debski
UR Basket MT5   The best you can do is to protect your orders from turning into losses. You can now relax and let UR Basket take care of it. Advantages of using UR Basket: All parameters are dynamically changeable in the graphic panel on your chart - You DON'T need to restart the EA to change the parameters or recall what settings you used! You can track your orders through:  - Magic Number  - EA Comment  - Both of the above  - All of your trades at once UR Basket can track your profits through
UR DivergenceSpotter MT5   UR   DivergenceSpotter MT5 is the result of many years of experience and sometimes the easiest ways are the best. There is a good correlation between a few indicators, but when they mismatch - the price tries to "re-adjust" - and it's at that moment when we get a signal with UR DivergenceSpotter MT5. Advantages of using UR Divergence Spotter MT5: No parameters Doesn't repaint after the candle is created Signals when the signal is not valid anymore   (meaning that you c
UR VolumeTrend MT5
Krzysztof Jan Debski
UR VolumeTrend MT5   UR  VolumeTrend MT5 is the clearest volume indicator showing the ongoing trend in terms of volume. Works perfectly with other indicators just like UR TrendExhaustion to signal local tops and bottoms. Limited to just 2 parameters - the higher values, the longer trends it will show.  Gradient extremes show possible exhaustions of volume to catch a potential reversal. Two lines - The Volume trend and It's average. The best advantage: Easy and adjusted to all assets. There is a
UR Momenter MT5
Krzysztof Jan Debski
UR Momenter MT5   UR   Momenter  MT5 calculates perfectly the momentum of the price in correlation to the exhaustion of the price movement represented as an oscillator. Therefore this gives us really early signals of potential reversals or retracements. This formula was discovered in 2018 after market bubble burst. Advantages of using UR     Momenter MT5   : No parameters You have 2 lines that describe the price movement - White Line which is the Momentum of the price in correlation to price's m
UR FrontEndBackEnd MT5   UR FrontEndBackEnd MT5   is my favorite formula for finding the most accurate levels of support and resistance. I have also splitted those into different categories (dashed lines, solid lines and areas) to mark how strong they are. All is stored in buffers so they are easy to access and implement within other tools. Addition : The tool may need to be adjusted to the asset it is applied on - asset's differ in terms of nr of digis in the price which affects the tool. The
UR Bands MT5
Krzysztof Jan Debski
UR Bands MT5 (with a Formula used in Machine Learning systems) UR Bands MT5   is a n indicator derived through a formula that incorporates market volatility is similar in principle to those used in machine learning systems. This mathematical representation of market conditions offers a precise analysis of price trends and dynamics, taking into account the inherent volatility of financial markets. By incorporating volatility as a variable, the indicator provides a more accurate and dependable rep
UR Vortex MT5
Krzysztof Jan Debski
UR Vortex MT5 The Probabilistic UR Vortex Formula: An Accurate System for Predictive Market Analysis using Volatility and Standard Deviation Calculations. The UR Vortex MT5 indicator is a technical analysis tool that uses volatility and standard deviation calculations to predict potential tops and bottoms in a market. It measures the strength of a trend by calculating the distance between the current price and a moving average, and then standardizing this distance by dividing it by the average t
UR PulseScalp MT5
Krzysztof Jan Debski
UR PulseScalp MT5 A calibrated trading indicator for scalpers seeking the ultimate edge in fast-paced markets UR PulseScalp MT5 is a cutting-edge trading solution for scalpers seeking the ultimate edge in fast-paced markets. This innovative indicator is built on a scientifically-calibrated formula that blends the power of Volatility, MoneyFlow and Relative Strength to create a highly accurate and reliable signal. Advantages of using UR PulseScalp MT5: Comfortable Interactive Panel Highly Accura
UR TradeManager MT5
Krzysztof Jan Debski
UR_TradeManager for MetaTrader 5 Initial words Hey Trader! Fist of all - this tool is created by a trader that codes, not by a coder that trades. Therefore it is minimalistic in UI, but maximizes automation and processes so the user doesn't have to rely heavily on the documentation to get to know the workflow. Also the Labels are formatted in comprehensible way, and my main goal was to provide a tool that is understandable to the user, no matter what kind of trading background he has. The tool i
Filter:
No reviews
Reply to review