Ehlers Instantaneous Trend MT5
- Indikatoren
-
Libertas LLC
 Libertas LLC is a software company by enterprising math nerds. We make high quality and complex mathematical tools in a user-friendly and easy to use package for retail investors.
 - Version: 1.0
- Aktivierungen: 20
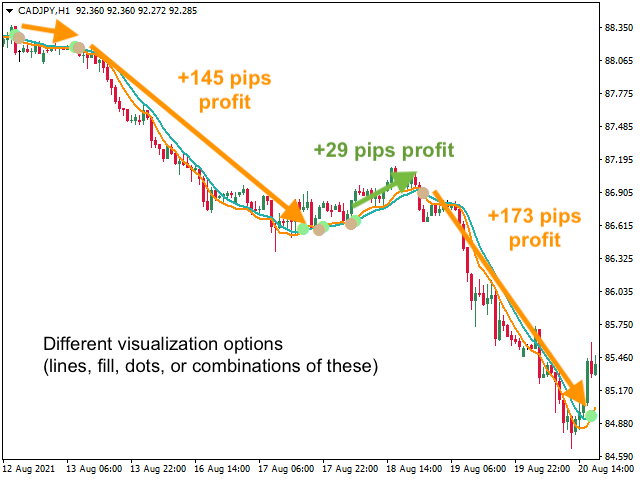
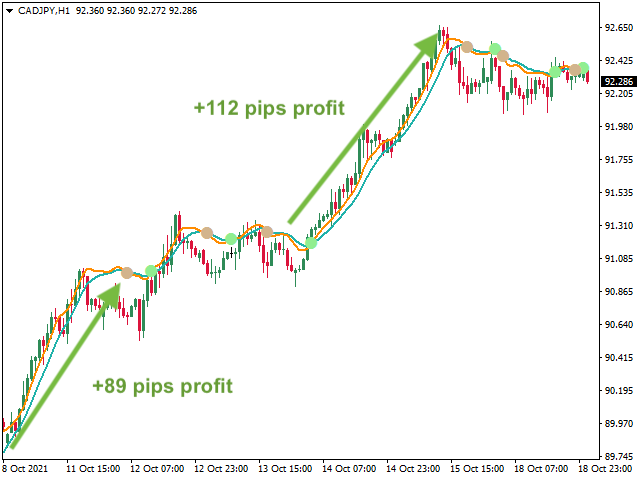
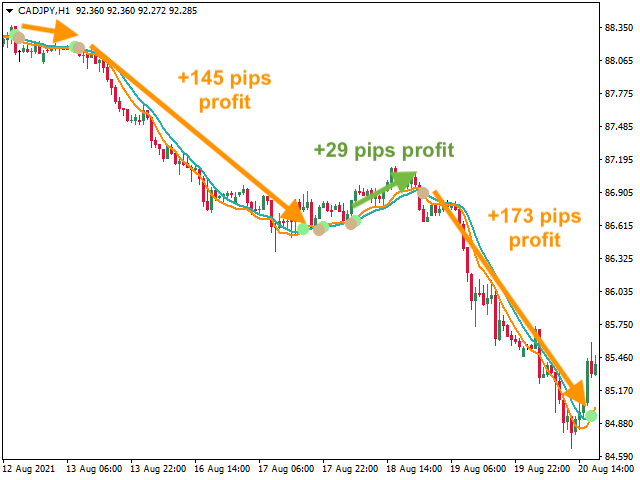
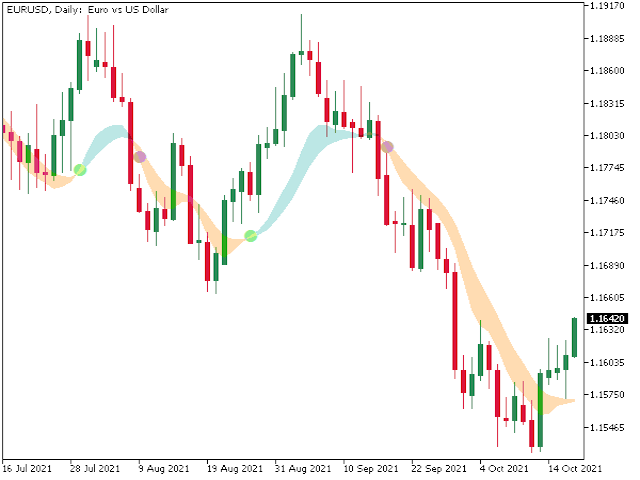
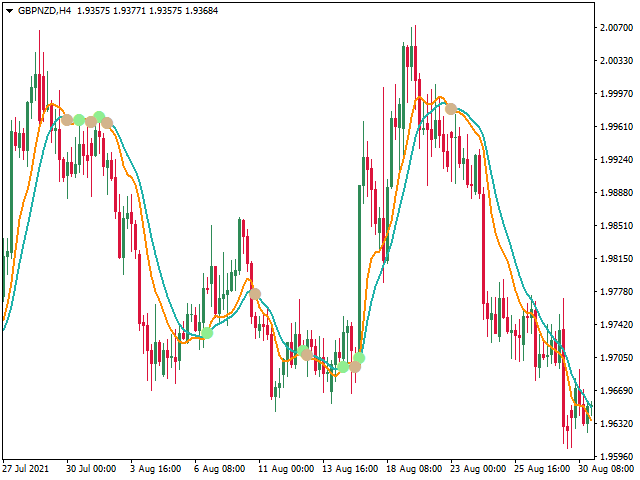
Catch major price movements, early in the trend. Alerts you to enter at the likely beginning of a trend, and if it's incorrect, quickly alerts you to exit to limit any loss. Designed to capture large, profitable price movements, with early entrance to maximize your returns.
Wie in den Screenshots gezeigt, ist das typische Verhalten mehrere schnelle Einstiege/Existenzen mit kleinen Verlusten, und dann die Erfassung eines großen Trends mit hohen Gewinnen.
Der Instantaneous Trend-Indikator ist eine verzögerungsreduzierte Methode zur Erkennung von Preistrends. Sie wurde ursprünglich von John F. Ehlers beschrieben [Ehlers JF (2002) The Instantaneous Trendline, Stocks & Commodities 20:2 (28-32)]. Mathematisch gesehen wird der Markt dabei als ein Markt mit zwei sich überschneidenden Aktivitäten betrachtet: Trends und Zyklen. Trends und zyklische Aktivitäten verbinden sich zu einer Gesamtpreisbewegung. Für einen Trendhändler können die zyklischen Aktivitäten jedoch "verrauscht" und gefährlich sein.
Die Instantaneous-Trend-Gleichung isoliert und entfernt zyklische Aktivitäten (marktbeherrschende Zyklen) aus dem Kursgeschehen. Durch die Beseitigung dieses zyklischen Rauschens sollen die zugrunde liegenden Preistrends schnell aufgezeigt werden.
Dazu gehören einige Berechnungsvarianten, und die Verwendung von Alarmen hilft dem trendbewussten Händler, mehrere Vermögenswerte während des Tages zu überwachen
Typisch sindmehrere schnelle Einstiege/Existenzen mit geringem Verlust, und danndas Einfangen eines großen Trends mit hohen Gewinnen .
Warnungen
Nachrichten-, Ton- und E-Mail-Warnungen können aktiviert werden, wenn sich der Trend aufwärts oder abwärts bewegt. Optional können Kreise gezeichnet werden (in den Parametern ein-/ausgeschaltet), die dem Beginn des Alarms entsprechen.
Parameter
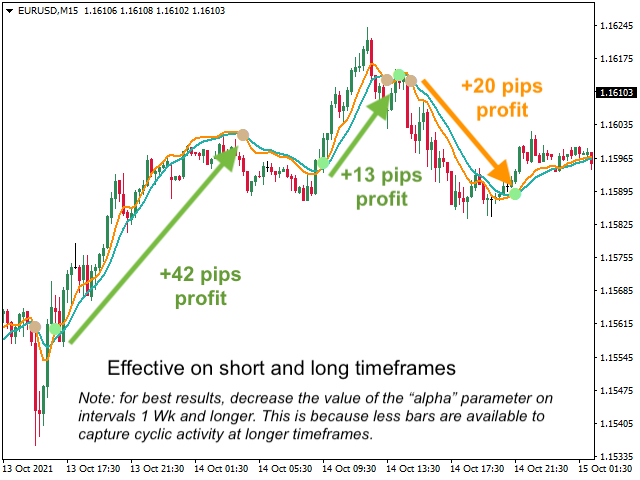
- Alpha (Standardwert 0,07): Empfindlichkeitskonstante, höhere Werte sind empfindlicher für Trends mit kürzerer Dauer. Die besten Ergebnisse erzielen Sie, wenn Sie den Wert von Alpha für sehr lange Intervalle (wöchentlich oder monatlich) verringern, da in diesen langen Intervallen weniger Balken für die Berechnung der zyklischen Aktivität zur Verfügung stehen und Alpha für länger andauernde Trends eingestellt werden sollte.
- Trendbereich ausfüllen: Farbige Füllung des Bereichs zwischen Indikator und Kontrolllinien
- Balkenfarbe aktivieren: Ändern Sie die Balkenfarben so, dass sie grün/rot (oder eine benutzerdefinierte Farbe) sind, je nachdem, ob sich der Instantaneous Trend in einem Aufwärts- oder Abwärtstrend befindet. Beachten Sie, dass Sie möglicherweise auch die Farben der Balkenlinien anpassen möchten.
- Linien ausblenden: Blendet die Indikator- und Kontrolllinien aus (wenn Sie nur Punkte oder Füllungen anzeigen möchten)
- Punkt auf Kreuz zeichnen: Zeichnet einen Kreis an den Punkten, an denen die Indikatorlinie die Kontrolllinie kreuzt, und zeigt damit eine neue Trendrichtung an
- Warnmeldung einschalten: Wenn diese Option aktiviert ist, wird eine Warnmeldung in der Nachrichtenbox angezeigt (wenn die Indikatorlinie das Steuerelement kreuzt).
- Alarmsignal einschalten: Falls zutreffend, wird das Alarmsignal eingeschaltet ( wenn die Indikatorlinie das Steuerelement kreuzt).
- E-Mail-Warnungen einschalten: Wenn wahr, werden die E-Mail-Warnungen eingeschaltet ( wenn die Indikatorlinie das Kontrollkästchen kreuzt)
- Alarm bei Kerzeneröffnung: Wenn wahr, wird auf die Eröffnung der nächsten Kerze gewartet, um einen Alarm auszulösen (nicht sofort, wenn der Crossover passiert), um falsche Auslöser zu reduzieren
- Farben: Optionen zur Festlegung benutzerdefinierter Farben für verschiedene Komponenten des Indikators (Indikatorlinie, Kontrolllinie, Punkte usw.)