• Overview
  • Reviews
  • Comments

Average Aggression Bulls vs Bears

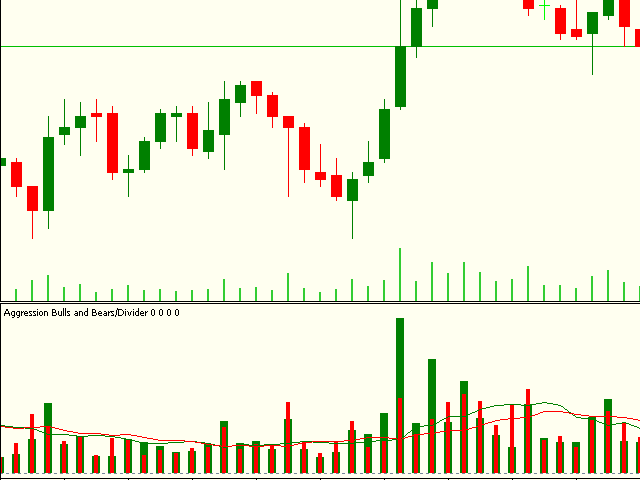
The indicator plots the buying and selling volume on the chart.


Two lines are generated corresponding to the average purchase and sale volumes.

The crossing of averages, the increase in their distance are good indicators of market movement.


NOTES:

  • It is recommended to use the default configuration and VPS values. 
  • You need trading information (Time and Sales).
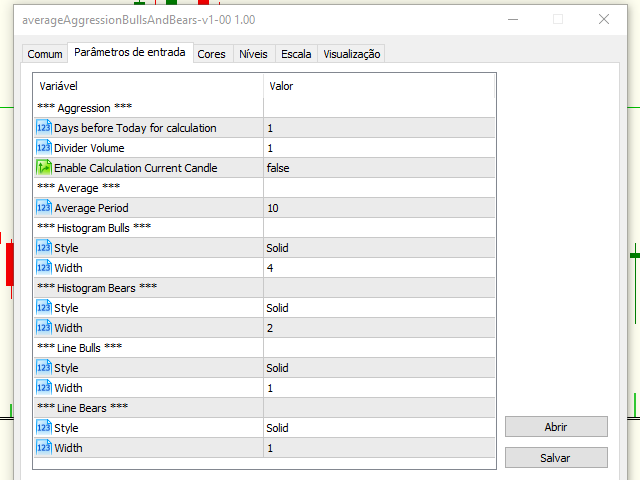


 Parameters:

Aggression

  • Numbers of days prior to the current one for calculation;
  • Volume Divider e;
  • Enables calculation of the current candle;

Average

  • Average Period
Histogram Bulls
  • Line style and;
  • Size;
Histogram Bears
  • Line style and;
  • Size;

Line Bulls

  • Line style and;
  • Size; 

Line Bears

  • Line style and;
  • Size; 


Edson Cavalca Junior 

Systems Analyst


Recommended products
The Moving Average Convergence Divergence (MACD) trading strategy is a popular technical analysis tool that is used to identify changes in momentum and trend direction. The MACD is calculated by subtracting the 26-period exponential moving average (EMA) from the 12-period EMA. A 9-period EMA, called the "signal line," is then plotted on top of the MACD to act as a trigger for buy and sell signals. The MACD is considered to be in bullish territory when the MACD line is above the signal line an
FREE
Multi-timeframe trend indicator, based on the ADX / ADXWilder indicator The indicator shows trend areas using ADX or ADXWilder indicator data from multiple timeframes. The impulse mode of the indicator allows you to catch the beginning of a trend, and several "Screens" with different timeframes allow you to filter out market noise. How the indicator works: if PDI is greater than NDI, then it`s bullish movement; if PDI is less than NDI, then it`s bearish movement; to determine any trend, it
FREE
Follow The Line MT5
Oliver Gideon Amofa Appiah
4.4 (30)
This indicator obeys the popular maxim that: "THE TREND IS YOUR FRIEND" It paints a GREEN line for BUY and also paints a RED line for SELL. (you can change the colors). It gives alarms and alerts of all kinds. IT DOES NOT REPAINT and can be used for all currency pairs and timeframes. Yes, as easy and simple as that. Even a newbie can use it to make great and reliable trades. NB: For best results, get my other premium indicators for more powerful and reliable signals. Get them here: https://www.m
FREE
PZ Oscillator MT5
PZ TRADING SLU
3.8 (10)
This is a smooth and responsive accelerometer which reveals the market trend and strength. [ Installation Guide | Update Guide | Troubleshooting | FAQ | All Products ] Two moving averages indicate trend direction The histogram represents strength of the price movement It draws buy and sell zones as colored vertical lines Should be used as a confirmation indicator Customizable line widths and colors It implements alerts of all kinds This indicator is similar to MACD but aims to react faster t
FREE
A professional tool for trading - the divergence indicator between the WPR and the price, which allows you to receive a signal about a trend reversal in a timely manner or catch price pullback movements (depending on the settings). The indicator settings allow you to adjust the strength of the divergence due to the angle of the WPR peaks and the percentage change in price, which makes it possible to fine-tune the signal strength. The indicator code is optimized and is tested very quickly as par
FREE
Are you tired of drawing trendlines every time you're analyzing charts? Or perhaps you would like more consistency in your technical analysis. Then this is for you. This indicator will draw trend lines automatically when dropped on a chart. How it works Works similar to standard deviation channel found on mt4 and mt5. It has 2 parameters: 1. Starting Bar 2. Number of bars for calculation The   starting bar   is the bar which drawing of the trend lines will begin, while the   number of bars for c
FREE
Mitimom
Danil Poletavkin
The indicator is based on Robert Miner's methodology described in his book "High probability trading strategies" and displays signals along with momentum of 2 timeframes. A Stochastic oscillator is used as a momentum indicator. The settings speak for themselves period_1 is the current timeframe, 'current' period_2 is indicated - the senior timeframe is 4 or 5 times larger than the current one. For example, if the current one is 5 minutes, then the older one will be 20 minutes The rest of the
FREE
Curver Arrows
Francis Dube
4 (9)
This indicator is a straight port of a well known MetaTrader 4 indicator that is freely available on the Internet. It does not redraw at all. It implements a type of breakout strategy. The arrows indicate market direction. Use the indicator on M15 charts and higher. The indicator draws two bands near price action and generates signals when the price closes below the lower band and also above the upper band. The indicator uses periodic highs and lows to calculate upper and lower threshold bands.
FREE
The indicator identifies when a divergence occurs between price and an indicator or oscillator. It identifies both regular and hidden divergences. Combined with your own rules and techniques, this indicator will allow you to create (or enhance) your own powerful system. Features Can detect divergences for the following oscillators/indicators:   MACD, OsMA, Stochastics, RSI, CCI, RVI, Awesome, ADX, ATR, OBV, Composite index, MFI and Momentum. Only one oscillator/indicator can be selected. Draws
FREE
Free automatic Fibonacci is an indicator that automatically plots a Fibonacci retracement based on the number of bars you select on the BarsToScan setting in the indicator. The Fibonacci is automatically updated in real time as new highest and lowest values appears amongst the selected bars. You can select which level values to be displayed in the indicator settings. You can also select the color of the levels thus enabling the trader to be able to attach the indicator several times with differe
FREE
Original MACD
Kirill Paskhin
5 (3)
Moving Average Convergence/Divergence — схождение/расхождение скользящих средних — технический индикатор, разработанный Джеральдом Аппелем (Gerald Appel), используемый в техническом анализе для проверки силы и направления тренда, а также определения разворотных точек. Встроенный в MetaTrader 5 индикатор MACD не соответствует задумке автора (Gerald Appel): -линия MACD графически изображена в виде гистограммы, однако гистограммой отражается разница между линией MACD и сигнальной линией;  -сигнал
FREE
ISolz MACD
Iqrar Hussain
Ever wanted to use MACD like you see in TradingView??? Now you can use this indicator to use same MACD in your MetaTrader5 and enjoy more time in Trading.. You can change MACD settings if you want to change and it will be ready to use for you... Now you will not spend time in TradingView to use only indicator there... Open charts , load Indicator and you are ready to do analysis in MetaTrader5 and Put Trades when you feel okay with your analysis.
FREE
Forex Indicator Arrows
NGUYEN NGHIEM DUY
1 (1)
Forex Indicator Arrows is an arrow Indicator used as an assistant tool for your trading strategy. The indicator analyzes the standard deviation of bar close for a given period and generates a buy or sell signals if the deviation increases. It good to combo with Martingale EA to follow Trend and Sellect Buy Only/Sell Only for EA work Semi-Automatic. You can use this  Indicator with any EAs in my Products.
FREE
What is this indicator? This indicator is the MACD (Moving Average Convergence/Divergence) supporting Virtual Trading mode of  Knots Compositor . When the mode is turned on, the indicator will be recalculated based on the displayed candlesticks. When the mode is turned off, the indicator will be recalculated based on the original chart candlesticks. Types of the applied price - Close - Open - High - Low - Median Price (HL/2) - Typical Price (HLC/3) - Weighted Price (HLCC/4) KC-Indicators
FREE
Donchian Pro
Paulo Henrique Faquineli Garcia
5 (2)
The Donchian Channel Channels are among the most popular tools of technical analysis, as they visually convey to the analyst the limits within which most price movement tends to occur. Channel users know that valuable information can be obtained at any time, whether prices are in the central region of a band or close to one of the border lines. One of the best known techniques to explore these concepts is Bollinger Bands. However, John Bollinger was not the only one to research the applicatio
FREE
ToolBot Probabilistic Analysis
Josue De Matos Silva
4.33 (3)
ToolBot   Probabilistic Analysis -  FREE   An effective indicator for your negotiations The toolbot indicator brings the calculation of candles and a probabilistic analysis so that you have more security on your own. Also test our   FREE   tops and bottoms indicator: :    https://www.mql5.com/pt/market/product/52385#description Also test our   FREE   (RSI, ATR, ADX, OBV)  indicator :    https://www.mql5.com/pt/market/product/53448#description Try our EA ToolBot for free:   https://www.mql
FREE
What is this indicator? This indicator is the Stochastic Oscillator supporting Virtual Trading mode of   Knots Compositor . When the mode is turned on, the indicator will be recalculated based on the displayed candlesticks. When the mode is turned off, the indicator will be recalculated based on the original chart candlesticks. KC-Indicators -   KC-MA   (Moving Average) -   KC-ENV   (Envelopes) -   KC-BB   (Bollinger Bands) -   KC-ADX   (Average Directional Movement Index) -   KC-MACD   (Mo
FREE
Multi-timeframe trend indicator based on the ADX / ADXWilder indicator with Fibonacci levels The indicator shows trend areas using ADX or ADXWilder indicator data from multiple timeframes. The impulse mode of the indicator allows you to catch the beginning of a trend, and several "Screens" with different timeframes allow you to filter out market noise. Fibonacci levels are added to the price chart, which have flexible settings. How the indicator works: if PDI is greater than NDI, then   it`
FREE
Inside Bar Radar
Flavio Javier Jarabeck
4.67 (6)
The Inside Bar pattern is a very well known candlestick formation used widely by traders all over the world and in any marketplace. This approach is very simple and adds a little confirmation candle, so it adds a third past candlestick to the count to confirm the direction of the move (upward or downward). Obviously, there is no power on this candlestick formation if the trader has no context on what it is happening on the market he/she is operating, so this is not magic, this "radar" is only a
FREE
Nameless Stochastic
Flavio Javier Jarabeck
4.67 (3)
It is the very same classic Stochastic indicator, but with a little twist: NO NAME and data is shown in the sub window. It could be stupid, BUT, if you are running out of space in Micro windows like Mini Charts, where the indicator's name is totally useless, you came to the right place. And that's it! I know it seems stupid but I needed the classical version of Stochastic indicator without that annoying name on my Mini Chart, so I did it that way... The original formula is right from Metaquote's
FREE
This indicator is a zero-lag indicator and displays  strength of trend change . True Trend  Oscillator Pro works best in combination with True Trend Moving Average Pro that displays exact trend as is. Oscillator value is exact price change in given direction of the trend. True Trend Moving Average Pro: https://www.mql5.com/en/market/product/103586 If you set PERIOD input parameter to 1 this indicator becomes a sharpshooter for binary options. Developers can use True Trend Oscillator in E
FREE
PZ Penta O MT5
PZ TRADING SLU
4 (6)
The Penta-O is a 6-point retracement harmonacci pattern which usually precedes big market movements. Penta-O patterns can expand and repaint quite a bit. To make things easier this indicator implements a twist: it waits for a donchian breakout in the right direction before signaling the trade. The end result is an otherwise repainting indicator with a very reliable trading signal. The donchian breakout period is entered as an input. [ Installation Guide | Update Guide | Troubleshooting | FAQ | A
FREE
A professional tool for trading - the divergence indicator between the MACD and the price, which allows you to receive a signal about a trend reversal in a timely manner or catch price pullback movements (depending on the settings). The indicator settings allow you to adjust the strength of the divergence due to the angle of the MACD peaks and the percentage change in price, which makes it possible to fine-tune the signal strength. The indicator code is optimized and is tested very quickly as p
FREE
A professional tool for trading - the divergence indicator between the  MACD and the price, which allows you to receive a signal about a trend reversal in a timely manner or catch price pullback movements (depending on the settings). The indicator settings allow you to adjust the strength of the divergence due to the angle of the  MACD peaks and the percentage change in price, which makes it possible to fine-tune the signal strength. The indicator code is optimized and is tested very quickly as
FREE
PFKBreakOut
Stanislav Korotky
This indicator displays breakouts on Point-And-Figure-like or Kagi-like custom symbol charts, generated by special expert advisers, such as PointFigureKagiCharts . This indicator is applicable only for custom instruments generated in appropriate way (with time-invariant bars which are multiples of a predefined box size). It makes no sense to apply it to other charts. The breakouts in up or down direction are marked by arrows. The breakout price is found at crossing of one of imaginary lines of
FREE
High Low Open Close
Alexandre Borela
4.97 (35)
If you like this project, leave a 5 star review. Follow on instagram: borelatech This indicator draws the open, high, low and closing prices for the specified period and it can be adjusted for a specific timezone. These are important levels looked by many institutional and professional traders and can be useful for you to know the places where they might be more active. The available periods are: Previous Day. Previous Week. Previous Month. Previous Quarter. Previous year. Or: Current Day. Cu
FREE
Price Momentum
Flavio Javier Jarabeck
4.92 (13)
Value Chart indicator presents the Price evolution in a new form. This indicator, Price Momentum , was developed taking all the calculations presented in the book " Dynamic Trading Indicators " by Mark W. Helweg and David Stendahl (2002). The technique involves de-trended Prices from a user-defined Period of analysis and the addition of a Volatility index correction. The result is an Oscillator with 3 zones: Fair Price Value, Overbought/Oversold and Extremely Overbought/Oversold zones. Adding th
FREE
MACD Colored ZeroLag
Farzin Sadeghi Bonjar
4.14 (7)
It is the MQL5 version of zero lag MACD that was available for MT4 here: https://www.mql5.com/en/code/9993 Also there was a colored version of it here but it had some problems: https://www.mql5.com/en/code/8703 I fixed the MT4 version which has 95 lines of code. It took me 5 days to write the MT5 version.(reading the logs and testing multiple times and finding out the difference of MT5 and MT4!) My first MQL5 version of this indicator had 400 lines of code but I optimized my own code again and n
FREE
Symobol Tabs
Mitchell Dean Ede
Displays symbol tabs for easy access when trading, symbols that are coloured are symbols you have trades running on. The indicator immediately shows the specified currency pair in the open window after clicking it. You no longer need to open a new window to view each chart thanks to the indicator. Additionally, it enables traders to concentrate on their trading approach by just keeping a small number of charts displayed.  
FREE
WH Price Wave Pattern MT5
Wissam Hussein
3.8 (10)
Welcome to our Price Wave Pattern MT5 --(ABCD Pattern)-- The ABCD pattern is a powerful and widely used trading pattern in the world of technical analysis. It is a harmonic price pattern that traders use to identify potential buy and sell opportunities in the market. With the ABCD pattern, traders can anticipate potential price movements and make informed decisions on when to enter and exit trades. EA Version:    Price Wave EA MT5 MT4 Version : Price Wave Pattern MT4  Features :  Auto
FREE
Buyers of this product also purchase
Atomic Analyst MT5
Issam Kassas
3.64 (11)
First of all Its worth emphasizing here that this Trading Indicator is   Non-Repainting ,   Non-Redrawing   and   Non-Lagging   Indicator, Which makes it ideal from both manual and robot trading.  The Atomic Analyst  is a PA Price Action Indicator that uses Strength and Momentum of the price to find a better edge in the market. Equipped with an AI filter which help remove noises and false signals, and Increase Trading Potential. Using Multiple layers of complex Indicators, the Atomic Analyst
First of all Its worth emphasizing here that this Trading System is Non-Repainting , Non-Redrawing and Non-Lagging Indicator , Which makes it ideal from both manual and robot trading .  The Smart Trend Trading System MT5 is a comprehensive trading solution tailored for new and experienced traders . It combines over 10 premium indicators and features more than 7 robust trading strategies , making it a versatile choice for diverse market conditions . Trend Following Strategy : Provides precise ent
Quantum Trend Sniper
Bogdan Ion Puscasu
5 (37)
Introducing   Quantum Trend Sniper Indicator , the groundbreaking MQL5 Indicator that's transforming the way you identify and trade trend reversals! Developed by a team of experienced traders with trading experience of over 13 years,   Quantum Trend Sniper Indicator   is designed to propel your trading journey to new heights with its innovative way of identifying trend reversals with extremely high accuracy. ***Buy Quantum Trend Sniper Indicator and you could get Quantum Breakout Indicator fo
FX Volume MT5
Daniel Stein
4.94 (17)
Visit our all-new   Stein Investments Welcome Page   to get the latest information, updates and trading strategies. FX Volume is the FIRST and ONLY volume indicator that provides a REAL insight into the market sentiment from a broker's point of view. It provides awesome insights into how institutional market participants, like brokers, are positioned in the Forex market, much faster than COT reports. Seeing this information directly on your chart is the real game-changer and breakthrough solut
RelicusRoad Pro MT5
Relicus LLC
4.81 (21)
How many times have you bought a trading indicator with great back-tests, live account performance proof with fantastic numbers and stats all over the place but after using it, you end up blowing your account? You shouldn't trust a signal by itself, you need to know why it appeared in the first place, and that's what RelicusRoad Pro does best! NOW $147 (increasing to $499 after a few updates) - UNLIMITED ACCOUNTS (PCs or MACs) **  User Manual + Strategies + Training Videos + Private Group with
FX Power MT5 NG
Daniel Stein
5 (4)
Trading GOLD, and currencies, with the dog walk strategy  - super smart Trading GOLD, and currencies, with the breakout strategy  - super easy Visit our all-new   Stein Investments Welcome Page   to get the latest information, updates and trading strategies. FX Power MT5 NG  is the next generation of our long-time very popular currency strength meter, FX Power.  And what does this next-generation strength meter offer? Everything you have loved about the original FX Power  PLUS GOLD/XAU st
Advanced Supply Demand MT5
Bernhard Schweigert
4.53 (15)
Best Solution for any Newbie or Expert Trader! This indicator is a unique, high quality and affordable trading tool because we have incorporated a number of proprietary features and a new formula. With this update, you will be able to show double timeframe zones. You will not only be able to show a higher TF but to show both, the chart TF, PLUS the higher TF: SHOWING NESTED ZONES. All Supply Demand traders will love it. :) Important Information Revealed Maximize the potential of Advanced Suppl
First of all Its worth emphasizing here that this Trading Tool is Non Repainting , Non Redrawing and Non Lagging Indicator , Which makes it ideal for professional trading . The Smart Price Action Concepts Indicator is a very powerful tool for both new and experienced traders . It packs more than 20 useful indicators into one , combining advanced trading ideas like Inner Circle Trader Analysis and Smart Money Concepts Trading Strategies . This indicator focuses on Smart Money Concepts , prov
XQ Indicator MetaTrader 5
Marzena Maria Szmit
5 (1)
Step into the realm of Forex trading with confidence and precision using XQ, a cutting-edge Forex indicator designed to elevate your trading game to unprecedented heights. Whether you're a seasoned trader or just stepping into the world of currency exchange, XQ Forex Indicator empowers you with the insights and signals needed to make informed trading decisions. The signal conditions are a combination of three indicators, and XQ Forex Indicator only display  medium and long-term trends . The ind
Volume by Price MT5
Brian Collard
5 (3)
The Volume by Price Indicator for MetaTrader 5 features Volume Profile and Market Profile TPO (Time Price Opportunity). Get valuable insights out of currencies, equities and commodities data. Gain an edge trading financial markets. Volume and TPO histogram bar and line charts. Volume Footprint charts. TPO letter and block marker charts including split structures. Versatile segmentation and compositing methods. Static, dynamic and flexible ranges with relative and/or absolute visualizations. Lay
Introducing   Quantum Breakout PRO , the groundbreaking MQL5 Indicator that's transforming the way you trade Breakout Zones! Developed by a team of experienced traders with trading experience of over 13 years,   Quantum Breakout PRO   is designed to propel your trading journey to new heights with its innovative and dynamic breakout zone strategy. Quantum Breakout Indicator will give you signal arrows on breakout zones with 5 profit target zones and stop loss suggestion based on the breako
ICT, SMC, SMART MONEY CONCEPTS, SMART MONEY, Smart Money Concept, Support and Resistance, Trend Analysis, Price Action, Market Structure, Order Blocks, BOS/CHoCH,   Breaker Blocks ,  Momentum Shift,   Supply&Demand Zone/Order Blocks , Strong Imbalance,   HH/LL/HL/LH,    Fair Value Gap, FVG, Inversion FVG, IFVG,  Premium  &   Discount   Zones, Fibonacci Retracement, OTE, Buy Side Liquidity, Sell Side Liquidity, BSL/SSL Taken, Equal Highs & Lows, MTF Dashboard, Multiple Time Frame, BigBar, HTF OB
Top indicator for MT5   providing accurate signals to enter a trade without repainting! It can be applied to any financial assets:   forex, cryptocurrencies, metals, stocks, indices .  Watch  the video  (6:22) with an example of processing only one signal that paid off the indicator! MT4 version is here It will provide pretty accurate trading signals and tell you when it's best to open a trade and close it. Most traders improve their trading results during the first trading week with the help of
AW Trend Predictor MT5
AW Trading Software Limited
4.76 (54)
The combination of trend and breakdown levels in one system. An advanced indicator algorithm filters market noise, determines the trend, entry points, as well as possible exit levels. Indicator signals are recorded in a statistical module, which allows you to select the most suitable tools, showing the effectiveness of the signal history. The indicator calculates Take Profit and Stop Loss marks. Manual and instruction ->  HERE  / MT4 version ->  HERE How to trade with the indicator:  Trading wit
Auto Order Block with break of structure based on ICT and Smart Money Concepts Futures Break of Structure ( BoS )             Order block ( OB )            Higher time frame Order block / Point of Interest ( POI )    shown on current chart           Fair value Gap ( FVG ) / Imbalance   ,  MTF      ( Multi Time Frame )    Volume Imbalance     ,  MTF          vIMB Gap’s Equal High / Low’s     ,  MTF             EQH / EQL Liquidity               Current Day High / Low           HOD /
Gann Squares Indicator: Analyzing Markets with Geometric Patterns The Gann Squares indicator is a powerful tool for market analysis that draws upon the mathematical concepts introduced by W.D. Gann in his article on "Mathematical Formula for Market Predictions." This indicator incorporates Gann's techniques involving square numbers such as 144, 90, and 52, as well as the Square of 9. Additionally, it incorporates  method for utilizing the Square of 9 in conjunction with channels and the star pa
TrendMaestro5
Stefano Frisetti
note: this indicator is for METATRADER4, if you want the version for METATRADER5 this is the link:  https://www.mql5.com/it/market/product/108106 TRENDMAESTRO recognizes a new TREND in the bud, he never makes mistakes. The certainty of identifying a new TREND is priceless. DESCRIPTION TRENDMAESTRO identifies a new TREND in the bud, this indicator examines the volatility, volumes and momentum to identify the moment in which there is an explosion of one or more of these data and therefore the mome
Blahtech Supply Demand MT5
Blahtech Limited
4.57 (14)
Was: $299  Now: $99   Supply Demand uses previous price action to identify potential imbalances between buyers and sellers. The key is to identify the better odds zones, not just the untouched ones. Blahtech Supply Demand indicator delivers functionality previously unavailable on any trading platform. This 4-in-1 indicator not only highlights the higher probability zones using a multi-criteria strength engine, but also combines it with multi-timeframe trend analysis, previously confirmed swings
Owl Smart Levels MT5
Sergey Ermolov
4.47 (36)
MT4 version  |   FAQ The Owl Smart Levels Indicator is a complete trading system within the one indicator that includes such popular market analysis tools as Bill Williams' advanced fractals , Valable ZigZag which builds the correct wave structure of the market, and Fibonacci levels which mark the exact levels of entry into the market and places to take profits. Detailed description of the strategy Instructions for working with the indicator Advisor-assistant in trading Owl Helper Private User
TPSproTREND PrO MT5
Roman Podpora
5 (5)
TPSpro TRENDPRO  - is a trend indicator that automatically analyzes the market and provides information about the trend and each of its changes, as well as giving signals for entering trades without redrawing! The indicator uses each candle, analyzing them separately. referring to different impulses - up or down impulse. Exact entry points into transactions for currencies, crypto, metals, stocks, indices!  -  Version MT4                  DETAILED DESCRIPTION        /       TRADING SETUPS       
Gartley Hunter Multi
Siarhei Vashchylka
5 (5)
Gartley Hunter Multi - An indicator for searching for harmonic patterns simultaneously on dozens of trading instruments and on all classic timeframes: (m1, m5, m15, m30, H1, H4, D1, Wk, Mn). Manual (Be sure to read before purchasing) | Version for MT4 Advantages 1. Patterns: Gartley, Butterfly, Shark, Crab. Bat, Alternate Bat, Deep Crab, Cypher 2. Simultaneous search for patterns on dozens of trading instruments and on all classic timeframes 3. Search for patterns of all possible sizes. Fr
TrendDecoder Premium MT5
Christophe, Pa Trouillas
5 (1)
Identify ranges  | Get earliest signals of Trends  | Get clear exits before reversal  | Spot the Fibo levels the price will test   |  Non-repainting, non-delayed indicator - ideal for manual and automated trading - for all assets and all time units $69   for launch - then back to >>   $149 After purchase,   please contact me on this channel   for recommended and personalised settings MT4   version:  Click here Get our full method with  BladeSCALPER  and   PowerZONES What is it about? TrendDE
Was: $249  Now: $99   Market Profile defines a number of day types that can help the trader to determine market behaviour. A key feature is the Value Area, representing the range of price action where 70% of trading took place. Understanding the Value Area can give traders valuable insight into market direction and establish the higher odds trade. It is an excellent addition to any system you may be using. Inspired by Jim Dalton’s book “Mind Over Markets”, this indicator is designed to suit the
Golden Spikes Detector
Batsirayi L Marango
5 (1)
Golden Spikes Detector This indicator is based on an advanced strategy primarily for trading spikes on Boom and Crash Indices. Complex algorithms were implemented to detect high probability entries only. It alerts on potential Buy and Sell entries. To trade spikes on the Deriv or Binary broker, only take Buy Boom and Sell Cash alerts. It was optimised to be loaded on 5-minute timeframe although multiple timeframe analysis is done in the background. Features ·             Desktop pop up and sound
Matrix Arrow Indicator MT5
Juvenille Emperor Limited
5 (14)
Matrix Arrow Indicator MT5  is a unique 10 in 1 trend following   100% non-repainting  multi-timeframe indicator that can be used on all symbols/instruments:   forex,   commodities,   cryptocurrencies,   indices,   stocks .  Matrix Arrow Indicator MT5  will determine the current trend at its early stages, gathering information and data from up to 10 standard indicators, which are: Average Directional Movement Index (ADX) Commodity Channel Index (CCI) Classic Heiken Ashi candles Moving Aver
IX Power MT5
Daniel Stein
5 (2)
IX Power   finally brings the unbeatable precision of FX Power to non-Forex symbols. It accurately determines the intensity of short, medium and long-term trends in your favourite indices, stocks, commodities, ETFs, and even cryptocurrencies. You can   analyse everything   your terminal has to offer. Try it out and experience how   your timing improves significantly   when trading. Read about our latest strategic development -  Easy scalping with IX Power Visit our all-new   Stein Investments
Golden Gate Algo MT5
James David Lane
4 (6)
Introducing GoldenGate Algo: A Cutting-Edge Trading Solution!  Discover a revolutionary approach to trading with GoldenGate Algo (GGA), an advanced indicator designed to elevate your trading experience. GGA provides a comprehensive set of features to empower users with precision and confidence in their trading decisions. No re-painting! Pairs:   Any TimeFrames:   15m up to H1 Key Features: Buy and Sell Arrow Indications:   Receive Buy and Sell arrow indications accompanied by pop-up alerts,
Legacy of Gann for MT5
Pavel Zamoshnikov
5 (4)
The indicator very accurately determines the levels of the possible end of the trend and profit fixing. The method of determining levels is based on the ideas of W.D.Gann, using an algorithm developed by his follower Kirill Borovsky. Extremely high reliability of reaching levels (according to K. Borovsky  - 80-90%) Indispensable for any trading strategy – every trader needs to determine the exit point from the market! Precisely determines targets on any timeframes and any instruments (forex, met
Bill Williams Advanced
Siarhei Vashchylka
5 (3)
Bill Williams Advanced is designed for automatic chart analysis using Bill Williams' "Profitunity" system. The indicator analyzes four timeframes at once. Manual (Be sure to read before purchasing) Advantages 1. Automatically analyzes the chart using the "Profitunity" system of Bill Williams. The found signals are placed in a table in the corner of the screen. 2. Equipped with a trend filter based on the Alligator indicator. Most of the system signals are recommended to be used only accordi
Trend Forecaster
Alexey Minkov
5 (3)
The Trend Forecaster indicator utilizes a unique proprietary algorithm to determine entry points for a breakout trading strategy. The indicator identifies price clusters, analyzes price movement near levels, and provides a signal when the price breaks through a level. The Trend Forecaster indicator is suitable for all financial assets, including currencies (Forex), metals, stocks, indices, and cryptocurrencies. You can also adjust the indicator to work on any time frames, although it is recommen
More from author
Aggression Volume Profile
Edson Cavalca Junior
4.25 (4)
This indicator plots the volume profile by Price on the chart There are 5 ways to view it: By Total Volume Traded; Volume Ticks(Forex) Separated by Buyers and Sellers; Buyers Only; Sellers Only and; Business balance (Buyers - Sellers). It is possible to select how many days the profiles will be calculated. On the current day it recalculates the histogram data for each new candlestick. Another feature is to select the highest trading range by entering the desired percentage. Th
FREE
Forca Relativa
Edson Cavalca Junior
5 (6)
The robot issues buy/sell signals based on the setting of the RELATIVE STRENGTH INDICATOR Know our products    Review and get a month's rental on any of our paid robots.  This Expert Advisor (EA) works on HEDGE (Forex, etc.) and NETTING (Bovespa, etc.) accounts, but manages only one position at a time. The  filters  are used to increase the accuracy  and if activated and not met your criteria, the order is not sent. 5 FILTERS available: ADX indicator; ADX + (DM +) and - (DM-) direction
FREE
This indicator plots in the candles the divergence found in the selected indicator and can also send a notification by email and / or to the cell phone. Works on all TIMEFRAMES. Meet Our Products   He identifies the divergences in the indicators: Relative Strength Index (RSI); Moving Average Convergence and Divergence (MACD); Volume Balance (OBV) and;. iStochastic Stochastic Oscillator  (STOCHASTIC). It is possible to choose the amplitude for checking the divergence and the indicator has
FREE
The Market Thermometer can be used to help traders identify sleepy or turbulent periods.  It helps beginners to check when is the ideal time to enter operations, that is, when the value of the thermometer is below its average for several periods, identifying a peaceful market.   When the market is heated, that is, the thermometer is above three times its average, it is time to make profits.  The Thermometer measures the extent to which the end of a period, maximum or minimum price, projects out
FREE
Market Thermometer Jr
Edson Cavalca Junior
5 (1)
The Market Thermometer can be used to help traders identify sleepy or turbulent periods. It helps beginners to check when is the ideal time to enter operations, that is, when the value of the thermometer is below its average for several periods, identifying a peaceful market. When the market is heated, that is, the thermometer is above three times its average, it is time to make profits. The Thermometer measures the extent to which the end of a period, maximum or minimum price, projects outsi
FREE
Three Candles Pattern
Edson Cavalca Junior
5 (1)
The patterns of 3 (three) Candles: Three White Soldiers; Three Black Crows; These are reversal patterns widely used by traders, as they have a high probability of showing the inversion of the current market movement. For example, if in a bullish trend there are three black crows, there is a high probability of reversing the current bullish movement. The Three White Soldiers have the following characteristics: There are 3 consecutive candles with a good body, that is, the difference between
This indicator is based on the system of three moving averages where: First is the fast average (MA1); Second is the intermediate average (MA2) and; T hird is the slow average (MA3). The theory covered in the technical analysis books informs us that when the first average exceeds the second average it is an alert for the trader, however the movement occurs when the second average exceeds the third. The indicator will insert the check s Parameters : Averages : Period Fast Moving Average(FMA); Smo
The indicator measures the accumulated balance of aggression. The formula is as follows:  Accumulated   = Previous Candle Accumulated + Purchase Volume - Sales Volume. Know our products    *** Did you like the product? Then, help us doing review in the " Reviews " tab. The indicator sends information to your email or cell phone when the accumulated balance changes direction. Example : Accumulated seller becomes a buyer. Note : It is recommended to use the default configuration and VPS
Balance Aggression
Edson Cavalca Junior
The indicator measures the balance of aggression. The formula is as follows:   Aggression  = Purchase Volume - Sales Volume. Note : It is rec ommended to use the default configuration and VPS values. It does not work in Forex. Meet Our Products     Parameters : Numbers of days prior to the current one for calculation; Volume Divider e; Enables calculation of the current candle; Histogram Line style and; Size; Line Line style and; Size;  Follow us on our website to check the next new
This indicator plots in the candles the divergence found in the selected indicator and can also send a notification by email and / or to the cell phone. Works on all TIMEFRAMES. Meet Our Products   He identifies the divergences in the indicators: Relative Strength Index (RSI); Moving Average Convergence and Divergence (MACD); Volume Balance (OBV) and;. iStochastic Stochastic Oscillator  (STOCHASTIC). It is possible to choose the amplitude for checking the divergence and the indicator has
ACDO Brasil
Edson Cavalca Junior
The robo t opens a buy or sell position using the signs. Know our products   Position openings are based on the parameters identified as signals, if you activate all the robot will issue a trading order only if the number of signals is greater than the minimum stipulated by the user. The  filters  are used to increase the accuracy of the signals and if activated and not met your criteria, the order is not sent. EA also offers MOBILE STOP with the Parabolic SAR indicator and also by dis
Busque Trade
Edson Cavalca Junior
This indicator looks for SIGNS of Buy and Sell 14 SIGNS: Crossover of 2 moving averages; Crossover of 3 moving averages; RSI Indicator; Stochastic Indicator; Crossing line 0 MACD; Divergence of the RSI indicator; Divergence of the MACD indicator; Divergence of the OBV indicator; Divergence of the STOCHASTIC indicator; Three white soldiers candle pattern; Three black crows candle pattern; Hanging man    candle pattern; Hammer    candle pattern; Rupture Bands Bollinger. The indicator plot
Topos Fundos
Edson Cavalca Junior
The robot opens positions from Tops and Bottoms Perform trend reversal operations. It has 3 levels of top and bottom measurement. Trader can open and close position on 3 strength signals. The expert also allows you to configure the maximum loss to move along with the price (moving stop). Know our products    Edson Cavalca Junior Systems Analyst WARNINGS The buyer declares himself capable of: We do not provide any trading or risk management advice, ideal configurat
Inversao Infinita
Edson Cavalca Junior
This robot operates through triggers above and below the previous candlestick with STOP orders. When reaching the trigger (Stop Order) it opens the order and we have three situations: If it reaches TAKE PROFIT (Maximum Profit) and the Breakeven Point is activated, it moves the STOP LOSS and the reverse STOP ORDER to Breakeven and cancels the reverse STOP order when reaching the TP. If you go to STOP LOSS after reaching breakeven, the trigger of the reverse order will be reached be
Robo Nuvem
Edson Cavalca Junior
The robot uses one of the most used indicators in Asia: * ICHIMOKU CLOUD * There are two trading strategies: Crossing of Tenkan and Kijun lines and; Kumo lines crossing. Know our products    Position openings are based on the parameters identified as signals, if you activate all the robot will issue a trading order only if the number of signals is greater than the minimum stipulated by the user. This Expert Advisor (EA) works on HEDGE (Forex, etc.) and NETTING (Bovespa, etc.) accou
Robo Bandas
Edson Cavalca Junior
The robot uses one of the most known and used indicators in the world BOLLINGER BANDS There are two trading strategies: Upper or Lower Band Break and; Bollinger Band Entry. Know our products    Position openings are based on the parameters identified as signals. This Expert Advisor (EA) works on HEDGE (Forex, etc.) and NETTING (Bovespa, etc.) accounts, but manages only one position at a time. The  filters  are used to increase the accuracy of the signals and if activated and not met
Zona de Trade
Edson Cavalca Junior
The robot operates within pre-configured channels at the beginning of the operation. Use a Demo account or the Strategy Tester to find the best setup for the asset you want to trade. If you have any doubts about handling the robot, send a comment in the "Comments" tab and we will respond and insert you in our private group. Follow the steps below to configure it. After dragging the robot onto the chart, go to "input parameters and configure the following data: Enter th
Robo Sinal Telegram
Edson Cavalca Junior
Send your trades on the Metatrader 5 platform to your Telegram Group! Simple to use, just follow the steps below: Create a group in Telegram and enter the name in the robot parameters; Create a Bot in Telegram with the user BotFather: Send the following message-> /newbot; BotFather will ask for a name for your Bot; Send a message with the desired name; BotFather will ask for a username for your Bot; Send a message with the desired username; BotFather will send the Token; Insert the
Arbitragem B3
Edson Cavalca Junior
1 (1)
Arbitrage Robot IND/WIN or DOL/WDO This arbitrage robot works with WIN and WDO assets from the Brazilian Stock Exchange. The EA compares the best bid and ask (BID and ASK) of the "full" Index (IND) and compares it with the mini-index (WIN) and, if there is a gap between them, the difference in Ticks stipulated in the robot parameters, it opens a trade. It does the same analysis with DOL and WDO. It is necessary to insert the robot in the WIN or WDO chart and it will automa
Arbitragem B3 Acoes
Edson Cavalca Junior
Stock Arbitrage Robot This arbitration robot trades fractional lots of B3 shares. The EA compares the best bid and ask (BID and ASK) of the Share with a standard lot and compares it with that of the share with a fractional lot and if there is a gap between them, in the difference in Ticks stipulated in the robot's parameters, the even open a trade. Example: Insert robot into Petr3F for Gap based trading with Petr3. It is necessary to insert the robot in the Ticker chart wi
Tunel Vegas Sinal
Edson Cavalca Junior
Trader! Don't you want to spend all day on your computer screen looking at quotes? And do you want to receive stock buying/selling tips based on one of the most used indicators in FOREX on your cell phone? Then discover the Vegas Tunnel Support and product questions at the link below: Support This indicator searches for Buy and Sell SIGNALS in Stock Exchange Assets. It works on any asset on the market. Select in the parameters which Fibonacci line the signal will be sent a
Robo Vegas
Edson Cavalca Junior
Robo Vegas The robot's trading signal is given by touching the channels created by a moving average and distanced lines based on the Fibonacci Theory. See the Vegas Tunnel Signal indicator. Parameter configuration can be obtained from Support. Support and product questions at the link below: Support Select in the parameters which Fibonacci line will be used to open positions. You will receive all updates and insertions of new trading signals. Discover our o
Filter:
No reviews
Reply to review