MA RSI Arrows

4

Summary

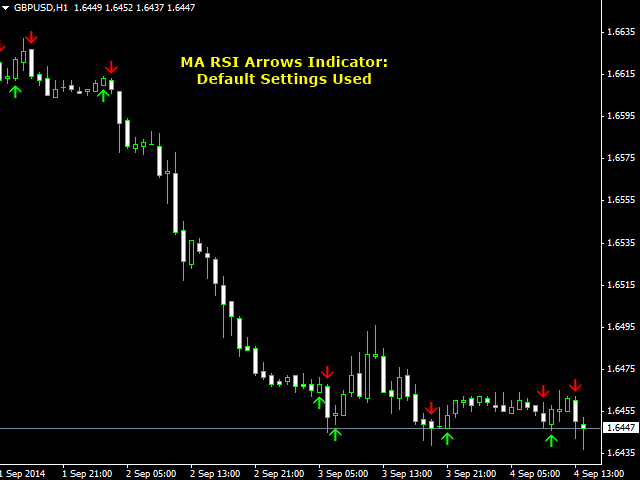
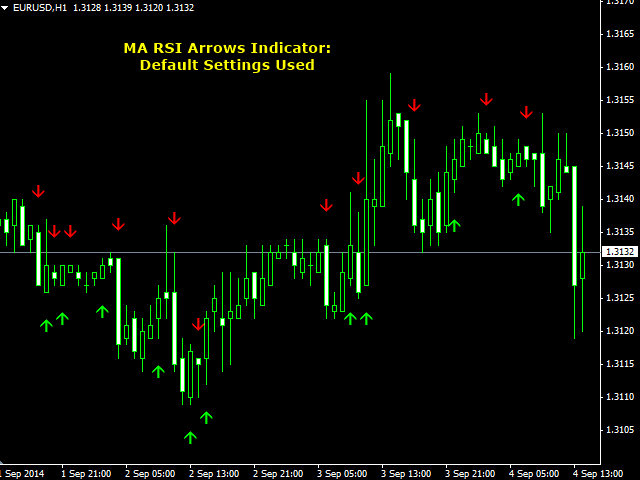
This indicator is based on the MA applied to the RSI indicator. It draws arrows at the confirmed crosses of the MA over the RSI line. When the MA crosses upwards, then a buy arrow is displayed and vice versa. The arrows do not repaint since the indicator only uses confirmed values and waits for the candle to close before painting an arrow. The indicator is also able to alert when arrows appear. There are 3 types of alerts - Popup, Email and Mobile Push Notifications.


Inputs

  • All inputs are standard, self-explanatory and easy to use. If you have any questions though, just ask.


Notes

  • IMPORTANT: Check out our site using the link in my profile to find other FREE indicators and EAs!


Reviews 4
Geoffrey Lowes
18
Geoffrey Lowes 2021.01.17 00:48 
 

Great indy, but could be improved by using a moving average filter so the arrows appear only in the direction of the ma.

Recommended products
UPD1 X00 Levels
Vitaliy Kuznetsov
5 (10)
The indicator shows   round levels   on the chart. They are also called   psychological , banking, or levels of major players. At these levels, there is a real fight between bulls and bears, the accumulation of many orders, which leads to increased volatility. The indicator   automatically   adjusts to any instrument and timeframe. When the   level 80   is broken through and then tested, we   buy. When   level 20   is broken through and then tested, we   sell. The target is 00. Attention. Due t
FREE
Necessary for traders: tools and indicators Waves automatically calculate indicators, channel trend trading Perfect trend-wave automatic calculation channel calculation , MT4 Perfect trend-wave automatic calculation channel calculation , MT5 Local Trading copying Easy And Fast Copy , MT4 Easy And Fast Copy , MT5 Local Trading copying For DEMO Easy And Fast Copy , MT4 DEMO Easy And Fast Copy , MT5 DEMO The homeopathic indicator is also called the CCI indicator. The CCI indicator was proposed
FREE
Wise Men Indicator demo
Bohdan Kasyanenko
3 (2)
The indicator displays signals according to the strategy of Bill Williams on the chart. Demo version of the indicator has the same features as the paid, except that it can work only on a demo account . Signal "First Wise Man" is formed when there is a divergent bar with angulation.  Bullish divergent bar - with lower minimum and closing price in the upper half. Bearish divergent bar - higher maximum and the closing price at the bottom half. Angulation is formed when all three lines of Alligator
FREE
Free automatic Fibonacci is an indicator that automatically plots a Fibonacci retracement based on the number of bars you select on the BarsToScan setting in the indicator. The Fibonacci is automatically updated in real time as new highest and lowest values appears amongst the selected bars. You can select which level values to be displayed in the indicator settings. You can also select the color of the levels thus enabling the trader to be able to attach the indicator several times with differe
FREE
RSI TrendGate
Etsushi Ishizuka
Product Description RSI TrendGate 3MA is an MT4/MT5 chart indicator designed for trend direction confirmation. It evaluates trend direction using a combination of three Moving Averages (MA) and the Relative Strength Index (RSI), and displays arrows in the chart window when the direction state changes according to the selected conditions. This indicator is not intended to be used as a standalone entry signal. A recommended workflow is to confirm direction on a higher timeframe and apply your own
FREE
MA Search 3
Mariusz Piotr Rodacki
This indicator allows you to overlay three different moving averages on the chart simultaneously. Each of these moving averages has additional settings such as: -Time frame -Shift -MA method -Applied price Using this indicator, you can easily set up three moving averages and find the one that suits you the best. You can also use this indicator to determine the trend when the moving averages cross.
FREE
PZ Penta O MT4
PZ TRADING SLU
2.33 (3)
The Penta-O is a 6-point retracement harmonacci pattern which usually precedes big market movements. Penta-O patterns can expand and repaint quite a bit. To make things easier this indicator implements a twist: it waits for a donchian breakout in the right direction before signaling the trade. The end result is an otherwise repainting indicator with a very reliable trading signal. The donchian breakout period is entered as an input. [ Installation Guide | Update Guide | Troubleshooting | FAQ | A
FREE
Double HMA lines MTF
Pavel Zamoshnikov
5 (1)
This is a multi-timeframe version of the popular Hull Moving Average (HMA). The Double HMA MTF Light indicator combines two timeframes on a single chart. The HMA of the higher timeframe defines the trend, and the HMA of the current timeframe defines short-term price movements. The indicator is freely distributed and hasn't audio signals or messages. Its main function is the visualization of price movements. If you need advanced functionality of the HMA multi-timeframe indicator (information ab
FREE
Your Chart
Ashkan Hazegh Nikrou
5 (1)
Enhance your trading experience with the Your Chart indicator! This free and highly customizable tool allows traders to merge multiple timeframes into a single, clean candlestick display without altering the original chart. With Your Chart , you can set the number of bars per custom candle – for example, combine every 18 M1 candles into one for a broader view of market trends. Key Features: Custom Candlestick Formation : Choose how many bars to merge into one candle, offering a flexible view of
FREE
PZ The Zone
PZ TRADING SLU
4.33 (3)
This indicator displays buy or sell signals according to Bill Williams' definition of the Trading Zone. [ Installation Guide | Update Guide | Troubleshooting | FAQ | All Products ] Easy to use and understand Avoid trading flat markets Deterministic indicator with clear rules The indicator is non-repainting It implements alerts of all kinds It has straightforward trading implications. A blue arrow is a buy signal A red arrow is a sell signal According to Bill Williams trading in the zone helps to
FREE
Follow The Line
Oliver Gideon Amofa Appiah
3.94 (16)
FOLLOW THE LINE GET THE FULL VERSION HERE: https://www.mql5.com/en/market/product/36024 This indicator obeys the popular maxim that: "THE TREND IS YOUR FRIEND" It paints a GREEN line for BUY and also paints a RED line for SELL.  It gives alarms and alerts of all kinds. IT DOES NOT REPAINT and can be used for all currency pairs and timeframes. Yes, as easy and simple as that. Even a newbie can use it to make great and reliable trades. NB: For best results, get my other premium indicators for more
FREE
Better Moving Average
Vincent Jose Proenca
STRUCTURAL TREND LINES - MT4 Indicator Simple indicator that automatically draws trend lines based on market structure. Features: - 3 degrees of structure detection (short, medium, long term) - Configurable swing strength for each degree - Single color per degree for clean visualization - Adjustable number of lines per degree - Customizable colors and line widths How it works: The indicator identifies swing highs and lows based on the strength parameter, then connects these points to create t
FREE
Special offer : ALL TOOLS , just $35 each! New tools   will be   $30   for the   first week   or the   first 3 purchases !  Trading Tools Channel on MQL5 : Join my MQL5 channel to update the latest news from me In the dynamic financial markets, identifying trend reversal signals is essential for effective trading. The RSI Divergence Scanner is designed to help you detect RSI divergence signals across various currency pairs and timeframes accurately and efficiently. See more MT5 version at:    R
FREE
Auto Fibo Retracement MT4
Nguyen Tuan Son
3.75 (4)
Auto Fibonacci Retracement Indicator — Flexible and Reliable This is not just another Auto Fibonacci Retracement indicator — it’s one of the most flexible and dependable tools available . If you find it useful, please leave a review or comment to support the project. Check out my other helpful tools below: Timeframes Trend Scanner    - Scan the trend of assets in difference timeframes with multiple indicators Market Trend Scanner   - Scan the trend of multiple-assets in with multiple indicators
FREE
The indicator uses the Chester W. Keltner's channel calculation method, modified by the well-known trader Linda Raschke. Due to the modification, the calculated channel contains a much more complete overview of the price movements, which allows increasing the probability of an accurate prediction of the upcoming price movement. Unlike the classic Keltner method, the base line of the channel is plotted based on the Exponential Moving Average, and the Average True Range is used to calculate the up
FREE
FlatBreakout
Aleksei Vorontsov
FlatBreakout (Free Version) Flat Range Detector and Breakout Panel for MT4 — GBPUSD Only FlatBreakout is the free version of the professional FlatBreakoutPro indicator, specially designed for flat (range) detection and breakout signals on the GBPUSD pair only. Perfect for traders who want to experience the unique fractal logic of FlatBreakout and test breakout signals on a live market without limitations. Who Is This Product For? For traders who prefer to trade breakout of flat ranges (breakout,
FREE
Two Period RSI
Libertas LLC
5 (4)
Two Period RSI compares long-term and short-term RSI lines, and plots a fill between them for improved visualization. Fill is colored differently according to an uptrend (short period RSI above long period RSI) or a downtrend (short period RSI below long period RSI). Short-term RSI crossing long-term RSI adds a more robust trend confirmation signal than using single period RSI alone. This is a small tool to help visualize and confirm RSI trends. We hope you enjoy! Looking for RSI alerts? You can
FREE
Wavetrend Oscillator Indicator — Version 1.0 The Wavetrend Oscillator is a momentum-based technical analysis tool. It is designed to highlight potential momentum shifts, areas that may be overbought or oversold, and the prevailing bias when confirmed by a higher timeframe filter. How it works WT1 and WT2 Lines : Crossovers between these lines are used to indicate changes in momentum. WT1 crossing above WT2 suggests bullish conditions. WT1 crossing below WT2 suggests bearish conditions. WT3 High
FREE
Description: The indicator measures, through the zigzag indicator, the levels of trend or correction. It shows in the chart the levels of each low or high detected. KEY LINKS:   How to Install  –  Frequent Questions  -  All Products  How is this indicator useful? This indicator determines, depending on Zigzag parameter if a trend is beginning, developing, or ending This indicator determines the direction of the trend Components Levels as positive or negative numbers, depending on the direction
FREE
Special offer : ALL TOOLS , just $35 each! New tools   will be   $30   for the   first week   or the   first 3 purchases !  Trading Tools Channel on MQL5 : Join my MQL5 channel to update the latest news from me Maximize your trading edge with Follow Line with Scanner, an advanced volatility-based indicator designed for serious traders. This tool combines the power of Bollinger Bands with customizable settings, offering precise insights into price movements. See more MT5 version at:   Follow Lin
FREE
Triple RSI
Pablo Leonardo Spata
1 (1)
LOOK AT THE FOLLOWING STRATEGY WITH THIS INDICATOR. Triple RSI is a tool that uses the classic Relative Strength Indicator, but in several timeframes to find market reversals.    1.  ️ Idea behind the indicator and its strategy: In Trading, be it Forex or any other asset, the ideal is to keep it simple, the simpler the better . The triple RSI strategy is one of the simple strategies that seek market returns. In our experience, where there is more money to always be won, is in the marke
FREE
Basic Harmonic Pattern
Mehran Sepah Mansoor
4.58 (59)
This indicator identifies the most popular   Harmonic Patterns   which predict market reversal points.  These harmonic patterns are price formations that are constantly repeating in the forex market and suggest possible future price movements /    Free MT5 Version Dashboard Scanner for this indicator: ( Basic Harmonic Patterns Dashboard ) Comparison of "Basic Harmonic Pattern" vs. "Basic Harmonic Patterns Dashboard" Indicators Feature Basic Harmonic Pattern Basic Harmonic Patterns Dashboard Fu
FREE
Aroon Classic
Etsushi Ishizuka
Overview of the Aroon Classic Indicator The Aroon Classic indicator is a technical tool that quantitatively identifies the emergence and persistence of trends on a chart. It uses two lines—“Aroon Up” and “Aroon Down”—to display trend strength and turning points within a range of 0–100. A higher Aroon Up value indicates a stronger uptrend, while a higher Aroon Down value indicates a stronger downtrend. Key Features Visually distinguishes trend initiation and reversal Customizable calculation peri
FREE
Volume Analysis Indicator MT4
Ahmad Ar Abedalaziz Alazaizeh
This indicator integrates the Bollinger Band strategy in calculation with a volume-over-MA calculation to further narrow down "Areas of Interest" levels for a potential re-test zone to the right of the chart. We added a Moving Average calculation for a multi-level cloud and further broke down more conditions to highlight both volume flow crossover on the High and Extreme High MA's and also high and extreme high volume spikes on set period average without bull\bear conditions. Original Bull/Bear
FREE
Analyze volatility by clicking on a specific candlestick, which triggers the display of horizontal grid lines centered around the candlestick’s closing price, spaced by multiples of the calculated ATR. A vertical line highlights the selected candlestick, and an optional text label can display the ATR value in pips above the candlestick. The indicator is lightweight, using no buffers, and relies on chart objects for visualization. It includes error handling for invalid candlestick selections and
FREE
Investment Castle RSI Divergence
Ahmed Alaaeldin Abdulrahman Ahmed Elherzawi
The RSI Divergence Indicator is a powerful tool designed to identify potential reversals in the market by spotting discrepancies between the Relative Strength Index (RSI) and price movement. Divergences can be a significant indication of an impending trend change, either from bullish to bearish or vice versa. This indicator is built for making the task of identifying potential trade opportunities more straightforward and efficient. Features: Automatic Detection: The indicator scans the chart f
FREE
ENGLISH DESCRIPTION (MQL5 Standard Optimized) Product Name: TempestLightning – Elliott Wave Pro (MT4) [Subtitle: ZigZag Wave 3 Hunter | Market Health Monitor | USD Risk Logic] Introduction TempestLightning is a professional trading system designed to automate the complex Elliott Wave theory. Instead of guessing wave counts, this EA uses a precision ZigZag algorithm to identify the classic 1-2-3 structure and targets the highly profitable Wave 3 impulse. Stacked with a multi-factor filter engine
FREE
This is a regression tree indicator for MT4/MT5. This indicator classificate nodes on the time period so that the deviation becomes smaller, and displays regression line and channel for each node. It's free! Attached CartDemo.ex4 and CartDemo.ex5 is a Demo version and has the following limitations: Can't use HighSpeed method (default method is RandomForest) Maximum number of bars is 260 (increase from 200) There is no expiration date and can be started many times, but it stops after an hour.
FREE
Head and Shoulders Pattern Indicator - Your Key to Recognizing Trend Reversals Unlock the power of pattern recognition with the "Head and Shoulders Pattern Indicator." This cutting-edge tool, designed for MetaTrader, is your trusted ally in identifying one of the most powerful chart patterns in technical analysis. Whether you're a novice or an experienced trader, this indicator simplifies the process of spotting the Head and Shoulders pattern, allowing you to make informed trading decisions. Key
FREE
MACD Predictor MT4
Jianyuan Huang
5 (1)
Macd Predictor   Macd's main chart indicator If you like this indicator , Dinapoli Levels Expansion and Retracement Demo is a helpful tool: https://www.mql5.com/en/market/product/35884 1. You can determine the price at which the MACD will change from buy to sell, and vice versa. It is the cousin of the oscillator predictor. If you know a position at the time, then the exact price, current and next (future) columns will need to reach the MACD crossover. You can also see how far the market has to
FREE
Buyers of this product also purchase
Gann Made Easy
Oleg Rodin
4.83 (156)
Gann Made Easy is a professional and easy to use Forex trading system which is based on the best principles of trading using the theory of W.D. Gann. The indicator provides accurate BUY and SELL signals including Stop Loss and Take Profit levels. You can trade even on the go using PUSH notifications. PLEASE CONTACT ME AFTER PURCHASE TO GET TRADING  INSTRUCTIONS AND GREAT EXTRA INDICATORS   FOR FREE! Probably you already heard about the Gann trading methods before. Usually the Gann theory is a ve
Scalper Inside PRO
Alexey Minkov
4.74 (69)
An exclusive indicator that utilizes an innovative algorithm to swiftly and accurately determine the market trend. The indicator automatically calculates opening, closing, and profit levels, providing detailed trading statistics. With these features, you can choose the most appropriate trading instrument for the current market conditions. Additionally, you can easily integrate your own arrow indicators into Scalper Inside Pro to quickly evaluate their statistics and profitability. Scalper Inside
M1 Sniper
Oleg Rodin
5 (20)
M1 SNIPER is an easy to use trading indicator system. It is an arrow indicator which is designed for M1 time frame. The indicator can be used as a standalone system for scalping on M1 time frame and it can be used as a part of your existing trading system. Though this trading system was designed specifically for trading on M1, it still can be used with other time frames too. Originally I designed this method for trading XAUUSD and BTCUSD. But I find this method helpful in trading other markets a
Atomic Analyst
Issam Kassas
5 (4)
First of all Its worth emphasizing here that this Trading Indicator is   Non-Repainting , Non Redrawing and Non Lagging Indicator   Indicator, Which makes it ideal from both manual and robot trading.  User manual: settings, inputs and strategy . The Atomic Analyst  is a PA Price Action Indicator that uses Strength and Momentum of the price to find a better edge in the market. Equipped with Advanced filters which help remove noises and false signals, and Increase Trading Potential. Using Multiple
Linear Trend Predictor - A trend indicator that combines entry points and direction support lines. It works on the principle of breaking through the High/Low price channel. The indicator algorithm filters market noise, takes into account volatility and market dynamics. Indicator capabilities Using smoothing methods, it shows the market trend and entry points for opening BUY or SELL orders. Suitable for determining short-term and long-term market movements by analyzing charts on any timeframes.
The " Dynamic Scalper System " indicator is designed for the scalping method of trading within trend waves. Tested on major currency pairs and gold, compatibility with other trading instruments is possible. Provides signals for short-term opening of positions along the trend with additional price movement support. The principle of the indicator. Large arrows determine the trend direction. An algorithm for generating signals for scalping in the form of small arrows operates within trend waves.
Trend Screener
STE S.S.COMPANY
4.79 (95)
Trend Screener Indicator --Professional Trend Trading & Market Scanning System for MetaTrader Unlock the true power of trend trading with Trend Screener Indicator — a complete multi-currency, multi-timeframe trend analysis solution   powered by Fuzzy Logic,Trend Pulse Technology  and advanced market structure algorithms.   Trend Screener transforms your MetaTrader platform into a professional-grade Trend Analyzer and Market Scanner, helping you identify high-probability trend opportunities, ear
Trend Lines PRO
Roman Podpora
5 (1)
TREND LINES PRO    helps understand where the market is truly changing direction. The indicator shows real trend reversals and points where major players re-enter. You see   BOS lines   Trend changes and key levels on higher timeframes — without complex settings or unnecessary noise. Signals don't repaint and remain on the chart after the bar closes. VERSION MT 5     -     Reveals its maximum potential when paired with the   RFI LEVELS PRO  indicator What the indicator shows: Real shifts   tren
NAM Order Blocks
NAM TECH GROUP, CORP.
3.67 (3)
MT4 Multi-timeframe Order Blocks detection indicator. Features - Fully customizable on chart control panel, provides complete interaction. - Hide and show control panel wherever you want. - Detect OBs on multiple timeframes. - Select OBs quantity to display. - Different OBs user interface. - Different filters on OBs. - OB proximity alert. - ADR High and Low lines. - Notification service (Screen alerts | Push notifications). Summary Order block is a market behavior that indicates order collection
GOLD Impulse with Alert
Bernhard Schweigert
4.67 (12)
This indicator is a super combination of our 2 products  Advanced Currency IMPULSE with ALERT  and  Currency Strength Exotics . It works for all time frames and shows graphically impulse of strength or weakness for the 8 main currencies plus one Symbol! This Indicator is specialized to show currency strength acceleration for any symbols like Gold, Exotic Pairs, Commodities, Indexes or Futures. Is first of its kind, any symbol can be added to the 9th line to show  true currency strength accelerat
MTF Supply Demand Zones
Georgios Kalomoiropoulos
4.82 (22)
Next Generation Of Automated Supply And Demand Zones. New and Innovative Algorithm that Works At Any Chart. All Zones Are Being Created Dynamically According To Price Action Of The Market. AMAZING OFFER --> Activations from 5 to 20 for "MTF Supply Demand Zones" and "Automated Trendlines" If you get the MTF Supply Demand Zones you can join the " Trade Like Me " Video Series. It contains 14 Live Sessions where  i am placing trades on Forex, Stocks, Indices and Metals. You will be able to see ho
MetaForecast M4
Vahidreza Heidar Gholami
5 (2)
MetaForecast predicts and visualizes the future of any market based on the harmonics in price data. While the market is not always predictable, if there is a pattern in the price, MetaForecast can predict the future as accurately as possible. Compared to other similar products, Metaforecast can generate more accurate results by analyzing market trends. Input Parameters Past size Specifies the number of bars that MetaForecast uses to create a model for generating future predictions. The model is
Introducing the Delta Volume Profile Indicator - Unleash the Power of Institutional Precision!  Technical Indicator: Are you ready to trade like the pros? The Delta Volume Profile Indicator is no ordinary tool. It’s a high-precision, cutting-edge indicator that puts the power of institutional-grade trading in your hands. This unique indicator analyses delta volume distribution in real-time, revealing the market's hidden buy/sell imbalances that the biggest financial institutions rely on to antic
RFI levels PRO
Roman Podpora
5 (1)
The indicator accurately shows the reversal points and price return zones where the   Major players . You see where new trends are forming and make decisions with maximum precision, maintaining control over every trade. VERSION MT5     -     Reveals its maximum potential when combined with the   TREND LINES PRO   indicator What the indicator shows: Reversal structures and reversal levels with activation at the beginning of a new trend. Display of   TAKE PROFIT   and   STOP LOSS   levels with mi
TPSpro RFI Levels
Roman Podpora
4.86 (28)
INSTRUCTIONS RUS   /   INSTRUCTIONS   ENG   -   VERSION  MT5 Main functions: Displays active zones of sellers and buyers! The indicator displays all the correct first impulse levels/zones for purchases and sales. When these levels/zones are activated, where the search for entry points begins, the levels change color and are filled with certain colors. Arrows also appear for a more intuitive perception of the situation. LOGIC AI - Display of zones (circles) for searching entry points when activa
Adaptive Volatility Range [AVR] is a powerful tool for identifying key trend reversal points. AVR accurately reflects the Average True Range (ATR) of volatility, taking into account the Volume-Weighted Average Price (VWAP). The indicator adapts to any market volatility by calculating the average volatility over a specific period, ensuring a stable rate of profitable trades. You receive not just an indicator but a professional automated trading system , AVR-EA . Advantages: Automated Trading Sys
Dynamic Forex28 Navigator
Bernhard Schweigert
4.43 (7)
Specials Discount now. The Next Generation Forex Trading Tool. Dynamic Forex28 Navigator is the evolution of our long-time, popular indicators, combining the power of three into one: Advanced Currency Strength28 Indicator (695 reviews) + Advanced Currency IMPULSE with ALERT (520 reviews) + CS28 Combo Signals (recent Bonus) Details about the indicator  https://www.mql5.com/en/blogs/post/758844 What Does The Next-Generation Strength Indicator Offer? Everything you loved about the originals, now
Super Reversal Indicator with Alert Overview Super Reversal Indicator with Alert is a multi timeframe trading tool designed to identify high probability market reversal opportunities using a combination of stochastic momentum, supply and demand zones, and price rejection signals. The indicator helps traders detect potential turning points in the market with clear visual signals and real time alerts. Key Features Multi Timeframe Stochastic Analysis Uses stochastic oscillator from a higher timefra
Free Test Drive Available (EURUSD & AUDUSD) Access via the official BlueDigitsFx Discord Server Test the indicator before upgrading to the full version BlueDigitsFx Easy 123 System — Powerful Reversal and Breakout Detection for MT4 All-In-One Non-Repaint System for Spotting Market Reversals and Breakouts – Built for Newbie and Expert Traders The BlueDigitsFx Easy 123 System is a visual and alert-based MT4 indicator that helps you detect market structure shifts, breakouts, and trend reversals w
Advanced Supply Demand
Bernhard Schweigert
4.91 (299)
Trading Special – 40% OFF Best Solution for any Newbie or Expert Trader! This indicator is a unique, high quality and affordable trading tool because we have incorporated a number of proprietary features and a new formula. With this update, you will be able to show double timeframe zones. You will not only be able to show a higher TF but to show both, the chart TF, PLUS the higher TF: SHOWING NESTED ZONES. All Supply Demand traders will love it. :) Important Information Revealed Maximize the pot
LIMITED TIME SALE - 30% OFF! WAS $50 - NOW JUST $35! Profit from market structure changes as price reverses and pulls back. The market structure reversal alert indicator identifies when a trend or price move is approaching exhaustion and ready to reverse. It alerts you to changes in market structure which typically occur when a reversal or major pullback are about to happen. The indicator identifies breakouts and price momentum initially, every time a new high or low is formed near a po
Currency Strength Wizard is a very powerful indicator that provides you with all-in-one solution for successful trading. The indicator calculates the power of this or that forex pair using the data of all currencies on multiple time frames. This data is represented in a form of easy to use currency index and currency power lines which you can use to see the power of this or that currency. All you need is attach the indicator to the chart you want to trade and the indicator will show you real str
Volatility Trend System - a trading system that gives signals for entries. The volatility system gives linear and point signals in the direction of the trend, as well as signals to exit it, without redrawing and delays. The trend indicator monitors the direction of the medium-term trend, shows the direction and its change. The signal indicator is based on changes in volatility and shows market entries. The indicator is equipped with several types of alerts. Can be applied to various trading ins
Super Signal Market Slayer No Repaint | High Accuracy | Multi-Market Intelligent Trend Indicator In trading, the real challenge is not placing an order, but clearly seeing when a trend has truly begun amid market noise. Market Slayer was created for this purpose. It is a no-repaint intelligent indicator designed specifically for intraday trading. Through multi-layer confirmation and trend-filtering logic, it delivers clear and reliable Buy / Sell signals only at key moments. Key Advantages No r
TrendLine PRO MT4
Evgenii Aksenov
4.83 (167)
The Trend Line PRO indicator is an independent trading strategy. It shows the trend change, the entry point to the transaction, as well as automatically calculates three levels of Take Profit and Stop Loss protection. Trend Line PRO is perfect for all Meta Trader symbols: currencies, metals, cryptocurrencies, stocks and indices. The indicator is used in trading on real accounts, which confirms the reliability of the strategy. Robots using   Trend Line PRO   and real Signals can be found here:   
Stratos Pali
Michela Russo
4.43 (7)
Stratos Pali Indicator   is a revolutionary tool designed to enhance your trading strategy by accurately identifying market trends. This sophisticated indicator uses a unique algorithm to generate a complete histogram, which records when the trend is Long or Short. When a trend reversal occurs, an arrow appears, indicating the new direction of the trend. Important Information Revealed Leave a review and contact me via mql5 message to receive My Top 5 set files for Stratos Pali at no cost! Dow
FX Power MT4 NG
Daniel Stein
4.95 (21)
FX Power: Analyze Currency Strength for Smarter Trading Decisions Overview FX Power is your go-to tool for understanding the real strength of currencies and Gold in any market condition. By identifying strong currencies to buy and weak ones to sell, FX Power simplifies trading decisions and uncovers high-probability opportunities. Whether you’re looking to follow trends or anticipate reversals using extreme delta values, this tool adapts seamlessly to your trading style. Don’t just trade—trade
Matrix Arrow Indicator MT4
Juvenille Emperor Limited
5 (3)
Matrix Arrow Indicator MT4  is a unique 10 in 1 trend following 100% non-repainting  multi-timeframe indicator that can be used on all symbols/instruments: forex, commodities, cryptocurrencies, indices, stocks.  Matrix Arrow Indicator MT4 will determine the current trend at its early stages, gathering information and data from up to 10 standard indicators, which are: Average Directional Movement Index (ADX) Commodity Channel Index (CCI) Classic Heiken Ashi candles Moving Average Moving Avera
Scalper Vault
Oleg Rodin
5 (36)
Scalper Vault is a professional scalping system which provides you with everything you need for successful scalping. This indicator is a complete trading system which can be used by forex and binary options traders. The recommended time frame is M5. The system provides you with accurate arrow signals in the direction of the trend. It also provides you with top and bottom signals and Gann market levels. The indicator provides all types of alerts including PUSH notifications. PLEASE CONTACT ME AFT
After purchase, contact me privately to receive 7 days of free testing with EA Forex Proton. This advanced MT4 trading robot automatically executes signals from any MT4 indicator, including Market Makers. The latest version also includes AI integration, allowing each trade signal to be analyzed using Artificial Intelligence. Market Makers is a powerful price action trading system designed to identify high-probability Buy and Sell opportunities based on market momentum, volatility, and price po
More from author
MQL Universal EA
Martin Eshleman
4.33 (12)
Summary of the Expert Advisor This EA will trade using standard MT4 indicators such as Moving Averages, MACD, RSI, Bollinger Bands, and so on. The EA was made so that these indicators can be mixed or matched so a number of possibilities can be traded with. Each indicator can be enabled or disabled and many settings are adjustable for each indicator. There are also other features included like multiple time frame capability and money management. As a result, many different trading strategies can
FREE
MQL Trendline EA
Martin Eshleman
3 (2)
Summary This EA will trade semi-automatically based on trend lines or horizontal lines that are manually plotted on the chart by the user. It can handle any number of lines per chart and each line can have its own adjustable settings. This EA manages every line separately based on specific user 'keywords' set for each line. Since each line has it's own independent settings, this is why there are very few shared inputs in this EA. Doing it this way allows for a single EA to manage many lines and
FREE
Fibonacci SR Indicator
Martin Eshleman
5 (1)
Fibonacci SR Indicator This indicator creates support and resistance lines. This indicator is based on Fibonacci Retracement and Extension levels. It will consider many combinations of the Fibonacci levels and draw support/resistance lines based on these. This indicator uses tops and bottoms drawn by the ZigZag indicator in its calculations. The ZigZag can also be drawn on the chart, if necessary. The indicator considers many combinations of past reversal points and Fibonacci ratio levels, and w
FREE
Auto ZZ SR Indicator This indicator automatically draws trend lines using ZigZag top and bottom points. The more ZigZag tops/bottoms that are used, the greater the number of possible combinations. Therefore, the more possible trend lines can be drawn. And vice versa too. The fewer ZigZag tops/bottoms that are used, the lower the number of possible combinations. And therefore, the fewer the possible trend lines can be drawn. The indicator constantly updates the trend lines on the chart as the mar
FREE
Summary This indicator is based on RSI and Momentum indicators. It also considers moving averages of these two indicators. The three indicators have adjustable settings. The arrows do not repaint since the indicator only uses confirmed values and waits for the candle to close before painting an arrow. The indicator is also able to alert when arrows appear. There are 3 types of alerts - Popup, Email and Mobile Push Notifications. The arrows can be used in the EA and the inputs can also be optimiz
FREE
MQL Random EA
Martin Eshleman
3.33 (3)
Summary: This EA places a single trade at a time in a RANDOM direction (buy or sell) and uses a simple TP & SL. A lot multiplier is also optional. Once a trade hits TP/SL, it will place another trade in a random direction. And so on. Since it only ever has 1 trade open at a time, it can be used on any broker. Which means it can be used on US brokers with the FIFO rule. Inputs are few and everything is based in Points too. So it can be used on any chart reliably and easily. You will be amazed how
FREE
Custom Pattern Detector Indicator This indicator lets you define your own custom pattern instead of the typical candlestick patterns. Everybody already knows about common candlestick patterns like the Doji pattern. This indicator is different though. The pattern you will define is a custom pattern based on CANDLE FORMATIONS . Once the indicator knows the pattern you want it to look for, then it will go through history on the chart and find matching patterns, make them visible to you, and calcula
FREE
MA Momentum Arrows
Martin Eshleman
4.67 (3)
Summary This indicator is based on the MA applied to the Momentum indicator. It draws arrows at the confirmed crosses of the MA over the Momentum line. When the MA crosses upwards, then a buy arrow is displayed and vice versa. The arrows do not repaint since the indicator only uses confirmed values and waits for the candle to close before painting an arrow. The indicator is also able to alert when arrows appear. There are 3 types of alerts - Popup, Email and Mobile Push Notifications. Inputs Al
FREE
Cycles Predictor Indicator This indicator uses past market cycles to predict future price movements. The indicator scans through past data and considers  combinations  of cycles. When cycles  coincide  at the same future date/time then it is considered a valid future prediction. The predictions are drawn as vertical lines on the right side of the chart in the future. A prediction will often result in type of candle (ex. bull or bear) and/or a reversal point (ex. bottom or top) forming at this ex
Gann Time Clusters
Martin Eshleman
2.5 (2)
Gann Time Clusters Indicator This indicator is based on W. D. Gann's Square of 9 method for the time axis. It uses past market reversal points and applies the mathematical formula for Gann's Square of 9 and then makes projections into the future. A date/time where future projections line up is called a 'time cluster'. These time clusters are drawn as vertical lines on the right side of the chart where the market has not advanced to yet. A time cluster will result in a market reversal point (ex.
Filter:
Geoffrey Lowes
18
Geoffrey Lowes 2021.01.17 00:48 
 

Great indy, but could be improved by using a moving average filter so the arrows appear only in the direction of the ma.

Артем Козлов
204
Артем Козлов 2018.03.21 22:02 
 

User didn't leave any comment to the rating

Gennadiy Voltornist
11909
Gennadiy Voltornist 2017.11.25 20:36 
 

User didn't leave any comment to the rating

Maksym Mudrakov
30050
Maksym Mudrakov 2016.08.31 07:34 
 

User didn't leave any comment to the rating

Reply to review