MA RSI Arrows
- Indicadores
- Versión: 1.11
- Actualizado: 23 febrero 2024

Resumen
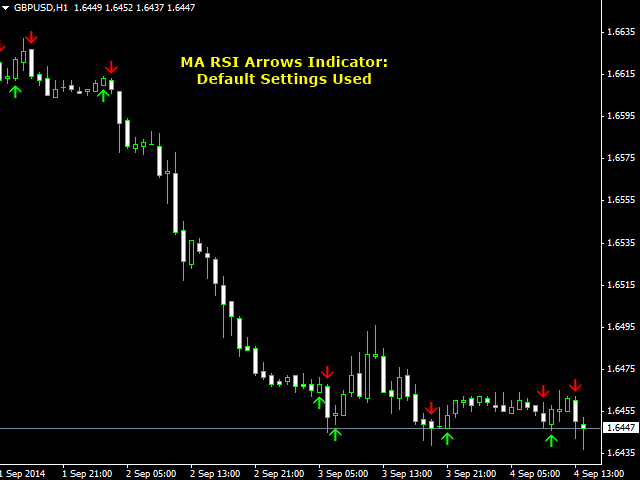
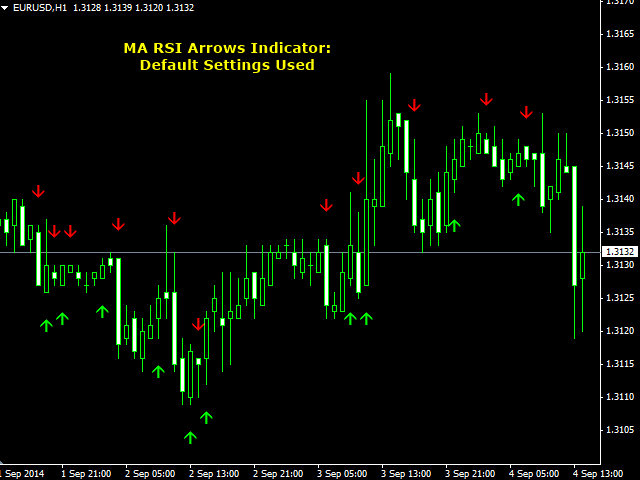
Este indicador se basa en la MA aplicada al indicador RSI. Dibuja flechas en los cruces confirmados de la MA sobre la línea del RSI. Cuando la MA cruza hacia arriba, entonces se muestra una flecha de compra y viceversa. Las flechas no se repintan ya que el indicador sólo utiliza valores confirmados y espera a que la vela se cierre antes de pintar una flecha. El indicador también es capaz de alertar cuando aparecen las flechas. Hay 3 tipos de alertas - Popup, Email y Notificaciones Móviles Push.
Entradas
- Todas las entradas son estándar, auto-explicativo y fácil de usar. Sin embargo, si tienes alguna duda, sólo tienes que preguntar.
Notas
- ¡IMPORTANTE: Echa un vistazo a nuestro sitio usando el enlace en mi perfil para encontrar otros indicadores y EAs GRATIS!


Great indy, but could be improved by using a moving average filter so the arrows appear only in the direction of the ma.