Peaks and Troughs MT5

5
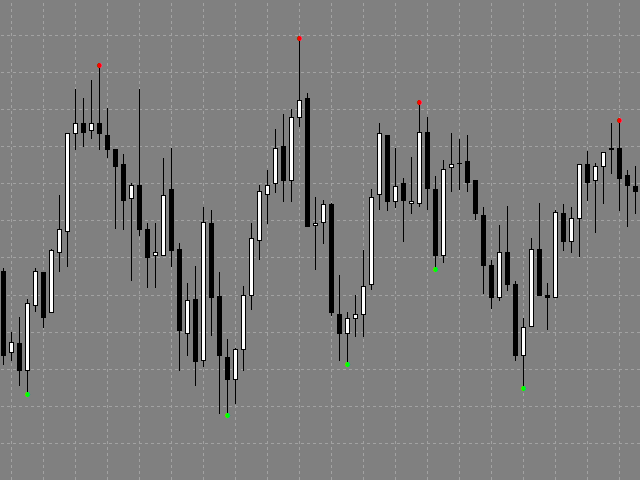
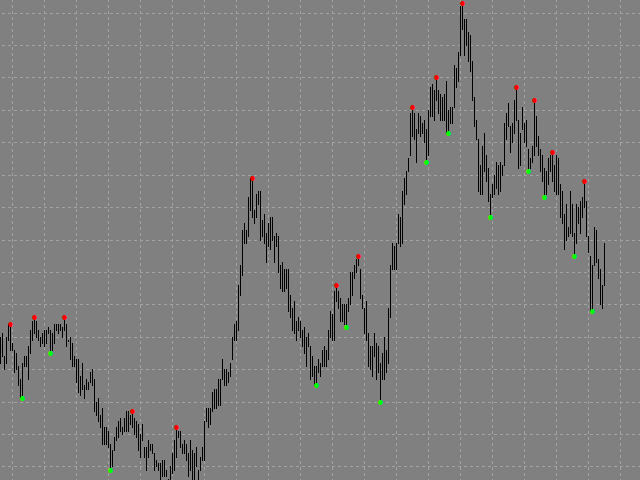
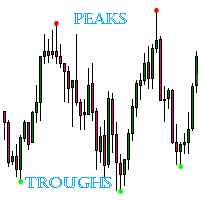
The indicator detects important peaks and troughs (extremes) on the chart.
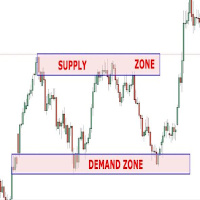
These points can be used to plot support/resistance levels and trend lines, as well as any other graphical analysis.
These points can serve as reference points for setting trading orders.
The indicator does not redraw.

Settings:

  • Size_History - the size of the calculated history.
  • Num_Candles_Right - number of candles to the right of the peak or trough.
  • Num_Candles_Left - number of candles to the left of the peak or trough.
  • Type_Arrows_extremum - label style.
  • Send_Sound - sound alert.  
  • Send_Mail - send an email notification.  
  • Send_Notification - send a mobile notification.  
  • Send_Alert - standard terminal alert.
Reviews 1
krisnara123
2210
krisnara123 2021.05.04 05:22 
 

This indicator helps finding peaks and valleys .It uses green and red dots .By using the "number of candles" parameter,one can qualify the type of swing .The dots dont repaint which was important criteria for me.The peaks and troughs dots also make drawing trend lines and pitchforks easier.It is visually pleasing to the eyes.

Recommended products
ArcTracer
Syed Oarasul Islam
This Indicator draws Fibonacci Arc levels in two different ways. You can select whether to draw Fibonacci Arc levels based on your favourite ZigZag settings or you can let the indicator to draw Arc levels based on given number of bars or candles.  You can also set Mobile and Email notification for your favourite Arc levels individually. With this indicator you will not have to feel lonely as the it can generate Voice alerts, which will keep you focused on your trading and remove boredom.  Produc
FibExtender
Syed Oarasul Islam
This Indicator draws Fibonacci Extension levels in two different ways. You can select whether to draw Fibonacci Extension levels based on your favourite ZigZag settings or you can let the indicator to draw Fibonacci Extension  level based on given number of Bars or Candles.  You can also set Mobile and Email notification for your favourite Extension  levels individually. With this indicator you will not have to feel lonely as the it can generate Voice alerts, which will keep you focused on your
Easy Indy
Vinutthapon Bumroong
This indicator automatically draws trendlines, Fibonacci levels, support and resistance zones, and identifies BOS (Break of Structure) and CHOCH (Change of Character) patterns on the chart. Just by placing it on the graph, it handles the essential technical analysis tasks for traders, providing a streamlined, effective trading tool this tools is alway make every one easy for trading.

Wolfe Wave Scanner MT5
Reza Aghajanpour
5 (7)
**  All Symbols  x  All Timeframes  scan just by pressing scanner button ** *** Contact me  to send you instruction and add you in "Wolfe Wave Scanner group" for sharing or seeing experiences with other users. + FREE   Trading Utility MT5 Introduction: A Wolfe Wave is created with five-wave patterns in price. It shows supply and demand and a fight towards a balance price. T hese waves of price actions can help traders identify the boundaries of   the trend . Also  It helps forecast how the pric
"Hunttern harmonic pattern finder" base on the dynamic zigzag with the notification and prediction mode This version of the indicator identifies 11 harmonic patterns and predicts them in real-time before they are completely formed. It offers the ability to calculate the error rate of Zigzag patterns depending on a risk threshold. It moreover sends out a notification once the pattern is complete. The supported patterns: ABCD BAT ALT BAT BUTTERFLY GARTLEY CRAB DEEP CRAB CYPHER SHARK THREE DRIV
Matreshka
Dimitr Trifonov
5 (2)
Matreshka self-testing and self-optimizing indicator: 1. Is an interpretation of the Elliott Wave Analysis Theory. 2. Based on the principle of the indicator type ZigZag, and the waves are based on the principle of interpretation of the theory of DeMark. 3. Filters waves in length and height. 4. Draws up to six levels of ZigZag at the same time, tracking waves of different orders. 5. Marks Pulsed and Recoil Waves. 6. Draws arrows to open positions 7. Draws three channels. 8. Notes support and re

GDS Renko Entry Helper - Free Renko Price Interaction Indicator for MetaTrader 5 GDS Renko Entry Helper is a free Renko price interaction indicator for MetaTrader 5. It helps traders highlight important areas where price reacts, slows down, returns to a zone or changes behavior around support and resistance. The tool is designed for manual Renko analysis. It does not generate buy or sell signals and does not tell the trader when to enter the market. Its purpose is to help focus attention on area
Представлен принципиально новый индикатор ZigZag, который отличается от стандартного абсолютной легкостью, быстродействием расчетов и очень высокой точностью. В основе индикатора заложен принцип цикличности рынка с совокупностью анализа количества текущих баров и их основных ценовых уровней. Чем меньше баров для определения расчетов, тем более агрессивная постройка линий индикатора. Как и в  стандартном индикаторе перерисовывается только последняя линия, при изменении достигнутого экстремума. П
Market Trend Indicator Analog Copyright 2025, Jose María Molina Sánchez molinatrader67@gmail.com | Version 1.00 Introduction The Market Trend Indicator Analog is an advanced indicator designed to measure the strength and direction of market trends in real time. Unlike traditional oscillators, this indicator uses an adaptive filtering system that dynamically responds to market conditions, providing a precise analog representation between -100 and +100. Its design allows traders to ide
Auto Fib Retracements
Ross Adam Langlands Nelson
4.2 (5)
Automatic Fibonacci Retracement Line Indicator. This indicator takes the current trend and if possible draws Fibonacci retracement lines from the swing until the current price. The Fibonacci levels used are: 0%, 23.6%, 38.2%, 50%, 61.8%, 76.4%, 100%. This indicator works for all charts over all timeframes. The Fibonacci levels are also recorded in buffers for use by other trading bots. Any comments, concerns or additional feature requirements are welcome and will be addressed promptly. 
FREE
Unlock powerful breakout opportunities The 123 Pattern is one of the most popular, powerful and flexible chart patterns. The pattern is made up of three price points: a bottom, a peak or valley, and a Fibonacci retracement between 38.2% and 71.8%. A pattern is considered valid when the price breaks beyond the last peak or valley, moment at which the indicator plots an arrow, rises an alert, and the trade can be placed. [ Installation Guide | Update Guide | Troubleshooting | FAQ | All Products  ]
Welcome to the Ultimate Harmonic Patterns recognition indicator that is focused to detect advanced patterns. The Gartley pattern, Bat pattern, and Cypher pattern  are popular technical analysis tools used by traders to identify potential reversal points in the market. Our Ultimate Harmonic Patterns recognition Indicator is a powerful tool that uses advanced algorithms to scan the markets and identify these patterns in real-time. With our Ultimate Harmonic Patterns recognition Indicator, you ca
AutoTrend Pro
Aram Hussein Mohammed
TL Method — Automatic Trendline Detection & Strength Indicator Tired of drawing trendlines manually? TL Method does it for you — automatically detecting, drawing, and scoring trendlines in real time. What it does: Scans up to 1000 bars to find valid support and resistance trendlines Scores each trendline by counting confirmed anchor touches Generates buy/sell signal arrows when price approaches strong trendlines Alerts you via popup, push notification, or sound — with smart cooldown to avoid spa
This is a well-known ZigZag indicator. But it differs by the fact that its plot is based on values of the middle line which is set by a user. It can display Andrews’ Pitchfork and standard or Bobokus Fibo levels. NO REPAINTING. Parameters Period МА — middle line period. Default value is 34. Minimum value is 4. Maximum value is set at your discretion. Used to calculate price — type of price used for the midline calculations. The averaging method — type of smoothing for the middle line. Turning p
Scan pattern
VLADISLAV AKINDINOV
The indicator is designed to help in making a decision on the direction of trading (buy or sell). It is a history scanner that searches for matches of the current pattern (combination of several current bars) with historical data in percentage terms by the relative vertical position of candles relative to each other, the size of each candle, the size of the candle body and the candle shadows. In history, the matches found are indicated by vertical lines on the candle of the beginning of the soug
Historical Pivot Zones - Fibonacci Indicator MT5 Automatically draws Fibonacci retracement and projection zones based on historical price pivots. This MT5 indicator intelligently selects pivot points from different timeframes (weekly, monthly, or 6-month ranges) and creates visual Fibonacci zones around key levels. Features include: Smart Mode Selection - Auto-adjusts based on your chart timeframe Clean Visual Zones - Highlighted areas instead of just lines Essential Fib Levels - 9 retrace
Levels Map
AL MOOSAWI ABDULLAH JAFFER BAQER
Levels Map See the market through its most important price levels. Levels Map is a professional MetaTrader utility that automatically identifies and displays significant market price levels directly on your chart. Designed to help traders visualize key areas of support, resistance, and market structure, Levels Map provides a clearer understanding of where price is likely to react before making trading decisions. Instead of manually drawing horizontal lines and constantly updating your charts, Le
VAMA Signal Simulator scans 7 timeframes (M1-D1, weighted 5% to 30%) and scores each on 4 moving averages plus 6 oscillators, combining them into a weighted Strong Buy/Buy/Neutral/Sell/Strong Sell reading. A confirmed signal must also agree with a volatility-adaptive H4 moving average (period shortens in high volatility, lengthens in calm markets) AND both M15 and H1 trend direction. Every confirmed signal gets an arrow and a BUY/SELL label on the chart, colored by direction, plus a CSV log entr
Introduction to X3 Chart Pattern Scanner X3 Cherart Pattern Scanner is the non-repainting and non-lagging indicator detecting X3 chart patterns including Harmonic pattern, Elliott Wave pattern, X3 patterns, and Japanese Candlestick patterns. Historical patterns match with signal patterns. Hence, you can readily develop the solid trading strategy in your chart. More importantly, this superb pattern scanner can detect the optimal pattern of its kind. In addition, you can switch on and off individu
Trade smarter, not harder: Empower your trading with Harmonacci Patterns This is arguably the most complete harmonic price formation auto-recognition indicator you can find for the MetaTrader Platform. It detects 19 different patterns, takes fibonacci projections as seriously as you do, displays the Potential Reversal Zone (PRZ) and finds suitable stop-loss and take-profit levels. [ Installation Guide | Update Guide | Troubleshooting | FAQ | All Products  ] It detects 19 different harmonic pric
Golden Delta Library — Free MT5 Tools Market Description Short Description Golden Delta Library is a free MT5 toolkit for traders who want cleaner chart structure, Renko-based context, risk planning, and practical execution panels. Renko EDGE EA Golden Delta | Algo Trading Research Updates, research and new developments: https://www.mql5.com/en/channels/golden-delta The collection includes Renko indicators, SuperTrend / ADX Renko variants, XAUUSD helper panels, and RiskLab TradeDesk tools. Ea
Babel Assistant
Iurii Bazhanov
4.33 (9)
Babel assistant 1 The MT5 netting robot "Babel_assistant_1" uses the ZigZag indicator to generate Fibonacci levels across M1, M5, M15, H1, H4, D1, and W1 timeframes, and calculates the strength of buy and sell trends. It opens a position using the "Lot for open a position" setting if the specified trend level of 4.925 is exceeded. Then, Babel places pending orders at certain Fibonacci levels and sets the specified Stop Loss and Take Profit lines. The screen displays the current results of the po
FREE
Pivot Day Master is an automated, lightweight, and highly reliable technical analysis tool designed for MetaTrader 5. It automatically calculates and draws Daily Pivot Points, key Resistance and Support levels (R1-R3, S1-S3), as well as the Daily Open Price line directly on your chart. Whether you are a day trader, scalper, or swing trader, key Pivot levels serve as high-probability reaction zones for price action, breakouts, and trend reversals. Key Features: Automatic Daily Calculation: Automa
Trend Channel is a Forex trend arrow indicator for identifying potential entry points. I like it, first of all, because it has a simple operating mechanism, adaptation to all time periods and trading tactics. Created based on a regression channel with filters. We display the signals of the Trend Channel indicator on the price function chart using a mathematical approach. How it works: when the price breaks through the overbought/oversold zone (channel levels), a buy or sell signal is generated
这是一个非常好用的供需指标,具有以下特色: 1、可以精准的识别出供给区和需求区,且不重绘。 2、价格到达供给区或需求区会弹窗报警,且会改变颜色用来和未测试的供需区做区分。 3、价格突破供给区、需求区会弹窗报警并清除该失效的供需区。 4、供给区和需求区的进入边界价格直接标注在图表上,一目了然。 该指标配合均线使用效果更佳,用均线判断方向,用供需区的点位为设定入场位置,用供需区的边界来设定止损位置,便于以损定量,管理资金控制仓位,制定交易计划限价交易。当然也可以根据行情方向,在到达供给区或需求区报警触发后市价进厂做单,但前提是要提前做好计划,判断好方向,不可以盲目开单。关于止盈,使用供需指标来交易的话,盈亏比是比较划算的,保守的可以根据2:1或者3:1的盈亏比设置止盈,也可以把较远的供给区或需求区当作止盈目标。
Introduction Harmonic Patterns are best used to predict potential turning point. Traditionally, Harmonic Pattern was identified manually connecting peaks and troughs points in the chart. Manual harmonic pattern detection is painfully tedious and not suitable for everyone. You are often exposed under subjective pattern identification with manual pattern detection. To avoid these limitations, Harmonic Pattern Plus was designed to automate your harmonic pattern detection process. The functionality
Golden Delta Library — Free MT5 Tools Market Description Short Description Golden Delta Library is a free MT5 toolkit for traders who want cleaner chart structure, Renko-based context, risk planning, and practical execution panels. Renko EDGE EA Golden Delta | Algo Trading Research Updates, research and new developments: https://www.mql5.com/en/channels/golden-delta What It Does The collection includes Renko indicators, SuperTrend / ADX Renko variants, XAUUSD helper panels, and RiskLab Trad
RSI Divergence Risk Target Signals RSI Divergence Risk Target Signals is a MetaTrader 5 indicator that detects confirmed bullish and bearish RSI divergence and combines the signals with optional trend filters, ATR-based Stop Loss levels, three Take Profit targets, alerts and an internal trade statistics dashboard. The indicator compares confirmed RSI pivot structure with corresponding price highs and lows. It is designed to help traders identify momentum divergence while providing a structure
EasyPivot — Smart Pivot Points with Pattern Prediction EasyPivot   is a professional MetaTrader 5 indicator that automatically detects significant High and Low pivot points, analyzes historical sequences of these signals, and provides a statistically based forecast of the next move. Perfect for swing traders, support/resistance traders, and pattern recognition enthusiasts. How It Works The indicator scans the chart and marks key reversal points: High pivot   — a bar whose high price is higher th
FREE
Money Flow Profile MT4  HERE   Use Guide Here our more valuable tools SMC Trend Trading   ,  Easy SMC Trading  ,  Institutional SMC Architect Volume Analysis Tools  ,  Volume flow Profile  ,  Market volume profile  , FVG with Volume  , Liquidity Heatmap Profile  ,  Volume Spread Analysis  Master Edition is a professional-grade analytical tool designed to visualize market structure through the lens of volume and money flow. Unlike standard volume indicators, this tool displays a Daily Vo
Buyers of this product also purchase
This product was updated for the 2026 market and optimized for the latest MT5 builds . PRICE UPDATE NOTICE:   Smart Trend Trading System is currently available for $99. The price will increase to $199 after the next 30 purchases. SPECIAL OFFER:  After purchasing Smart Trend Trading System, send me a private message to claim the Smart Universal EA for FREE and turn your Smart Trend signals into automated trades. Learn Smart Trend Trading System Everything you need to learn, install, and use the
Trend Sniper X
Sarvarbek Abduvoxobov
4.88 (32)
Trend Sniper X is a multi-timeframe trend-following indicator for MetaTrader 5 that helps traders identify trend direction and potential reversal points with clarity and precision. for MT4: https://www.mql5.com/en/market/product/193245 Price Information: The current price is promotional and is subject to change as upcoming updates and new features are released. Bonus Offer: To get the FREE Auto-Trade Assistant EA for this indicator, please message the author after purchasing. Code2Profit Channe
Neuro Poseidon MT5
Daria Rezueva
4.79 (53)
Neuro Poseidon is a new indicator by Daria Rezueva. It combines precise trading signals with adaptive TP/SL levels - creating best possible trades as a result! Message me and get  Neuro Poseidon Assistant  as a gift to automize your trading process! What makes it stand out? 1. Proven profitability on all assets and timeframes 2. Only confirmed BUY and SELL signals present on the chart 3. Adaptive TP & SL levels generated by the software for each trade 4. Easy to understand - suitable for al
SuperScalp Pro
Van Minh Nguyen
4.63 (32)
SuperScalp Pro - Professional Multi-Layer Confluence Scalping System SuperScalp Pro is an advanced scalping indicator that upgrades classic Supertrend with multiple intelligent confirmation filters. It helps you identify higher-probability Buy/Sell opportunities while significantly reducing false signals. Clear Buy and Sell arrows appear directly on the chart, with automatic ATR-based Stop Loss and Take Profit levels calculated in real time. After purchase, contact me for setup guidance and reco
Welcome to ENTRY IN THE ZONE AND SMC MULTI TIMEFRAME Entry In The Zone and SMC Multi Timeframe is a real-time market analysis tool based on Smart Money Concepts (SMC), designed to analyze market structure, price direction, and key trading zones. It supports both Single-Timeframe Analysis and Multi-Timeframe Analysis, providing a clearer view of the overall market structure across multiple timeframes, with real-time BUY / SELL signals that do not repaint. It is designed to help filter trading opp
UNIX Scalper — Gold Scalping Indicator for MetaTrader 5 UNIX Scalper is a focused Gold scalping indicator designed primarily for XAUUSD on M1, M2, M3, M5, M10 and M15. It gives the trader a clear BUY, SELL or WAIT decision together with the complete trade plan: Entry, Stop Loss, TP1 and TP2 . The concept is simple: wait for the signal, follow the levels, move the Stop Loss to Break Even after TP1, and trade with discipline. Learn UNIX Scalper Everything you need to learn and use the product is
The UZFX {SSS} Scalping Smart Signals v5.0 MT5  is a Non Repaint high-performance trading indicator designed for Scalpers, Day Traders, and Swing Traders who demand accurate, real-time signals in fast-moving markets. Developed by (UZFX-LABS), this indicator combines price action analysis, trend confirmation, and smart filtering to generate high-probability buy and sell signals, Warning Signals, and Trend Continuation Opportunities across all currency pairs and timeframes.  Stop second-guessing
Atomic Analyst MT5
Issam Kassas
4.45 (55)
This product was updated for the 2026 market and optimized for the latest MT5 builds. PRICE UPDATE NOTICE: Atomic Analyst is currently available for $99. The price will increase to $199 after the next 30 purchases . SPECIAL OFFER:  After purchasing Atomic Analyst, send me a private message to claim the Smart Universal EA for FREE and turn your Atomic Analyst signals into automated trades. Click here to watch the complete Atomic Analyst Online Course:  https://www.mql5.com/en/blogs/post/775702
M1 Sniper MT5
Oleg Rodin
5 (7)
M1 SNIPER  is an easy to use trading indicator system. It is an arrow indicator which is designed for M1 time frame. The indicator can be used as a standalone system for scalping on M1 time frame and it can be used as a part of your existing trading system. Though this trading system was designed specifically for trading on M1, it still can be used with other time frames too. Originally I designed this method for trading XAUUSD and BTCUSD. But I find this method helpful in trading other markets
Gann Made Easy   is a professional and easy to use Forex trading system which is based on the best principles of trading using the theory of W.D. Gann. The indicator provides accurate BUY and SELL signals including Stop Loss and Take Profit levels. You can trade even on the go using PUSH notifications. PLEASE CONTACT ME AFTER PURCHASE TO GET TRADING  INSTRUCTIONS   AND GREAT EXTRA INDICATORS  FOR FREE! Probably you already heard about the Gann trading methods before. Usually the Gann theory is a
Currency Strength Wizard   is a very powerful indicator that provides you with all-in-one solution for successful trading. The indicator calculates the power of this or that forex pair using the data of all currencies on multiple time frames. This data is represented in a form of easy to use currency index and currency power lines which you can use to see the power of this or that currency. All you need is attach the indicator to the chart you want to trade and the indicator will show you real s
Entry Points Pro 10 — the legend of the MQL5 Market. Three years in the Market's Top-3. 595 reviews across two versions. Over 31,000 demo downloads. Thousands of traders open their charts with it every morning. Built and traded by an author who has been in the market since 1999. Version 10 is the biggest rebuild in the indicator's history: I read every review from five years — and built the answers into the code. WHAT IT DOES It shows the entry point in advance — strictly without repainting. Th
Gem SIGNAL
Shengzu Zhong
5 (1)
GEM Signal Pro GEM Signal Pro is a trend-following indicator for MetaTrader 5, designed for traders who want clearer signals, more structured trade setups, and practical risk management directly on the chart. Instead of showing only a simple arrow, GEM Signal Pro helps present the full trade idea in a cleaner and more readable way. When conditions are confirmed, the indicator can display the entry price, stop loss, and take profit targets on the chart, helping traders review the setup more effic
FiboSniper Pro
Van Minh Nguyen
5 (2)
FiboSniper Pro - Multi-Filter Fibonacci System with Auto SL/TP and Control Panel FiboSniper Pro is a technical indicator that combines dynamic Fibonacci Envelopes with multiple confirmation filters to generate selective Buy and Sell signals. Fibonacci levels are calculated from Moving Average and ATR, then filtered by ADX, EMA, RSI, ATR, Volume, Time and Candle structure. The indicator displays automatic ATR-based Stop Loss and Take Profit levels directly on the chart, along with an interactive
Power Candles MT5
Daniel Stein
4.73 (11)
Power Candles V3 - Self-Optimizing Strength Indicator Power Candles V3 turns currency and instrument strength into an actionable trade plan on every chart it is attached to. Instead of just coloring candles, it runs a live auto-optimization in the background and hands you the best Stop Loss, Take Profit and signal threshold for the symbol in front of you. One click adopts it for live trading - entry, Stop Loss and Take Profit rays appear on the chart at the exact prices, and alerts fire with dir
Divergence Bomber
Ihor Otkydach
4.89 (94)
Each buyer of this indicator also receives the following for free: The custom utility "Bomber Utility", which automatically manages every trade, sets Stop Loss and Take Profit levels, and closes trades according to the rules of this strategy Set files for configuring the indicator for various assets Set files for configuring Bomber Utility in the following modes: "Minimum Risk", "Balanced Risk", and "Wait-and-See Strategy" A step-by-step video manual to help you quickly install, configure, and
Crystal Quantum Pro
Muhammad Jawad Shabir
5 (3)
CRYSTAL QUANTUM PRO Institutional Signal & Trade Intelligence for MetaTrader 5 Final Price: 199 USD ----> Price goes up 10 USD after every 10 sales. Limited launch slots available, act fast. Most indicators give you an arrow and leave you alone. A naked arrow is a gamble. Winning consistently requires CONFLUENCE , a clear STOP and TARGET , and honest PROOF that the system works. Crystal Quantum Pro delivers all three in one clean, no-repaint package. Crystal Quantum Pro is a complete decision sy
Scalper Vault   is a professional scalping system which provides you with everything you need for successful scalping. This indicator is a complete trading system which can be used by forex and binary options traders. The recommended time frame is M5. The system provides you with accurate arrow signals in the direction of the trend. It also provides you with top and bottom signals and Gann market levels. The indicator provides all types of alerts including PUSH notifications. PLEASE CONTACT ME A
FX Power MT5 NG
Daniel Stein
5 (33)
FX Power: Analyze Currency Strength for Smarter Trading Decisions Overview FX Power is your go-to tool for understanding the real strength of currencies and Gold in any market condition. By identifying strong currencies to buy and weak ones to sell, FX Power simplifies trading decisions and uncovers high-probability opportunities. Whether you’re looking to follow trends or anticipate reversals using extreme delta values, this tool adapts seamlessly to your trading style. Don’t just trade—trade
FX Trend MT5 NG
Daniel Stein
5 (6)
FX Trend NG: The Next Generation Multi-Market Trend Intelligence Overview FX Trend NG is a professional multi-timeframe trend and market monitoring tool designed to give you a complete structural overview of the market in seconds. Instead of switching between dozens of charts, you instantly see which symbols are trending, where momentum is fading, and where strong alignment exists across timeframes. This tool is part of the Stein Investments ecosystem - 18+ tools plus Max, your 1-on-1 AI tradi
Crystal Heikin Ashi Signals
Muhammad Jawad Shabir
5 (4)
Crystal Heikin Ashi Signals - Professional Trend & Signal Detection Indicator Advanced Heikin Ashi Visualization with Intelligent Signal System for Manual & Automated Trading Final Price: $149 ---------> Price goes up $10 after every 10 sales . Limited slots available — act fast . Overview Crystal Heikin Ashi Signals is a professional-grade MetaTrader 5 indicator that combines pure Heikin Ashi candle visualization with an advanced momentum-shift detection system. Designed for both manual traders
SR Liquidity   is a trading indicator designed to reveal the hidden zones where market liquidity concentrates and price reacts most strongly. These special liquidity areas act as powerful support and resistance levels, giving you a clear map of where the market is most likely to reverse. Instead of drawing ordinary Support/Resistance lines, SR Liquidity analyzes real price behavior to detect the zones where buying and selling pressure accumulate. These are actually the pools of liquidity that dr
FX Volume MT5
Daniel Stein
4.79 (24)
FX Volume: Experience Genuine Market Sentiment from a Broker’s Perspective Quick Overview Looking to elevate your trading approach? FX Volume provides real-time insights into how retail traders and brokers are positioned—long before delayed reports like the COT. Whether you’re aiming for consistent gains or simply want a deeper edge in the markets, FX Volume helps you spot major imbalances, confirm breakouts, and refine your risk management. Get started now and see how genuine volume data can
Advanced Supply Demand MT5
Bernhard Schweigert
4.53 (15)
Best Solution for any Newbie or Expert Trader! This indicator is a unique, high quality and affordable trading tool because we have incorporated a number of proprietary features and a new formula. With this update, you will be able to show double timeframe zones. You will not only be able to show a higher TF but to show both, the chart TF, PLUS the higher TF: SHOWING NESTED ZONES. All Supply Demand traders will love it. :) Important Information Revealed Maximize the potential of Advanced Supply
Superhero
Ihor Otkydach
5 (3)
The SUPERHERO indicator is a multi-currency trading system designed on an "all-inclusive" basis. The indicator independently analyzes the market and provides signals on when to open and close trades. It uses Stop Loss and Take Profit orders. The R:R ratio is 1:1. This system can send push notifications to your smartphone, so you can place trades "on the go" without needing to be tied to a PC. It's perfect for proprietary trading firms. A BONUS FOR EVERY CUSTOMER: Every buyer of this indicator wi
M1 Quantum MT5
Hamed Dehgani
4.27 (11)
Live Trading Signals Using M1 Quantum : Signal  (Trade executed automatically by the Quantum Trade Assistant , included free with this product.) Latest News : Version 1.64 has been released, All trades now have a Stop Loss placed behind the relevant Support/Resistance zones. The Smart Close function has also been improved to increase the EA’s performance in this version. Since August 9, the live signal has been running on Version 1.64. Price Plan: Current Price: $169 (Early Adopter Offer) Next
ICT PO3 (Power of 3) AMD Protocol Framework Indicator True Time & Structure Integration   |  Non-Repainting | Real-Time  | Multi-Asset  | MT4 Version Available Full Setup Guide & Strategy Playbook: https://www.mql5.com/en/blogs/post/768683 MT4 Version: https://www.mql5.com/en/market/product/171742 Indicator Overview The ICT PO3 AMD Protocol Framework is a complete structural overlay for MetaTrader 5 that maps the True Daily Cycle directly onto your lower-timeframe execution chart. It project
Trend Forecaster
Alexey Minkov
5 (8)
Trend Forecaster is a MetaTrader 5 indicator that combines breakout signals, possible reversal area analysis, market range data and a visual statistics panel in one chart workspace. It shows Buy and Sell signals, tracks Average Range and Current Range, and can automatically adjust Sensitivity for the current symbol and timeframe. Manual Sensitivity control is also available. The indicator can be used on Forex pairs, metals, stocks, indices and cryptocurrencies. Different timeframes are supported
* Due to the  authenticity of data for all major currencies , — use of  live charts  is  recommended . Get UEX Reader - Expert Advisor for free: https://www.mql5.com/en/market/product/166805 What is UEX Pure USD Euro Index : Discover the real pulse of the forex market with Pure USD & Euro Index — an innovative indicator that truly reveals the hidden strength and weakness between the world’s two most powerful currencies . Instead of relying on a single pair like EURUSD, this tool measures the
Best Solution for any Newbie or Expert Trader! This Indicator is a unique, high quality and affordable trading tool because we have incorporated a number of proprietary features and a new formula. With only ONE chart you can read Currency Strength for 28 Forex pairs! Imagine how your trading will improve because you are able to pinpoint the exact trigger point of a new trend or scalping opportunity? User manual:   click here That's the first one, the original! Don't buy a worthless wannabe clone
More from author
The indicator draws support and resistance lines on an important part of the chart for making decisions. After the trend line appears, you can trade for a breakout or rebound from it, as well as place orders near it. Outdated trend lines are deleted automatically. Thus, we always deal with the most up-to-date lines. The indicator is not redrawn . Settings: Size_History  - the size of the calculated history. Num_Candles_extremum  - the number of candles on each side of the extremum. Type_Arrow
Turn
Pavel Verveyko
The indicator shows the market turning points (entry points). Reversals allow you to track rebound/breakout/testing from the reverse side of the lines of graphical analysis or indicators. Reversals can be an independent signal. The indicator allows you to determine reversals taking into account the trend and without it. You can choose a different period for the movement preceding the reversal, as well as the volatility coefficient. When plotting reversals, the indicator takes into account volati
Length Movement
Pavel Verveyko
5 (1)
Measures the length of the selected movement in points, shows the duration of the movement, as well as the speed of movement.   Outputs the average value of each dimension. It is designed to calculate the expected target based on typical market movements. The intended goal will provide information about the ratio of the stop size to the possible profit and will allow you not to open positions with a small expected profit. It will also help you determine the point at which it is more logical to c
The indicator allows you to quickly switch from one instrument to another, from one time period to another using the keyboard or buttons on the monitor. Each command can be assigned a hot key from 0-9, a-Z (case-insensitive) and VK_OEM_COMMA ("<" on the keyboard) and VK_OEM_PERIOD (">" on the keyboard). This can help you to operate the maximum number of instruments that are available at your broker, analyze more instruments/periods in less time. This product cannot be tested in the tester , beca
Ratio TP SL
Pavel Verveyko
5 (1)
This indicator allows you to measure the profitability of each specific transaction (the ratio of Stop and Profit). The indicator allows you to adjust the ratio by step size and number of steps. You can build an unlimited number of ratios to compare the risks from different movements. Note: in MT4, the number of horizontal lines in a single ratio cannot exceed 32. Building a line : click the " Ratio " button and draw a line (mouse click - the first point of the line, where the mouse is release
Corporate Report
Pavel Verveyko
5 (1)
The script displays info about the share's corporate reports and dividends. The data is downloaded from   investing.com : Report date Profit per share (EPS) Revenue Market capitalization Amount of dividends Date of payment of dividends Dividend income The product cannot be tested in the tester (since it is not possible to receive data from the Internet). Before launching:  Add 2   URL   https://ru.investing.com/earnings-calendar/Service/getCalendarFilteredData  and   https://ru.investing.com/di
Channel FTF
Pavel Verveyko
The Envelopes indicator determines the presence of a trend or flat. It has 3 types of signals, shows the probable retracement levels and levels of the possible targets. The Fibonacci coefficients are used in the indicator's calculations. Signals (generated when touching the lines or rebounding from lines): Trend - the middle line of the Envelopes has a distinct inclination; the lines below the channel's middle line are used for buy trades, the lines above the middle line and the middle line itse
Mr Big
Pavel Verveyko
The indicator shows and highlights the chart candles, which are formed as a result of large players entering the market in large volumes. Such candles can also be formed after achieving a certainty on the market, when most of the participants hold positions in the same direction. The movement is likely to continue in that direction after such candles. The indicator highlights the significant candles from the existing ones on the chart; The indicator allows identifying the trends based on candles
Splash
Pavel Verveyko
The indicator identifies the most suitable moment for entering the market in terms of market volatility, when the market has the strength to move (the signal is indicated by an arrow under the candle). For each of the signals, the presence of trends on the current and higher timeframes is determined, so that the signal is in the direction of the majority of positions opened on the market (denoted near the signal by abbreviations of timeframes with a trend present). The signal appears after the c
The indicator displays the key support and resistance levels on the chart. The significance of these levels lies in that the price may reverse or strengthen the movement when passing such levels, since they are formed as a consequence of the natural reaction of market participants to the price movement, depending on which positions they occupied or did not have time to occupy. The psychology of the level occurrence: there always those who bought, sold, hesitated to enter or exited early. If the
This indicator is a multitimeframe trading strategy. It has the levels for stop loss, take profit and entry point. The order level can also be set manually. The indicator uses the regularity of the market, which manifests itself on all instruments, and does not require adjustment of the parameters. The strategy uses a proprietary approach to determining: trend, volatility, hierarchy of timeframe significance, the size of the history period (the number of candles), which is important for making a
Trend Sync
Pavel Verveyko
5 (1)
The indicator shows the trend of 3 timeframes: higher timeframe; medium timeframe; smaller (current) timeframe, where the indicator is running. The indicator should be launched on a chart with a timeframe smaller than the higher and medium ones. The idea is to use the trend strength when opening positions. Combination of 3 timeframes (smaller, medium, higher) allows the trend to be followed at all levels of the instrument. The higher timeframes are used for calculations. Therefore, sudden change
The indicator detects important peaks and troughs (extremes) on the chart. These points can be used to plot support/resistance levels and trend lines, as well as any other graphical analysis. These points can serve as reference points for setting trading orders. The indicator does not redraw . Settings: Size_History  - the size of the calculated history. Num_Candles_Right  - number of candles to the right of the peak or trough. Num_Candles_Left  - number of candles to the left of the peak or
Running along Lines
Pavel Verveyko
3 (2)
The indicator draws support and resistance lines on an important part of the chart for making decisions. After the trend line appears, you can trade for a breakout or rebound from it, as well as place orders near it. Outdated trend lines are deleted automatically. Thus, we always deal with the most up-to-date lines. The indicator is not redrawn . Settings: Size_History  - the size of the calculated history. Num_Candles_extremum  - the number of candles on each side of the extremum. Type_Arrow
Key Volumes
Pavel Verveyko
1 (1)
The indicator shows key volumes confirmed by the price movement. The indicator allows you to analyze volumes in the direction, frequency of occurrence, and their value. There are 2 modes of operation: taking into account the trend and not taking into account the trend (if the parameter Period_Trend = 0, then the trend is not taken into account; if the parameter Period_Trend is greater than zero, then the trend is taken into account in volumes). The indicator does not redraw . Settings History_S
This trading system is based on market impulses of varying complexity.   To generate a signal, the indicator uses the moments when the direction of the pulse and the necessary section of the trend coincide. The indicator also takes into account the current market volatility. Stop_loss tags can be set with the parameter "0" or "1", then Stop_Loss will take into account market volatility.   Take_Profit tags can be set with the parameter "0", then Take_Profit will take into account market volatil
Indexes
Pavel Verveyko
The stocks that make up the index are one of the drivers of the movement. Analyzing the financial performance of all elements of the index, we can assume further development of the situation. The program (script) displays corporate reports of shares that are part of the index selected in the settings.   "Indexes" cannot be tested in the tester (since there is no way to get information from the Internet). Information is downloaded from the site investing.com: Report Date Earnings per share (E
Fibo World
Pavel Verveyko
The indicator builds a graphical analysis based on the Fibonacci theory. Fibo Fan is used for the analysis of the impulses and corrections of the movement. Reversal lines (2 lines at the base of the Fibonacci fan) are used to analyze the direction of movements. The indicator displays the of 4 the target line in each direction. The indicator takes into account market volatility. If the price is above the reversal lines, it makes sense to consider buying, if lower, then selling. You can open posi
The indicator determines the state of the market: trend or flat. The state of the market is determined by taking into account volatility. The flat (trading corridor)is displayed in yellow. The green color shows the upward trend. The red color shows the downward trend. The height of the label corresponds to the volatility in the market. The indicator does not redraw . Settings History_Size   - the amount of history for calculation. Period_Candles  - the number of candles to calculate the indicat
The indicator plots flexible support and resistance levels (dots). A special phase of movement is used for construction. Levels are formed dynamically, that is, each new candle can continue the level or complete it. The level can provide resistance or support to the price even where it is no longer there. Also, support and resistance levels can change roles. The importance of levels is affected by: the amount of time the level is formed and the number of touches. The significance of these lev
The indicator is a trading system for short-term trading. Scalper Assistant helps to determine the direction of the transaction, and also shows the entry and exit points. The indicator draws two lines (possible points for opening positions). At the moment of the breakdown of the upper line up (and when all trading conditions are met), an up arrow appears (a buy signal), as well as 2 goals. At the moment of the breakdown of the lower line down (and when all trading conditions are met), a down ar
Gold n XAU
Pavel Verveyko
The trading system is designed to work with gold on time periods: 30M, 1H. The indicator allows you to adjust to the market situation. Parameters for 1H :   PERIOD=9F ,   FILTER=300 .   Parameters for  30M :   PERIOD=22B ,   FILTER=450 .   A small adjustment to a specific broker is allowed .   If you change the amount of history displayed, you may also need to adjust the parameters. The indicator is not redrawn.     "Gold n XAU" uses different rules for entering a trade and different rules fo
The indicator builds "psychological levels": levels of round numbers and intermediate levels of round numbers. Round numbers play an important role in forming support and resistance levels. There is a pattern in which the decline or growth of the price can stop at round numbers. The level whose price ends at 0 is the level of a round number of the first order. Intermediate level, this is the level between two round levels, for example, between 10 and 20 this is level 15. In the " Num_Zeros "
Ichimoku Map
Pavel Verveyko
Ichimoku Map (instant look at the markets) - built on the basis of the legendary Ichimoku Kinko Hyo indicator. The task of the Ichimoku Map is to provide information about the market strength on the selected time periods and instruments, from the point of view of the Ichimoku indicator. The indicator displays 7 degrees of buy signal strength and 7 degrees of sell signal strength. The stronger the trend, the brighter the signal rectangle in the table. The table can be dragged with the mouse. The
The indicator displays a stock chart of a non-standard type, in which the price and time have the same value. The usual chart of Japanese candlesticks does not take into account all the information that the time analysis can give. Renko charts do not use all the information that price can give in relation to time. The "Chart Price and Time" indicator takes into account price and time equally and shows the predominance of price or time. Taking into account price and time equally gives an idea
The indicator tracks sharp volatility (moments when the market has shown increased activity and movement may occur), on the selected instruments and time periods. The information is displayed as colored rectangles. Thus, it is possible to assess at a glance which tool should be given priority attention. The indicator will be useful for scalpers when they need a quick reaction or for traders working with a large number of instruments. The indicator does not redraw. The indicator displays 8 degree
The Alert Creator indicator is designed to create alerts for selected conditions. You can select one or several indicators for the notification. If several conditions are selected, the alert is triggered when all the selected conditions are met. The signals can be configured separately for buying and separately for selling. Example, a buy alert: the closing price is above the moving average, the RSI is below 20. (In this example, 2 indicators are used to generate an alert: MA and RSI) At the
The indicator determines the strength of the trend and its possible reversal points, based on the author's arithmetic approach . Each new peak or trough is a trend development. Such peaks and troughs are numbered so that the strength of the trend development can be seen. Attempts to change the trend are also numbered. This gives an understanding of a possible change in the direction of the trend. Indicator signals are generated when trying to change the trend . In the settings, it is possible
The indicator draws potential levels that may become significant support and resistance levels in the future. The longer the line, the higher the probability of a price reversal or an increase in price movement after the breakdown of this level. With a decrease in the probability of the formation of a level, the length of the line is reduced. The indicator does not require adjustment. In the settings, you can change the design of the indicator. The "L ine_Length " button is placed on the ch
Jumping along Levels is dedicated to the most important aspect of trading: support and resistance levels. This indicator is built using a unique technology based on proprietary development and testing algorithms. The indicator has a built-in intelligent market situation assessment system. It can automatically adjust to varying market volatility. Jumping along Levels simultaneously displays levels from different time periods on the current chart. It has a graphical table for working with comple
Filter:
krisnara123
2210
krisnara123 2021.05.04 05:22 
 

This indicator helps finding peaks and valleys .It uses green and red dots .By using the "number of candles" parameter,one can qualify the type of swing .The dots dont repaint which was important criteria for me.The peaks and troughs dots also make drawing trend lines and pitchforks easier.It is visually pleasing to the eyes.

Reply to review