Control Trading Support And Resistance
- Indicators
- Version: 1.1
- Activations: 10

Control Trading Support And Resistance
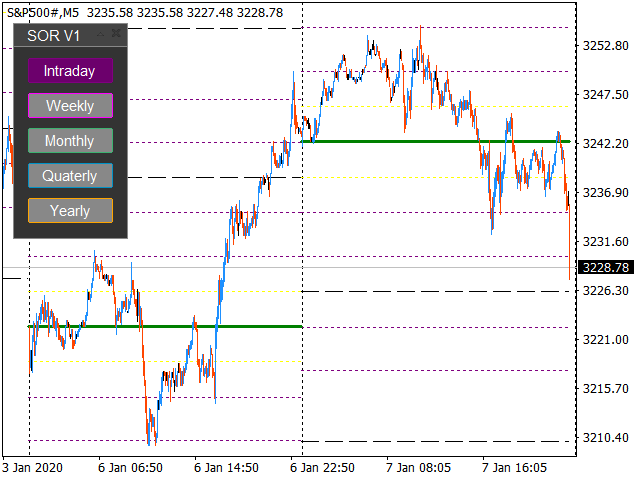
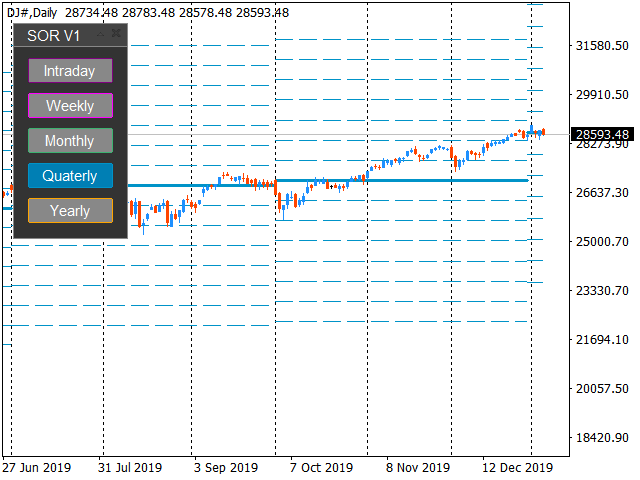
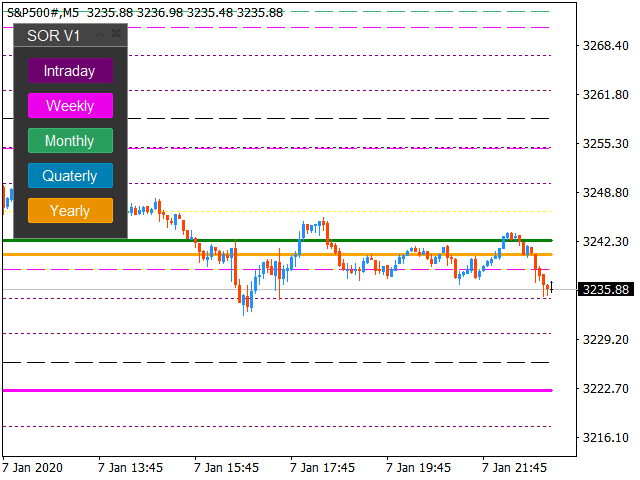
Es un indicador independiente del TimeFrame que permite proyectar niveles más relevantes del mercado en función del plazo de tiempo de la operativa. Los colores del indicador están escogidos para diferenciar entre los diferentes tipos de niveles y destacar a los más relevantes. Este indicador permite visualizar en un mismo gráfico los posibles objetivos relevantes que los diferentes traders pueden emplear siguiendo diferentes tipos de operativas en función del tiempo: largo plazo, medio plazo y corto plazo.
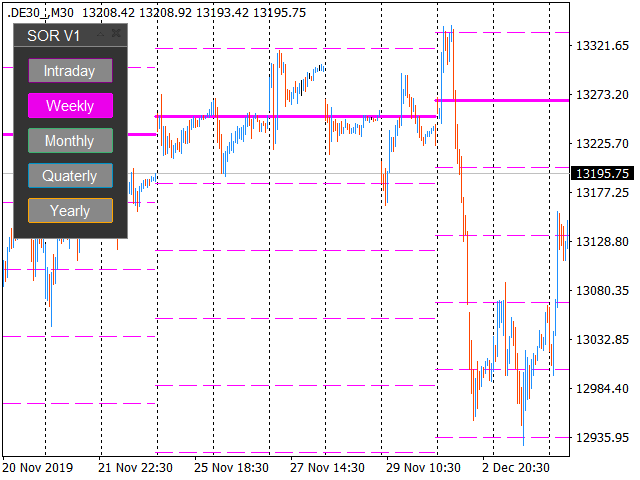
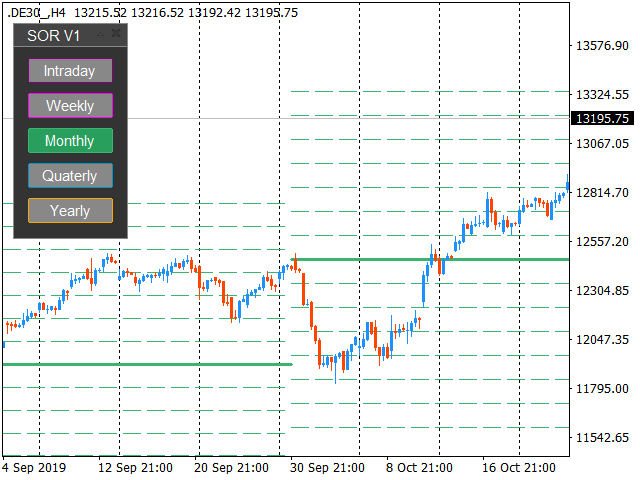
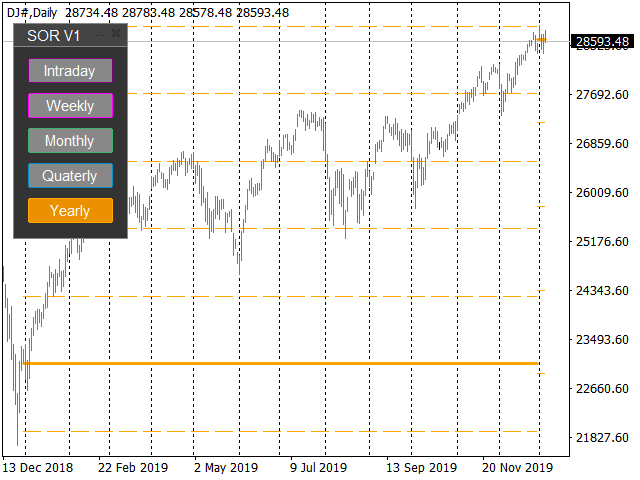
El indicador emplea los siguientes tramos de trading: intradía, semanal, mensual, trimestral y anual. El indicador mediante el uso de sus botones permite escoger los niveles que se visualizarán en el gráfico abierto.
El indicador NO refresca, los niveles se calculan en el momento que cada periodo comienza.
Sugerencias de utilización:
- Para operativa intradía se recomienda tener en cuenta todos los niveles dando mayor relevancia a niveles mayores.
- Para operativa swing de pocos días de duración se recomienda utilizar semanal y superiores.
- Para operativa swing de semanas de duración se recomienda utilizar mensual y superiores.
- Para operativa de acciones se recomienda utilizar los niveles trimestrales y superiores, especialmente por coincidir con las cuentas trimestrales de las empresas.
- Para operativa de largo plazo se recomienda utilizar mensual y anual.
Los parámetros del indicador son los siguientes:
- # back bars on daily level - Establece para cuantos periodos "diarios" se deben dibujar los niveles.
- # back bars on weekly level - Establece para cuantos periodos "semanales" se deben dibujar los niveles.
- # back bars on monthly level - Establece para cuantos periodos "mensuales" se deben dibujar los niveles.
- # back bars on quaterly level - Establece para cuantos periodos "trimestrales" se deben dibujar los niveles.
- # back bars on yearly level - Establece para cuantos periodos "anuales" se deben dibujar los niveles.
Very useful and extremely effective product, among all the products present in the Mql world, among the best for price action and reversal operations ,,, number one