Control Trading Support And Resistance
- Indikatoren
- Version: 1.1
- Aktivierungen: 10

Control Trading Unterstützung und Widerstand
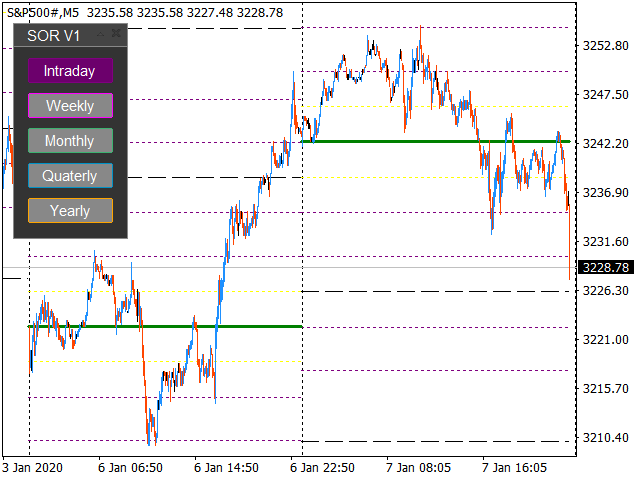
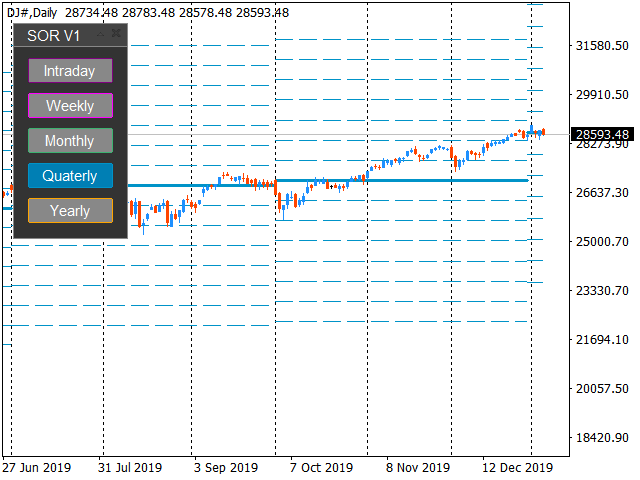
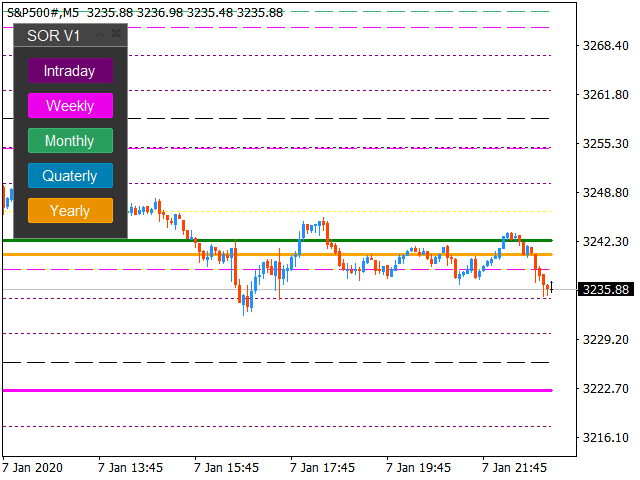
Es handelt sich um einen unabhängigen Indikator des TimeFrame, der es ermöglicht, die wichtigsten Marktniveaus je nach dem Zeitrahmen des Handels zu projizieren. Die Farben des Indikators sind so gewählt, dass sie zwischen den verschiedenen Arten von Niveaus unterscheiden und die wichtigsten hervorheben. Dieser Indikator ermöglicht es, auf demselben Diagramm die möglichen relevanten Ziele zu visualisieren, die verschiedene Trader nach verschiedenen Arten von Trades je nach Zeitrahmen verwenden können: langfristig, mittelfristig und kurzfristig.
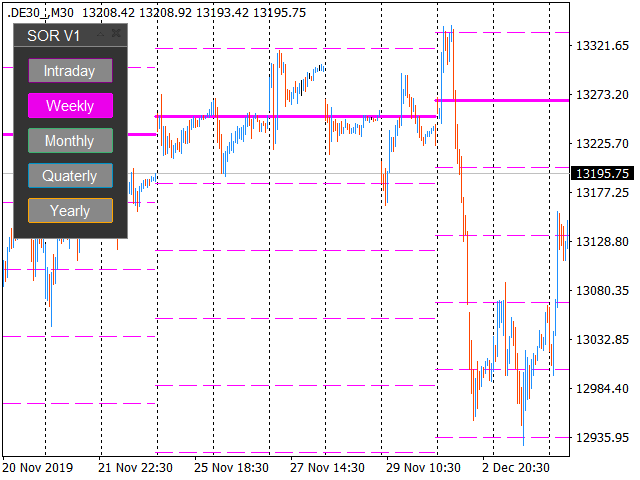
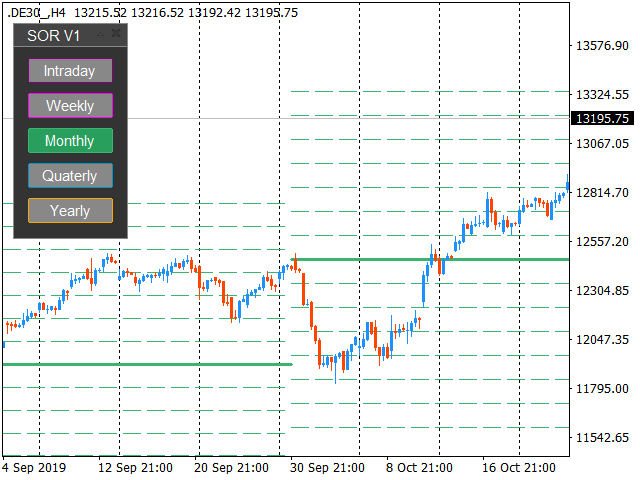
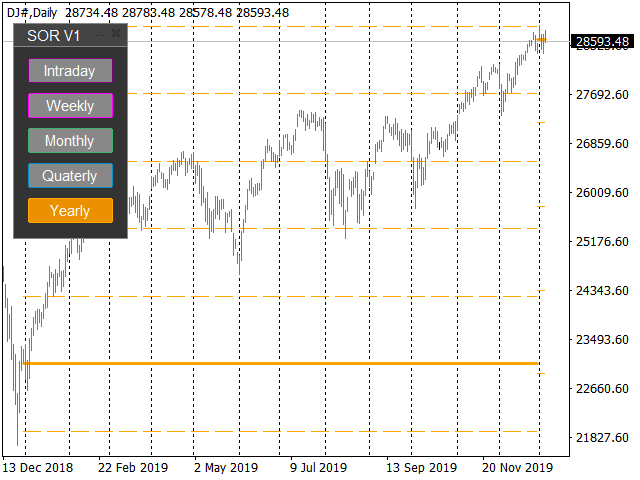
Der Indikator verwendet die folgenden Handelszeitrahmen: Intraday, wöchentlich, monatlich, vierteljährlich und jährlich. Mit den Schaltflächen des Indikators können Sie die Niveaus auswählen, die auf dem offenen Chart angezeigt werden sollen.
Der Indikator aktualisiert sich NICHT, die Niveaus werden zum Zeitpunkt des Beginns jeder Periode berechnet.
Vorschläge für die Verwendung:
- Für den Intraday-Handel wird empfohlen, alle Niveaus zu berücksichtigen, wobei den höheren Niveaus mehr Bedeutung beigemessen wird.
- Für den Swing-Trading-Handel von einigen Tagen Dauer empfiehlt es sich, wöchentliche und höhere Niveaus zu verwenden.
- Für wochenlanges Swing-Trading empfiehlt es sich, monatliche und höhere Niveaus zu verwenden.
- Für den Aktienhandel werden vierteljährliche und höhere Niveaus empfohlen, insbesondere weil sie mit den Quartalsabschlüssen der Unternehmen übereinstimmen.
- Für den langfristigen Handel wird die Verwendung von Monats- und Jahreswerten empfohlen.
Die Parameter des Indikators sind wie folgt:
- # back bars on daily level - Legt fest, für wie viele "tägliche" Perioden die Levels gezogen werden sollen.
- # back bars on weekly level - Legt fest, für wie viele "wöchentliche" Perioden die Levels gezeichnet werden sollen.
- # back bars on monthly level - Legt fest, für wie viele "monatliche" Perioden die Niveaus gezeichnet werden sollen.
- # back bars on quaterly level - Legt fest, für wie viele "vierteljährliche" Perioden die Niveaus gezeichnet werden sollen.
- # back bars on yearly level - Legt fest, für wie viele "jährliche" Zeiträume die Niveaus gezeichnet werden sollen.
Very useful and extremely effective product, among all the products present in the Mql world, among the best for price action and reversal operations ,,, number one