Obsidian Gold Terminal
- Utilities
-
Evgenii Sutulov
 I build trading indicators, strategies, and dashboards that don't repaint.
Seven years doing this. MetaTrader 4, MetaTrader 5, TradingView.
Closed bars only. What you see is what happened.
The bar being formed never changes a published value. - Version: 1.0
- Activations: 20
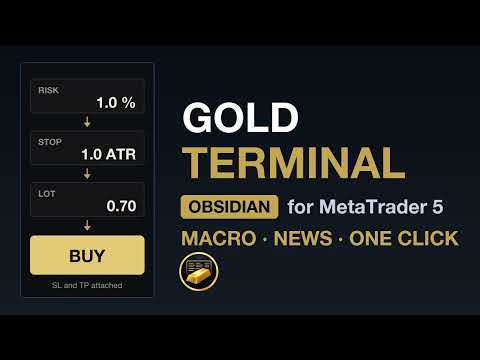
Every number you check before a manual gold trade, gathered on one chart. Obsidian Gold Terminal sizes the position from your risk, sends the order with an ATR stop and an R based target in a single click, and keeps beside it the context you would otherwise collect from four windows: the spread against its own session average, the day range in ATR, market structure with order blocks and fair value gaps, the economic calendar, and a macro window carrying COT positioning, real yields and the VIX.
This is a manual trading workspace, not a robot. It never opens a position by itself. An order is sent when you press SELL or BUY, with the stop and the target the panel is already showing you. Everything else on screen exists to make that decision faster and better informed.
The gold preset is built into the product. Seven indicators ship inside the file itself, so there is nothing else to download, copy or point a path at.
What sets it apart
| Feature | Why it matters |
|---|---|
| Macro window that keeps itself current: COT, real yield, VIX | what moves gold this week, without leaving MetaTrader |
| Calendar with a gold critical line | the one release that matters is named, not buried in a list |
| Spread against its own session average | normal is measured on your broker, not assumed |
| Scanner on closed bars | the arrow does not change its mind in the middle of a candle |
| Lot from risk, three modes | position size is answered before you click |
| Preset inside the file | nothing to download, copy or point a path at |
The trade block
Risk is expressed the way you actually think about it: a percent of balance, a percent of equity, or a fixed sum in account currency. The stop is set in ATR multiples, the target in R, and the lot follows both. Stop price, target price and the risk to reward ratio are shown before you click. The steps of every control are configurable, because a sensible increment on one account size is noise on another. An order that cannot be sent is refused with the reason written in the log, never silently.
| Risk is given as | The lot is sized from |
|---|---|
| Percent of balance | account balance |
| Percent of equity | equity while a position is open |
| Fixed amount | a sum in account currency |
The panel
| Tab | What it holds |
|---|---|
| Now | holds the live context: the spread with its session average, the broker stops level, swaps, a countdown to the session close, the day range measured in ATR, the open and the weekly VWAP, ATR against its own twenty day average, and volume delta labelled honestly as tick direction imbalance rather than exchange volume. |
| Structure | turns levels into numbers: the weekly high, the round numbers around price and the weekly low, each with the distance to it in ATR, and one switch that draws them on the chart. Below them market structure is named, a break of structure and a change of character are kept apart, order blocks are counted, the nearest one is measured, and open fair value gaps are listed with their range. |
| News | shows the next high impact releases with forecast and previous, calls out the one that matters most for gold on its own line with a countdown, and answers plainly whether the trading window is clear. |
The macro window
A separate floating window, opened from the sidebar and draggable anywhere on the chart. It prices gold against the dollar index, silver, bitcoin and oil, reports the correlation with the dollar index and the S&P 500 over the last twenty bars, and adds the slower drivers: managed money net positioning from the CFTC with its weekly change, the ten year real yield, the VIX risk regime and official sector gold. Every block carries the date of the data it is showing, so a stale figure cannot pass for a fresh one.
None of these figures are baked into the file. The terminal fetches them on its own and refreshes them through the day, so the COT report, the real yield and the VIX you see are the current ones and each block tells you its own date.
The macro window needs one setting in the terminal before it can fetch its data. After your purchase, message me here on MQL5 and I will send you the setup instructions for it.
Scanner, preset and sessions
The multi timeframe scanner reads the trend on four timeframes you choose, from closed bars only, so an arrow does not change its mind halfway through a candle. Its source can be SuperTrend, SuperTrend together with EMA, EMA alone, or Obsidian Scalper PRO if you own it.
The gold preset holds SuperTrend, EMA 50 and 200, Ichimoku, RSI with divergence marks, Bollinger Bands, daily gold pivots and VWAP bands. Each has its own settings, and you choose how they reach you: a strip above the candles, a floating button, or a tab inside the panel.
Asia, London and New York can be shaded behind the price. Hours are given in GMT or in server time, and the offset to your broker clock is measured at runtime, so a server that moves for daylight saving is followed on its own.
| Trend source | What the arrow reads |
|---|---|
| SuperTrend | SuperTrend only, always up or down |
| SuperTrend + EMA | SuperTrend and EMA must agree, else neutral |
| EMA | price against EMA 50 |
| Obsidian Scalper PRO | the direction buffer of Obsidian Scalper PRO |
| Indicator | Default |
|---|---|
| SuperTrend | 10 / 3.0 |
| EMA | 50 / 200 |
| Ichimoku | 9 / 26 / 52 |
| RSI | 14 |
| Bollinger Bands | 20 / 2.0 |
| Gold pivots | D1 |
| VWAP bands | 1.0 |
If you own Obsidian Scalper PRO or SMC Structure Pro
Both are separate products and neither is included here. If one of them is installed, the terminal shows it on the same strip, with the same single click, and leaves its settings alone. SMC draws the structure on the chart while the Structure tab measures it, and the scanner can take its direction from Scalper PRO. If neither is installed, their buttons simply do not appear.
What it does not do
It does not trade for you. There is no strategy inside it, nothing to optimise, and a pass in the Strategy Tester will show no trades, because a person has to press the button.
The macro window needs an internet connection and its address added to the allowed URLs in the terminal settings. Without that the macro block stays empty and every other part of the product works normally.
Volume delta is computed from tick direction. It is not exchange traded volume, and the panel says so on the row itself.
The comparison instruments are found automatically from the usual names. Brokers name them differently, so if a row stays empty you type the exact Market Watch name into the settings and it fills in.
Structure, levels and volatility are computed on the symbol and timeframe of the chart it is running on.