RelicusRoad Action Levels MT5

RelicusRoad Action Levels is a support and resistance levels indicator for MetaTrader 4 and MetaTrader 5 that fits a grid of major and minor price levels to the symbol's own volatility and past reactions, and labels each level with its touch count.

The grid is not a fixed pip spacing and not a plain round-number grid. Its spacing and offset are chosen from completed bars, each level is scored on how price behaved around it, and only the strongest levels near the current price are drawn.

How it works

In the default Formula mode the indicator reads up to 1,200 completed bars of the selected timeframe and collects reactions: swing highs and lows, and bars with long upper or lower wicks. It then tries a range of spacings, based on typical bar range, on the distance between reactions and on a mix of the two, each with several offsets. The grid whose lines fit the reactions and past holds most closely is kept.

  • Touches: a touch counts again only after price has moved clearly away from the level.
  • Holds: price touched the level and then moved further in the favorable direction than against it.
  • Breaks and retests: price closed through the level and returned to it within 16 bars.
  • Recency and stability: recent behavior weighs more, and behavior is compared across three parts of the window.

Every level on the chosen grid is scored on these points, and up to five levels above and five below the last close are kept, with up to two extra levels on each side when their score is high enough. That makes 14 levels at most. Minor levels sit halfway between majors and are shown only when enough of them hold up; otherwise the chart shows majors alone.

What it draws

  • Major levels: horizontal lines, blue and dash-dot-dot by default.
  • Minor levels: horizontal lines, salmon and dotted by default, when the evidence supports them.
  • Touch labels: a small label such as 3t near the right edge of the chart, in the color of its line.
  • Tooltips: for example Major Formula Action Level | 3t | quality=0.62, with quality on a 0 to 1 scale.
  • Background drawing: lines sit behind price and cannot be selected.
  • No buffers: there are no Data Window values, so an Expert Advisor cannot read the levels.

Reading the chart

Blue lines are the main grid and salmon lines the halfway levels. The label beside each line counts the separate times price has come to it within the calculation window, and the tooltip adds a quality score.

The grid is checked again on each new bar. A new grid replaces the current one only when it fits clearly better, and very small shifts are taken as they come, so the lines stay steady most of the time but can move, appear or disappear as bars complete.

Labels are placed when the levels are drawn. If you scroll or zoom, they are repositioned on the next new bar.

Inputs

Formula mode (default):

  • Formula / Automatic: on by default; off switches to the older Legacy grid.
  • Timeframe: the timeframe whose bars feed the calculation; Current uses the chart timeframe.
  • Show Major Level and Show Minor Level: each set of lines toggles on its own.
  • Major Line Style and Minor Line Style: dash-dot-dot and dotted by default.
  • Major Line Color and Minor Line Color: blue and salmon by default, also used for the labels.

Legacy mode only (Formula / Automatic off):

  • Multiplier: widens or narrows the base gap taken from a per-symbol table.
  • Max Lines: how many level records are calculated, 100 by default.
  • Use Adaptive Levels: rescales the gap by recent movement and keeps 4 to 10 levels in the visible price range, so spacing depends on chart zoom.
  • Use Dynamic Rounding: rounds each level price to a precision suited to the asset class.

Recommended use

Works on forex, gold (XAUUSD), indices, stocks and crypto. Formula mode does not depend on the symbol name, so any instrument with at least 97 bars of history on the selected timeframe can be used. The defaults are ready to use.

Common questions

Are these round-number levels? Not necessarily. In Formula mode the offset of the grid is fitted to where price reacted, so levels can fall between round numbers.

Why are there no minor levels on my chart? In Formula mode minor levels are published only when enough of them have touches and a reasonable quality. When the evidence is weak, only major levels are drawn.

Does the grid cover the whole chart? No. It shows at most 14 levels, grouped around the last close, rather than lines across the full price history.

Does it show whether a level is support or resistance? No. Each line shows its touch count and quality. Which side of price it is on is for you to read.

Multiplier, Max Lines, Use Adaptive Levels and Use Dynamic Rounding apply only when Formula / Automatic is off. They have no effect in the default Formula mode.

About and support

The scored level grid is the Action Levels engine from RelicusRoad Pro, published alone for traders who want a data-fitted grid of price levels without the rest of the system. It runs standalone.

Questions and support are handled in the product comments and through the mql5.com messaging system.

Recommended products
FibExtender
Syed Oarasul Islam
This Indicator draws Fibonacci Extension levels in two different ways. You can select whether to draw Fibonacci Extension levels based on your favourite ZigZag settings or you can let the indicator to draw Fibonacci Extension  level based on given number of Bars or Candles.  You can also set Mobile and Email notification for your favourite Extension  levels individually. With this indicator you will not have to feel lonely as the it can generate Voice alerts, which will keep you focused on your
Historical Pivot Zones - Fibonacci Indicator MT5 Automatically draws Fibonacci retracement and projection zones based on historical price pivots. This MT5 indicator intelligently selects pivot points from different timeframes (weekly, monthly, or 6-month ranges) and creates visual Fibonacci zones around key levels. Features include: Smart Mode Selection - Auto-adjusts based on your chart timeframe Clean Visual Zones - Highlighted areas instead of just lines Essential Fib Levels - 9 retrace
"Hunttern harmonic pattern finder" base on the dynamic zigzag with the notification and prediction mode This version of the indicator identifies 11 harmonic patterns and predicts them in real-time before they are completely formed. It offers the ability to calculate the error rate of Zigzag patterns depending on a risk threshold. It moreover sends out a notification once the pattern is complete. The supported patterns: ABCD BAT ALT BAT BUTTERFLY GARTLEY CRAB DEEP CRAB CYPHER SHARK THREE DRIV
ArcTracer
Syed Oarasul Islam
This Indicator draws Fibonacci Arc levels in two different ways. You can select whether to draw Fibonacci Arc levels based on your favourite ZigZag settings or you can let the indicator to draw Arc levels based on given number of bars or candles.  You can also set Mobile and Email notification for your favourite Arc levels individually. With this indicator you will not have to feel lonely as the it can generate Voice alerts, which will keep you focused on your trading and remove boredom.  Produc
Peaks and Troughs MT5
Pavel Verveyko
5 (1)
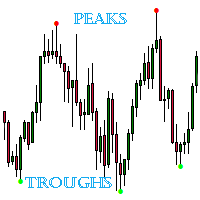
The indicator detects important peaks and troughs (extremes) on the chart. These points can be used to plot support/resistance levels and trend lines, as well as any other graphical analysis. These points can serve as reference points for setting trading orders. The indicator does not redraw . Settings: Size_History  - the size of the calculated history. Num_Candles_Right  - number of candles to the right of the peak or trough. Num_Candles_Left  - number of candles to the left of the peak or
Hot Zones MT5
Innovicient Limited
This indicator simplifies your entry zones by displaying the areas where you can plan your entry that potentially could give you high risk/reward ratios. Other than picking the most optimal entry points, the Hot Zone indicator can act as your typical support/resistance indicator for pullbacks for all timeframes. You can use this indicator as the only trading indicator or use it with another indicator for reentry purposes.  Besides, when using Hot Zones, the risk/reward ratio should be well abov
Levels Map
AL MOOSAWI ABDULLAH JAFFER BAQER
Levels Map See the market through its most important price levels. Levels Map is a professional MetaTrader utility that automatically identifies and displays significant market price levels directly on your chart. Designed to help traders visualize key areas of support, resistance, and market structure, Levels Map provides a clearer understanding of where price is likely to react before making trading decisions. Instead of manually drawing horizontal lines and constantly updating your charts, Le
Babel Assistant
Iurii Bazhanov
4.33 (9)
Babel assistant 1 The MT5 netting robot "Babel_assistant_1" uses the ZigZag indicator to generate Fibonacci levels across M1, M5, M15, H1, H4, D1, and W1 timeframes, and calculates the strength of buy and sell trends. It opens a position using the "Lot for open a position" setting if the specified trend level of 4.925 is exceeded. Then, Babel places pending orders at certain Fibonacci levels and sets the specified Stop Loss and Take Profit lines. The screen displays the current results of the po
FREE
Easy Indy
Vinutthapon Bumroong
This indicator automatically draws trendlines, Fibonacci levels, support and resistance zones, and identifies BOS (Break of Structure) and CHOCH (Change of Character) patterns on the chart. Just by placing it on the graph, it handles the essential technical analysis tasks for traders, providing a streamlined, effective trading tool this tools is alway make every one easy for trading.
Indicator LTS for MT5 (Level + Trends + Speed) The LTS indicator was specially created for quick analysis of consolidations on the chart, which greatly facilitates decision-making when trading. LTS marks resistance and gives information about the forces affecting it, as well as the current speed and average travel. The indicator is easily customizable and can analyze any timeframe.    LTS uses a unique trend analysis algorithm based on 4 parameters from global to local.
ADR Levels Plus
Dustin Ricardo Pierenz
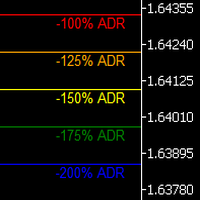
Uncover the market’s secret zones with the ADR Levels+ Indicator. This dynamic tool plots ADR extension levels at 100%, 125%, 150%, and 200% right on your chart. In most cases, price dances between these boundaries—but when it breaks out, it often signals a prime opportunity for a mean reversion trade or the start of an evolving trend. Plus, an integrated alarm system triggers as soon as these key levels are reached, ensuring you never miss a lucrative trading opportunity. Elevate your strategy
Unlock the power of Fibonacci with our advanced indicator! This tool precisely plots Fibonacci levels based on the previous day's high and low, identifying the next day's key support and resistance levels. Perfect for day trading and swing trading, it has consistently generated weekly profits for me. Elevate your trading strategy and seize profitable opportunities with ease. NOTE: In the Input section make sure the draw labels are set to "True" so you can see each levels.
Primes Action is a support and resistance indicator for MetaTrader 5 that draws the high and low levels of the previous day, week and month and shows the breakout when price breaks them, with arrows, a dashboard and alerts. Each timeframe has its own colour, so the three references are easy to tell apart. Works on Forex, gold (XAUUSD), indices and crypto; the levels come from one-minute data and are the same on every timeframe. How the levels are found The exact high or low of a period is oft
Market Trend Indicator Analog Copyright 2025, Jose María Molina Sánchez molinatrader67@gmail.com | Version 1.00 Introduction The Market Trend Indicator Analog is an advanced indicator designed to measure the strength and direction of market trends in real time. Unlike traditional oscillators, this indicator uses an adaptive filtering system that dynamically responds to market conditions, providing a precise analog representation between -100 and +100. Its design allows traders to ide
Money Flow Profile MT4  HERE   Use Guide Here our more valuable tools SMC Trend Trading   ,  Easy SMC Trading  ,  Institutional SMC Architect Volume Analysis Tools  ,  Volume flow Profile  ,  Market volume profile  , FVG with Volume  , Liquidity Heatmap Profile  ,  Volume Spread Analysis  Master Edition is a professional-grade analytical tool designed to visualize market structure through the lens of volume and money flow. Unlike standard volume indicators, this tool displays a Daily Vo
Volume Trade Levels
Mahmoud Sabry Mohamed Youssef
The idea behind this indicator is very simple , First it contains 2 mechanisms to place your trades: 1- Enter the Pips you want to duplicate to price levels. 2- Automatically let the indicator specify the largest Buy / Sell Volume Candle and place duplicated levels based on the candle itself. How it works: 1- Enter the Pips you want to duplicate to price levels:    1- once the indicator is loaded you will need first to Specify the number of pips in the indicator Configuration window ,you can g
Представлен принципиально новый индикатор ZigZag, который отличается от стандартного абсолютной легкостью, быстродействием расчетов и очень высокой точностью. В основе индикатора заложен принцип цикличности рынка с совокупностью анализа количества текущих баров и их основных ценовых уровней. Чем меньше баров для определения расчетов, тем более агрессивная постройка линий индикатора. Как и в  стандартном индикаторе перерисовывается только последняя линия, при изменении достигнутого экстремума. П
Somewhere over the rainbow It is a system that tries to operate the market from the exhaustion of the trend with a correction algorithm that tries to cut losses at the cost of increasing the margin This system makes all the adjustments automatically, analyzing the pair and the market to decide which is the most efficient step to reach your destination. Somewhere over the rainbow is a multiple trade and multi lot system(The maximum batch can be up to 5 times the initial batch distributed in mult
Introduction Harmonic Patterns are best used to predict potential turning point. Traditionally, Harmonic Pattern was identified manually connecting peaks and troughs points in the chart. Manual harmonic pattern detection is painfully tedious and not suitable for everyone. You are often exposed under subjective pattern identification with manual pattern detection. To avoid these limitations, Harmonic Pattern Plus was designed to automate your harmonic pattern detection process. The functionality
Candle EA MT5
Mansour Babasafary
4.14 (22)
This expert is based on patterns The main patterns of this specialist are candlestick patterns Detects trends with candlestick patterns It has a profit limit and a loss limit, so it has a low risk The best time frame to use this expert is M30 time frame The best currency pairs to use with this expert is the EURUSD, GBPUSD, AUDUSD, USDCAD currency pairs Attributes: Can be used in the EURUSD, GBPUSD, AUDUSD, USDCAD  currency pairs Can be used in M30, H1, H4 time frames Has profit limit and loss
Lines for MT5
Radim Kucera
4 (4)
Do you need to check support and resistance lines? Do you need to find them really fast and automatically? Do you want to set your own settings how to find them? Then this indicator is your right choice! Indicator Lines is developed for finding support and resistance lines on chart. It does its job quickly and fully automatically. Main principle of algorithm is to get all extremes on chart (according to "Density" parameter). Then indicator tries to find minimally 3 points (according to "Minimal
AutoTrend Pro
Aram Hussein Mohammed
TL Method — Automatic Trendline Detection & Strength Indicator Tired of drawing trendlines manually? TL Method does it for you — automatically detecting, drawing, and scoring trendlines in real time. What it does: Scans up to 1000 bars to find valid support and resistance trendlines Scores each trendline by counting confirmed anchor touches Generates buy/sell signal arrows when price approaches strong trendlines Alerts you via popup, push notification, or sound — with smart cooldown to avoid spa
Harness the power of the universe's most perfect number. Golden Retracement is an Expert Advisor meticulously engineered to identify and trade precise reversals at key Fibonacci retracement levels. It automatically detects significant market swings and calculates the golden ratio levels (38.2%, 50.0%, 61.8%), waiting for the price to "bounce" with a powerful confirmation. This bot brings mathematical elegance and disciplined execution to your trading, helping you capitalize on deep corrections a
Pattern Head and Shoulders is ideal for traders seeking reliable pattern recognition, including both bullish and bearish Head and Shoulders formations, with integrated Fibonacci levels, neckline break detection, and early prediction techniques. A powerful MT5 tool for those who value technical analysis, and precision in identifying chart structures and trend reversals. Dual Detection Methods Method 1 – Classic Pattern Detection Detects standard Head and Shoulders patterns (regular, inverted,
Unlock powerful breakout opportunities The 123 Pattern is one of the most popular, powerful and flexible chart patterns. The pattern is made up of three price points: a bottom, a peak or valley, and a Fibonacci retracement between 38.2% and 71.8%. A pattern is considered valid when the price breaks beyond the last peak or valley, moment at which the indicator plots an arrow, rises an alert, and the trade can be placed. [ Installation Guide | Update Guide | Troubleshooting | FAQ | All Products  ]
Pride Grid Virtual
Ekaterina Panteleeva
PRIDE GRID VIRTUAL — ADAPTIVE GRID EXPERT ADVISOR FOR METATRADER 5 Pride Grid Virtual is an automated Expert Advisor that manages independent BUY and SELL grids simultaneously. Grid spacing, profit targets and trailing parameters are calculated dynamically from the range of closed candles. Its key feature is the use of virtual grid legs. During the early stages of a grid cycle, levels are calculated internally and are not sent to the broker. Real positions start from the grid leg selected by t
Are you struggling with unreliable signals that flood your charts and cost you money? Want a powerful, easy-to-use indicator that combines three of the most trusted technical tools into one clear, no-repaint signal generator? This is it! Why Choose This Indicator? Triple Confirmation Strategy Combines EMA crossover, RSI momentum, and MACD histogram for reliable, high-probability signals. Reduce false entries and increase confidence! No Repainting Signals only on closed bars, so what you
Description The base of this indicator is an ZigZag algorithm based on ATR and Fibo retracement. The ZigZag can be drawn like a classic ZigZag or like Arrows or needn't be drawn at all. This indicator is not redrawing in sense that the ZigZag's last shoulder is formed right after the appropriate conditions occur on the market. The shoulder doesn't change its direction afterwards (can only continue). There are some other possibilities to show advanced information in this indicator: Auto Fibo on
Mean Reversion Supply Demand Indicator Mean Reversion Supply Demand is the indicator to detect the important supply demand zone in your chart. The concept of supply demand trading relies on the quantity mismatching between buying and selling volumes in the financial market. Typically, supply demand zone serves to predict the turning point. The wave pattern, for any supply demand zone to work as an successful trade, looks like the price must touch the base zone, move away and then return to zone
Support & Resistance Auto Plot Lines Indicator for MT5 – Perfect for Scalping! Make your trading easier with our Support & Resistance Auto Plot Lines indicator for MT5. This powerful tool automatically detects key support and resistance levels on your chart, helping you make better trading decisions with minimal effort. Why Choose This Indicator? Perfect for Scalping – Quickly identify strong price zones for fast, precise entries and exits. Automatic Level Detection – No need to manually dra
Buyers of this product also purchase
Trend Sniper X
Sarvarbek Abduvoxobov
4.86 (43)
Trend Sniper X is a multi-timeframe trend-following indicator for MetaTrader 5 that helps traders identify trend direction and potential reversal points with clarity and precision. for MT4: https://www.mql5.com/en/market/product/193245 Price Information: The current price is promotional and is subject to change as upcoming updates and new features are released. Bonus Offer: To get the FREE Auto-Trade Assistant EA for this indicator, please message the author after purchasing. Code2Profit Channe
Smart Trend Trading System — MetaTrader 5 Message me on MQL5 after purchase to receive Smart Universal Expert Advisor for FREE, plus the online course, PDF manual, and private group access. STTS brings trend direction, entry and exit signals, reversal zones, and important price levels together on your chart. Follow the system manually, or connect a separate compatible EA for automated execution using your chosen settings. ONE SYSTEM. FOUR TRADING APPROACHES. STTS organizes its trading approaches
A new King in town - Indicator + Order management indications(tp1+tp2+tp3) + Optional Telegram Signal sender   INCLUDED (FREE) + Bonus EA Robot ( FULL TRADING  and SIGNAL SYSTEM ) Our best EA for Gold: Gold Slayer TRY > Reversion Queen  Expert advisor >JOIN Community Channel < NEW Free Automation EA link < click here ( disclaimer: this is new and still on testing and phase , use at your risk on demo) Free Telegram Bridge < click here  This indicator includes an advanced Strategy, a trading sys
M5 Sniper
MeanFX
5 (3)
Get your trading edge in the line of sight M5 Sniper   is a new indicator by MeanFX. It combines   precise trading signals   with   adaptive TP/SL levels   - creating best possible statistical trades as a result! The price increases every 5 purchases, the next price is 79$ Message me after purchase to receive tips/guide and bonus EA Auto Optimisation only works on LIVE chart , needs data feed >JOIN Community Channel < What makes it stand out?   Proven statistical performance   on Gold XAUUSD
Ultra Indicator
Ihor Otkydach
5 (1)
ULTRA is a technical indicator that operates on an “all-in-one” basis—it independently analyzes the market, generates trading signals, displays levels for setting stop-loss orders, and suggests when to close trades to lock in profits or minimize losses. In other words, it doesn't matter if you don't know how to analyze the market, determine levels—where to set your stop-loss—or struggle with money management. ULTRA will do all of that for you! BUYER BONUS: After purchasing the ULTRA indicator, s
In 2019 I showed the whole world what this indicator can do. I traded its signals by hand, on a real account, in the open — the account was monitored live on Myfxbook, and I covered my experiment in detail on Facebook. The result: $10,000 became $941,411 in four months. The risk was deliberately extreme — the drawdown reached 54%, because in our profession profit and risk always go hand in hand. The Myfxbook screenshot is the first picture in the gallery. Looks like congratulations are in order:
SuperScalp Pro
Van Minh Nguyen
4.54 (37)
SuperScalp Pro - Professional Multi-Layer Confluence Scalping System SuperScalp Pro is an advanced scalping indicator that upgrades the classic Supertrend with multiple intelligent confirmation filters. It helps you identify higher-probability Buy/Sell opportunities while significantly reducing false signals. Clear Buy and Sell arrows appear directly on the chart, along with automatic ATR-based Stop Loss and Take Profit levels calculated in real time. After purchase, please message me on MQL5 to
Gann Made Easy   is a professional and easy to use Forex trading system which is based on the best principles of trading using the theory of W.D. Gann. The indicator provides accurate BUY and SELL signals including Stop Loss and Take Profit levels. You can trade even on the go using PUSH notifications. PLEASE CONTACT ME AFTER PURCHASE TO GET TRADING  INSTRUCTIONS   AND GREAT EXTRA INDICATORS  FOR FREE! Probably you already heard about the Gann trading methods before. Usually the Gann theory is a
SMC Intraday Formula
VividMind Digital Solutions
5 (26)
Secure the Lowest Price Today. After purchase, contact via   MQL5 inbox   to receive your buyer kit and bonus. Let's be honest first. No indicator will make you profitable on its own. If someone tells you otherwise, they're selling you a dream. Every indicator that shows perfect buy/sell arrows can be made to look flawless — just zoom into the right window of history and screenshot the winners. We won't do that. SMC Intraday Formula is a tool. It reads the market structure for you, maps the hig
M1 Sniper MT5
Oleg Rodin
5 (7)
M1 SNIPER  is an easy to use trading indicator system. It is an arrow indicator which is designed for M1 time frame. The indicator can be used as a standalone system for scalping on M1 time frame and it can be used as a part of your existing trading system. Though this trading system was designed specifically for short-term trading, it still can be helpful for all traders. This trading system can be used with any forex pair and time frame, though lower time frames are recommended from M1 up to M

Next Update — Version 2.52 Coming Soon! [NEW] Get Ready for 4 Major New Features Designed to Enhance Your Market Analysis and Trading Workflow We’re taking market analysis to the next level with 4   new features designed to meet your trading needs. Introducing: TRADE OVERVIEW DASHBOARD CONFLUENCE AT ZONE STRONG & WEAK HIGH/LOW OPTIMAL TRADE ENTRY  —   OTE 1. TADE OVERVIEW DASHBOARD  A dashboard that helps you understand the overall market picture more easily, providing guidance to support yo
Atomic Analyst MT5
Issam Kassas
4.5 (64)
Atomic Analyst — MetaTrader 5 Message me on MQL5 after purchase to receive Smart Universal Expert Advisor for FREE, plus the online course, PDF manual, and private group access. Atomic Analyst brings price action, trend direction, entry and exit signals, Stop Loss and multiple Take Profit levels together on your chart. SEE THE SIGNAL. UNDERSTAND THE SETUP. Atomic Analyst organizes its analysis into clear visual information: • Buy and sell arrows to identify potential entries. • Stop Loss and mul
Boba Analysis Suite
Trade Ready Solutions LLC
5 (2)
Boba Analysis Suite Boba Analysis Suite is an analytical indicator for MetaTrader 5. It brings market structure, relevant price zones and broader market context together in a single chart view. Developed through practical experience as a trader and trading coach, it supports a structured analysis process: assessing market direction, identifying important levels and considering multiple timeframes together. Analysis in Context Individual signals gain meaning through context. Boba Analysis Suite h
Adaptive Price Action Engine Buy Indicator- Get EA Based on it for FREE. Self-Optimizing Multi-Timeframe Trend & Candlestick Intelligence Markets do not behave the same way all the time—and not every price-action pattern has the same value in every market regime. Adaptive Price Action Engine is designed to adapt to changing market conditions by combining trend structure, multi-timeframe analysis, candlestick patterns, and statistical optimization into one analytical framework. Two Adaptive Mode
Azimuth Pro
Ottaviano De Cicco
5 (7)
Azimuth Pro V2: Synthetic Fractal Structure and Confirmed Entries for MT5 Overview Azimuth Pro is a multi-level swing structure indicator by Merkava Labs . Four nested swing layers, swing-anchored VWAP, ABC pattern detection, three-timeframe structural filtering, and closed-bar confirmed entries — one chart, one workflow from micro-swings to macro-cycles. This is not a blind signal product. It is a structure-first workflow for traders who care about location, context, and timing. Halloween P
Auto Optimized SpeedAngle is an institutional-grade momentum vectoring system that eliminates curve-fitting through continuous Walk-Forward Optimization (WFO). Rather than relying on static inputs that degrade when market regimes shift, the indicator dynamically recalibrates its parameters using Out-of-Sample (OOS) validation, ensuring the displayed signals represent genuine statistical edges rather than historical anomalies. By shifting the focus from subjective visual angles to normalized, qua
Zain Gold Scalping
Ahmed Gamal Abdel Nasser Mohamed
A complete price-action analysis tool built around dual independent entry logic, each confirmed against a volatility band, combined with a configurable set of nine optional confirmation filters that let you shape exactly how conservative or aggressive the tool's signals behave. Core Strategy Two independent entry setups, each triggering only when price moves outside a dynamic volatility band — giving two distinct ways to spot potential reversal points, which can be used together or separately.
Tokyo mt5 Indicator
Vasiliy Strukov
5 (14)
Tokyo Indicator provides a clear visual overview of trend direction, potential trading signals, and market conditions. Its colour-coded, stepped trend line distinguishes bullish phases in blue from bearish phases in magenta. Matching directional arrows highlight potential buying and selling opportunities when the displayed trend changes. An integrated dashboard brings together the current signal, market bias, momentum, volatility, and signal quality in one convenient view. This allows traders t
FiboSniper Pro
Van Minh Nguyen
5 (4)
FiboSniper Pro - Multi-Filter Fibonacci System with Auto SL/TP and Control Panel FiboSniper Pro is a technical indicator that combines dynamic Fibonacci Envelopes with multiple confirmation filters to generate selective Buy and Sell signals. Fibonacci levels are calculated from Moving Average and ATR, then filtered by ADX, EMA, RSI, ATR, Volume, Time and Candle structure. The indicator displays automatic ATR-based Stop Loss and Take Profit levels directly on the chart, along with an interactive
Quantum TrendPulse
Bogdan Ion Puscasu
5 (26)
Introducing Quantum TrendPulse , the ultimate trading tool that combines the power of SuperTrend , RSI , and Stochastic into one comprehensive indicator to maximize your trading potential. Designed for traders who seek precision and efficiency, this indicator helps you identify market trends, momentum shifts, and optimal entry and exit points with confidence. Key Features: SuperTrend Integration: Easily follow the prevailing market trend and ride the wave of profitability. RSI Precision: Detect
Superhero
Ihor Otkydach
5 (3)
The SUPERHERO indicator is a multi-currency trading system designed on an "all-inclusive" basis. The indicator independently analyzes the market and provides signals on when to open and close trades. It uses Stop Loss and Take Profit orders. The R:R ratio is 1:1. This system can send push notifications to your smartphone, so you can place trades "on the go" without needing to be tied to a PC. It's perfect for proprietary trading firms. A BONUS FOR EVERY CUSTOMER: Every buyer of this indicator wi
Multi Currency Strength and Momentum Indicator MT5 Dynamic Forex28 Navigator is the evolution of our long-time, popular indicators, combining the power of three into one: Advanced Currency Strength28 Indicator (700 reviews) Advanced Currency IMPULSE with ALERT (530 reviews) CS28 Combo Signals (recent Bonus) The two predecessor indicators together have received more than 1,200 reviews on the MQL5 Market and have been a staple in the MT4 community since 2016. Dynamic Forex28 Navigator MT5 carries
Trend Catcher ind mt5
Ramil Minniakhmetov
5 (18)
TREND CATCHER INDICATOR Trend Catcher Indicator analyzes market price movements, using a combination of the author’s proprietary and customized adaptive trend-analysis indicators.  It identifies the true market direction by filtering out short-term noise and focusing on underlying momentum strength, volatility expansion, and price structure behavior.  It also uses a combination of smoothing and trend-filtering customized indicators such as moving averages, RSI, and volatility filters.   Real ope
Apex Patterns PRO Buy Indicator - Get Expert Advisor Based on it for FREE. Self-Optimizing Chart Pattern & Breakout Intelligence Traditional pattern scanners rely on fixed inputs, often underperforming when market volatility and structures shift. Apex Patterns PRO is designed to adapt to changing market conditions by combining structural chart pattern recognition, momentum filtering, and statistical self-optimization into one analytical framework. Adaptive Scanning Engine Self-Optimizing Patter
Neuro Poseidon MT5
Daria Rezueva
4.68 (53)
Neuro Poseidon is a new indicator by Daria Rezueva. It combines precise trading signals with adaptive TP/SL levels - creating best possible trades as a result! Message me and get  Neuro Poseidon Assistant  as a gift to automize your trading process! What makes it stand out? 1. Proven profitability on all assets and timeframes 2. Only confirmed BUY and SELL signals present on the chart 3. Adaptive TP & SL levels generated by the software for each trade 4. Easy to understand - suitable for al
Crystal Heikin Ashi Signals
Muhammad Jawad Shabir
5 (5)
Crystal Heikin Ashi Signals—Professional Trend & Signal Detection Indicator Advanced Heikin Ashi Visualization with Intelligent Signal System for Manual & Automated Trading Final Price: $149 ---------> Price goes up $10 after every 10 sales . Limited slots available — act fast . Overview User Guide PDF Crystal Heikin Ashi Signals is a professional-grade MetaTrader 5 indicator that combines pure Heikin Ashi candle visualization with an advanced momentum-shift detection system. Designed for both m
Break and Retest Hunter is a powerful MetaTrader 5 indicator designed to automatically identify support and resistance levels, breakout structures, and potential retest opportunities in real time. Bonus Indicator: After purchasing Break and Retest Hunter , contact me to receive Trade Indicator Assistant EA completely free as a bonus utility. $65 for the next 10 copies . Next price is $120.  Combining adaptive market analysis, clear BUY/SELL signals, Fibonacci-based profit targets, and a premiu
Power Candles MT5
Daniel Stein
4.58 (12)
Power Candles - Self-Optimizing Strength Indicator Strength usually lives in a sub-window. The line runs below, the candle above, and your eye keeps connecting the two. Power Candles puts the strength into the candle itself, colored from dark red to dark green, so the chart reads at a glance and the sub-window stays closed. The indicator also finds its own settings for the symbol and timeframe in front of you. One click on [ Apply Best ] draws entry, Stop Loss and Take Profit at the exact prices
Unix Scalper
Issam Kassas
4 (4)
Unix Scalper — MetaTrader 5 Message me on MQL5 after purchase to receive Smart Universal Expert Advisor for FREE, plus the online course, PDF manual, and private group access. Find the setup. See the plan. Choose how to trade it. UNIX Scalper brings market analysis, BUY/SELL/WAIT decisions and Entry, Stop Loss, TP1 and TP2 levels into one organized panel. SEE THE SIGNAL AND THE PLAN • Clear decisions: BUY, SELL or WAIT. • Defined levels: Entry, Stop Loss, TP1 and TP2. • Multi-timeframe overvie
Smart Harmonic Patterns - MetaTrader 5 Message me on MQL5 after purchase to receive Smart Universal Expert Advisor for FREE, plus the online course, PDF manual, and private group access. Review harmonic price structures directly on your MetaTrader 5 chart. Smart Harmonic Patterns combines an 88-variant catalog, an ATR-based ZigZag detector and a chart panel for selecting the patterns and drawings you want to see. Use it for visual analysis and discretionary trade planning. The indicator does not
More from author
RelicusRoad Pro MT5
Relicus LLC
4.96 (25)
Stop guessing your trades. Know when to enter, where to get out and which way the market leans, all on one chart. RelicusRoad Pro brings nearly twenty tools into one indicator, and you switch on the ones that fit the way you trade. Clear entries. Clear exits. A plan on every chart. Sound familiar? You buy, and price turns against you a minute later. You close too early, then watch the move carry on without you. Five indicators on the chart, five different answers. Your stop loss is a guess. Why
The Moving Average Convergence Divergence (MACD) trading strategy is a popular technical analysis tool that is used to identify changes in momentum and trend direction. The MACD is calculated by subtracting the 26-period exponential moving average (EMA) from the 12-period EMA. A 9-period EMA, called the "signal line," is then plotted on top of the MACD to act as a trigger for buy and sell signals. Want support and every tool in one streamlined indicator? This MACD is part of the RelicusRoad Pr
FREE
RelicusRoad MACD v2
Relicus LLC
4.67 (6)
The Moving Average Convergence Divergence (MACD) trading strategy is a popular technical analysis tool that is used to identify changes in momentum and trend direction. The MACD is calculated by subtracting the 26-period exponential moving average (EMA) from the 12-period EMA. A 9-period EMA, called the "signal line," is then plotted on top of the MACD to act as a trigger for buy and sell signals. Want support and every tool in one streamlined indicator? This MACD is part of the RelicusRoad Pr
FREE
RelicusRoad Signal Line is a trend filter indicator for MetaTrader 4 and MetaTrader 5 that draws two moving average lines and colors each bar of them green, salmon or gray from a strategy filter you choose. The line shows where the average is. The color shows what the chosen filter says about that bar. By default Line 1 is a fast KAMA 9 colored by momentum and Line 2 is a slow Hull moving average 200 colored by Ichimoku. How it works Each line is calculated from closing prices with the average t
FREE
RelicusRoad Signal Line is a trend filter indicator for MetaTrader 4 and MetaTrader 5 that draws two moving average lines and colors each bar of them green, salmon or gray from a strategy filter you choose. The line shows where the average is. The color shows what the chosen filter says about that bar. By default Line 1 is a fast KAMA 9 colored by momentum and Line 2 is a slow Hull moving average 200 colored by Ichimoku. How it works Each line is calculated from closing prices with the average t
FREE
RelicusRoad Signal Cloud is a cloud indicator for MetaTrader 4 and MetaTrader 5 that projects a price band 21 bars ahead, sized by the gap between the 12 and 26 period EMAs. The band is centered on a 3-period EMA of close and smoothed so its edges move gradually. Because it is shifted forward, part of the cloud always sits to the right of the last bar, and price later arrives at the section that was drawn earlier. How it works For each bar the indicator measures the absolute gap between the 12 a
FREE
RelicusRoad Multi Timeframe Trendbar is a multi-timeframe trend indicator for MetaTrader 4 and MetaTrader 5 that shows an Uptrend, Neutral or Downtrend state for nine timeframes, M1 to MN1, as a row of colored dots in the chart corner. Each timeframe gets one dot with its name above it, in the lower-right corner of the chart. The color tells you the state, so you can see which timeframes agree without switching charts. How it works For each timeframe, the indicator compares two standard tools on
FREE
RelicusRoad Multi Timeframe Levels is a multi-timeframe support and resistance indicator for MetaTrader 4 and MetaTrader 5 that draws the latest swing high and swing low from H1, H4, D1, W1 and MN1 as horizontal lines on the chart you are trading. Each of those five timeframes contributes one resistance line and one support line, so an intraday chart carries up to ten lines. Every line is colored by the timeframe it came from, which keeps the higher-timeframe swings in view without switching cha
FREE
RelicusRoad Daily Pivots is a daily pivot points indicator for MetaTrader 4 and MetaTrader 5 that divides the previous day's range into Fibonacci levels and extends them above and below it, from minus 100 to plus 200 percent. Instead of classic floor pivots, the previous completed range is treated as a scale where the low is 0% and the high is 100%. Nineteen levels are printed as compact colored markers at the right edge of the chart, so the size of today's move reads as a fraction or a multiple
FREE
RelicusRoad SuperTrend is a SuperTrend indicator for MetaTrader 4 and MetaTrader 5 that plots an ATR-based trailing line below price in an uptrend and above price in a downtrend. It is the classic SuperTrend calculation with nothing layered on top: one line for the up side, one for the down side, and no arrows, labels or panels. How it works For every bar the indicator takes the median price, the midpoint of the bar's high and low, and sets a band a chosen number of Average True Range (ATR) unit
FREE
RelicusRoad Daily High Low is a previous day high and low indicator for MetaTrader 4 and MetaTrader 5 that marks yesterday's high and low and today's open on every bar of an intraday chart. The three levels are drawn as colored dot series that step to new values when a new period starts, with small High, Low and Open tags at the end of each period. On charts from H1 to H4 the same markers show last week's range and this week's open instead, and on D1 they show the monthly equivalents. How it wor
FREE
RelicusRoad SuperTrend is a SuperTrend indicator for MetaTrader 4 and MetaTrader 5 that plots an ATR-based trailing line below price in an uptrend and above price in a downtrend. It is the classic SuperTrend calculation with nothing layered on top: one line for the up side, one for the down side, and no arrows, labels or panels. How it works For every bar the indicator takes the median price, the midpoint of the bar's high and low, and sets a band a chosen number of Average True Range (ATR) unit
FREE
RelicusRoad Fractals is a fractal indicator for MetaTrader 4 and MetaTrader 5 that marks swing highs and swing lows at two strengths, a Fast test of 7 bars on each side and a Slow test of 15 bars on each side. A 7-bar window on each side already filters out many small wiggles, and the Slow test asks for more than twice that, so its thicker arrows pick out the swings that held over a much wider stretch of the chart. Both strengths are shown together, so minor and larger swings can be told apart a
FREE
RelicusRoad Multi Timeframe Levels is a multi-timeframe support and resistance indicator for MetaTrader 4 and MetaTrader 5 that draws the latest swing high and swing low from H1, H4, D1, W1 and MN1 as horizontal lines on the chart you are trading. Each of those five timeframes contributes one resistance line and one support line, so an intraday chart carries up to ten lines. Every line is colored by the timeframe it came from, which keeps the higher-timeframe swings in view without switching cha
FREE
RelicusRoad Daily High Low is a previous day high and low indicator for MetaTrader 4 and MetaTrader 5 that marks yesterday's high and low and today's open on every bar of an intraday chart. The three levels are drawn as colored dot series that step to new values when a new period starts, with small High, Low and Open tags at the end of each period. On charts from H1 to H4 the same markers show last week's range and this week's open instead, and on D1 they show the monthly equivalents. How it wor
FREE
RelicusRoad Multi Timeframe Trendbar is a multi-timeframe trend indicator for MetaTrader 4 and MetaTrader 5 that shows an Uptrend, Neutral or Downtrend state for nine timeframes, M1 to MN1, as a row of colored dots in the chart corner. Each timeframe gets one dot with its name above it, in the lower-right corner of the chart. The color tells you the state, so you can see which timeframes agree without switching charts. How it works For each timeframe, the indicator compares two standard tools on
FREE
RelicusRoad Signal Cloud is a cloud indicator for MetaTrader 4 and MetaTrader 5 that projects a price band 21 bars ahead, sized by the gap between the 12 and 26 period EMAs. The band is centered on a 3-period EMA of close and smoothed so its edges move gradually. Because it is shifted forward, part of the cloud always sits to the right of the last bar, and price later arrives at the section that was drawn earlier. How it works For each bar the indicator measures the absolute gap between the 12 a
FREE
RelicusRoad CopyTrader is a free trade copier for MetaTrader 5 . It copies trades between MT5 terminals on the same computer, so you can trade one account and have the others follow it, each at its own size and risk. Full version, no limitations, no trial period. Trade one account. Let the rest follow. MetaTrader 4: RelicusRoad CopyTrader MT4 How it works One terminal runs as the Leader (master) and shares the orders it holds. Any number of terminals run as Followers (slaves) and mirror them. Te
FREE
RelicusRoad Daily Pivots is a daily pivot points indicator for MetaTrader 4 and MetaTrader 5 that divides the previous day's range into Fibonacci levels and extends them above and below it, from minus 100 to plus 200 percent. Instead of classic floor pivots, the previous completed range is treated as a scale where the low is 0% and the high is 100%. Nineteen levels are printed as compact colored markers at the right edge of the chart, so the size of today's move reads as a fraction or a multiple
FREE
RelicusRoad Trading Sessions is a trading sessions indicator for MetaTrader 4 and MetaTrader 5 that marks the opening time of the Tokyo, London and New York sessions with dotted vertical lines on M1, M5 and M15 charts. Each session open is shown as a line, a small rotated name label and an event marker in the session's color, for the current day and the previous weekdays. Hovering over one shows the session name and its opening time. The indicator marks opens only: it does not shade session rang
FREE
RelicusRoad Trading Sessions is a trading sessions indicator for MetaTrader 4 and MetaTrader 5 that marks the opening time of the Tokyo, London and New York sessions with dotted vertical lines on M1, M5 and M15 charts. Each session open is shown as a line, a small rotated name label and an event marker in the session's color, for the current day and the previous weekdays. Hovering over one shows the session name and its opening time. The indicator marks opens only: it does not shade session rang
FREE
RelicusRoad Fractals is a fractal indicator for MetaTrader 4 and MetaTrader 5 that marks swing highs and swing lows at two strengths, a Fast test of 7 bars on each side and a Slow test of 15 bars on each side. A 7-bar window on each side already filters out many small wiggles, and the Slow test asks for more than twice that, so its thicker arrows pick out the swings that held over a much wider stretch of the chart. Both strengths are shown together, so minor and larger swings can be told apart a
FREE
RelicusRoad CopyTrader is a free trade copier for MetaTrader 4 . It copies trades between MT4 terminals on the same computer, so you can trade one account and have the others follow it, each at its own size and risk. Full version, no limitations, no trial period. Trade one account. Let the rest follow. MetaTrader 5: RelicusRoad CopyTrader MT5 How it works One terminal runs as the Leader (master) and shares the orders it holds. Any number of terminals run as Followers (slaves) and mirror them. Te

FREE
RelicusRoad Pro
Relicus LLC
4.65 (107)
Stop guessing your trades. Know when to enter, where to get out and which way the market leans, all on one chart. RelicusRoad Pro brings nearly twenty tools into one indicator, and you switch on the ones that fit the way you trade. Clear entries. Clear exits. A plan on every chart. Sound familiar? You buy, and price turns against you a minute later. You close too early, then watch the move carry on without you. Five indicators on the chart, five different answers. Your stop loss is a guess. Why
RelicusRoad Support Resistance is a support and resistance indicator for MetaTrader 4 and MetaTrader 5 that builds supply and demand zones from fractal swings and grades each one by its strength and recent tests. It keeps a short map of zones above and below price, each labeled with its grade, width and recent test count. How it works Swing highs and lows are collected into price zones rather than single lines. A swing is a bar whose high or low is not exceeded by the 7 bars on either side, and
RelicusRoad Action Levels is a support and resistance levels indicator for MetaTrader 4 and MetaTrader 5 that fits a grid of major and minor price levels to the symbol's own volatility and past reactions, and labels each level with its touch count. The grid is not a fixed pip spacing and not a plain round-number grid. Its spacing and offset are chosen from completed bars, each level is scored on how price behaved around it, and only the strongest levels near the current price are drawn. How it w
RelicusRoad Scalping Pivots is a swing point and Fibonacci level indicator for MetaTrader 4 and MetaTrader 5 that marks alternating swing highs and lows over a 60-bar lookback and labels Fibonacci retracements and extensions of the latest swing. The pivots in the name are these swing points, not classic floor pivot points such as PP, R1 and S1. Next to the newest swing, the indicator prints a column of percentage labels so you can read retracement and extension levels without drawing a Fibonacci
RelicusRoad Dynamic Circles is a swing high and swing low indicator for MetaTrader 4 and MetaTrader 5 that marks turning points with circles at three lookback lengths at once: 9, 60 and 156 bars. Small turns and large turns sit on the same chart but look different. A short range dot shows a minor swing, while the larger medium and long range rings only appear where price made the extreme of a much longer window. Each circle can carry a short text label such as HH(60) or LL(156). How it works For
RelicusRoad Trendlines is an automatic trendline indicator for MetaTrader 4 and MetaTrader 5 that fits trendline channels through confirmed swing pivots at three swing sizes and draws them as shaded zones. Short, medium and long swings each have their own color. The chart shows the two or three channels that score highest at the moment, plus a grey checkerboard box that maps a reference entry, stop and target for one selected rail. How it works A swing high or low is confirmed only when it is th
RelicusRoad Order Blocks is an order block indicator for MetaTrader 4 and MetaTrader 5 that finds displacement candles, marks the candle that started each move as a bullish or bearish order block, and tracks how far price has traded back into it. It is written for traders who work with smart money concepts (SMC). How it works A displacement candle is one whose body is at least 1.5 times the Average True Range (ATR) of the last 14 bars and at least 55 percent of its own high-to-low range. The ind
Filter:
No reviews
Reply to review