
Fibonacci Trend Continuation MT4 Multi TF Scanner
- Indicators
-
Duc Hoan Nguyen
 I develop practical trading tools for MetaTrader 4/5, with a focus on indicator integration, Multi-Timeframe analysis, market scanning, and automated trading solutions.
My work mainly includes:
• Indicator-to-EA Solutions - Version: 1.1
- Updated: 28 September 2026
- Activations: 10
Get this indicator and more for free here: Convert indicator into a trading robot (no coding required)
Special offer: ALL TOOLS, just $35 each for a limited time!
New tools will be $30 for the first week or the first 3 purchases!
Trading Tools Channel on MQL5: Join my MQL5 channel to update the latest news from me
See more MT5 version at: Fibonacci Trend Continuation MT5 Multi TF Scanner
See more MT4 version at: Fibonacci Trend Continuation MT4 Multi TF Scanner
See more products at: All Products or Trading Indicators, Special Offers & New Releases
Fibonacci Trend Continuation Multi-TF Scanner is a trend-following indicator designed to identify trend direction, dynamic pullback levels, and continuation signals. It combines a moving-average Midline, volatility-adjusted bands, configurable Fibonacci levels, Multi-Timeframe display, and a Multi-Symbol Scanner.
The indicator does not draw Fibonacci levels from manually selected swing points. Instead, it continuously calculates dynamic Fibonacci levels from the current Midline and volatility bands. These levels automatically adapt as price movement and market volatility change.
1. How the indicator worksThe indicator builds its trend structure from three main components:
- Midline: the central trend reference.
- Upper and Lower Bands: volatility-adjusted trend boundaries.
- Dynamic Fibonacci Levels: pullback levels calculated between the Midline and the corresponding outer band.
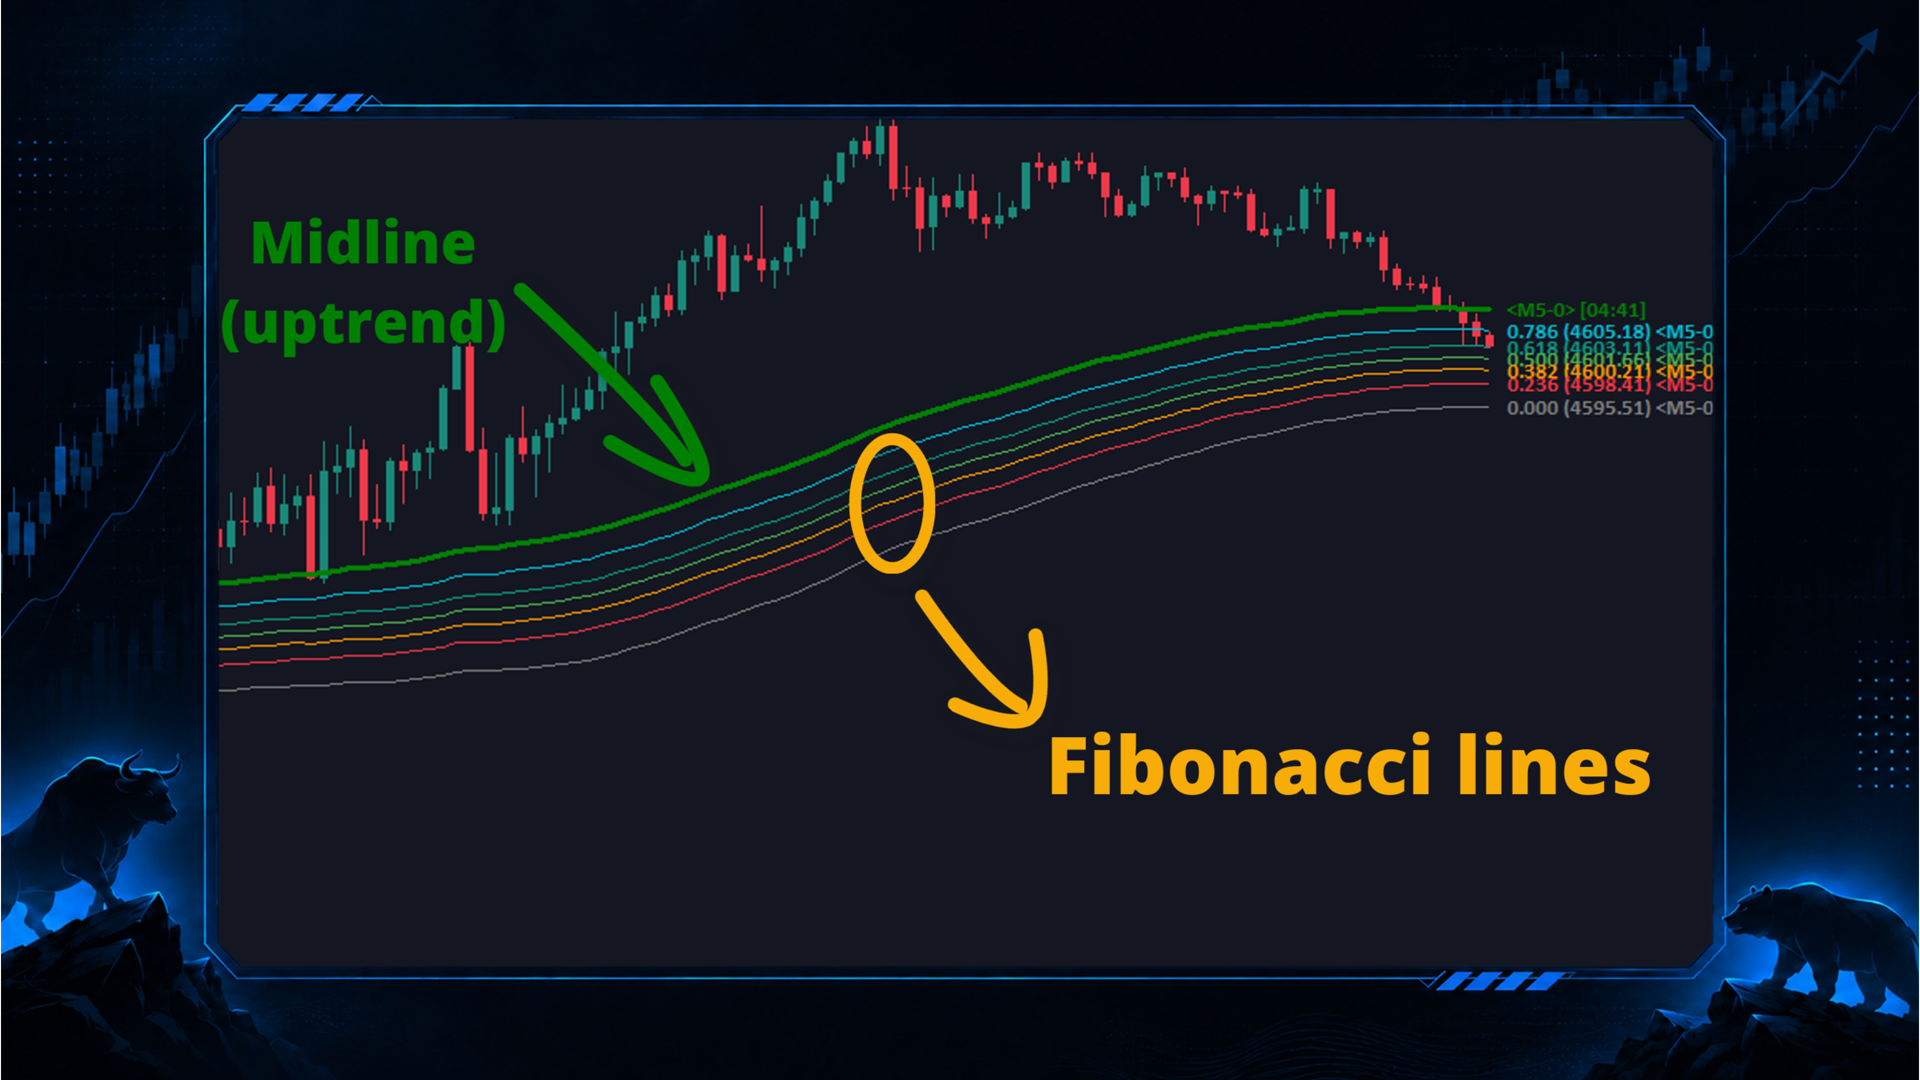
The Midline represents the central trend reference of the indicator. It is calculated by applying the selected moving-average method to the selected price source.
The available price sources include:
- Close
- Open
- High
- Low
- Median Price (HL/2)
- Typical Price (HLC/3)
- Weighted Price (HLCC/4)
- Average Price (OHLC/4)
The default setting uses EMA 100 applied to Close.
Shorter Midline Length → faster response → more frequent changes
Longer Midline Length → smoother response → slower changes
The Midline changes its display according to the detected trend:
3. Volatility calculationGreen Midline → Bullish trend state
Red Midline → Bearish trend state
The distance between the Midline and the outer bands is based on recent price movement.
First, the indicator calculates the High-Low range of each candle:
High-Low Range = High - Low
This range is smoothed using the selected Delta High-Low MA Method and Delta High-Low MA Period. The result is then smoothed again using the selected Volatility MA Method and Volatility Length.
This two-stage calculation helps create a more stable volatility measurement while still allowing the bands to adjust when market conditions change.
The available moving-average methods include:
- SMA
- EMA
- SMMA
- LWMA
- RMA
- HMA
- WMA
- VWMA
The outer bands are calculated from the Midline and the smoothed volatility value:
Upper Band = Midline + Volatility × Band Width
Lower Band = Midline - Volatility × Band Width
Band Width controls the distance between the Midline and the outer bands.
Smaller Band Width → narrower bands → more responsive trend changes
Larger Band Width → wider bands → stronger price movement required for a trend change
The bands therefore act as volatility-adjusted trend boundaries rather than fixed price distances.
5. Trend Shift: when does the trend change?A Bullish trend begins when the selected Trend Shift Confirmation Price moves above the Upper Band.
A Bearish trend begins when the selected Trend Shift Confirmation Price moves below the Lower Band.
When the trend changes:
- A Bullish Trend Shift marker is displayed when the state changes from Bearish to Bullish.
- A Bearish Trend Shift marker is displayed when the state changes from Bullish to Bearish.
- The Midline changes to the corresponding Bullish or Bearish color.
- The Fibonacci levels are moved to the appropriate side of the Midline.
Bearish → Price breaks above Upper Band → Bullish Trend Shift
Bullish → Price breaks below Lower Band → Bearish Trend Shift
The available Trend Shift Confirmation Methods are:
- Close Price: uses the candle's closing price.
- Wick: uses High for an upward breakout and Low for a downward breakout.
- Strong Close (OC2): uses the midpoint of Open and Close.
- Medium (HL2): uses the midpoint of High and Low.
- Typical (HLC/3): uses High, Low, and Close.
- Weighted (HLCC/4): gives additional weight to Close.
- Average (OHLC/4): uses the average of Open, High, Low, and Close.
Close provides a balanced confirmation method. Wick reacts earlier but is more sensitive to temporary price spikes. Strong Close uses the candle-body midpoint and provides stricter confirmation.
6. Dynamic Fibonacci levelsDuring a Bullish trend, the Fibonacci levels are calculated between the Lower Band and the Midline.
During a Bearish trend, the Fibonacci levels are calculated between the Upper Band and the Midline.
The default Fibonacci levels are:
- 0.786
- 0.618
- 0.500
- 0.382
- 0.236
- 0.000
During a Bullish trend:
Lower Band → 0.000 → 0.236 → 0.382 → 0.500 → 0.618 → 0.786 → Midline
During a Bearish trend:
Upper Band → 0.000 → 0.236 → 0.382 → 0.500 → 0.618 → 0.786 → Midline
Level 0.000 is located at the outer volatility band. Higher Fibonacci values are positioned progressively closer to the Midline. Level 0.786 is the closest default signal level to the Midline.
These levels form a dynamic pullback structure around the trend Midline. Because their distance is based on volatility, the structure expands during stronger price movement and contracts during quieter conditions.
Each Fibonacci level can be customized independently:
- Fibonacci value
- Show or hide
- Color
- Line style
- Line width
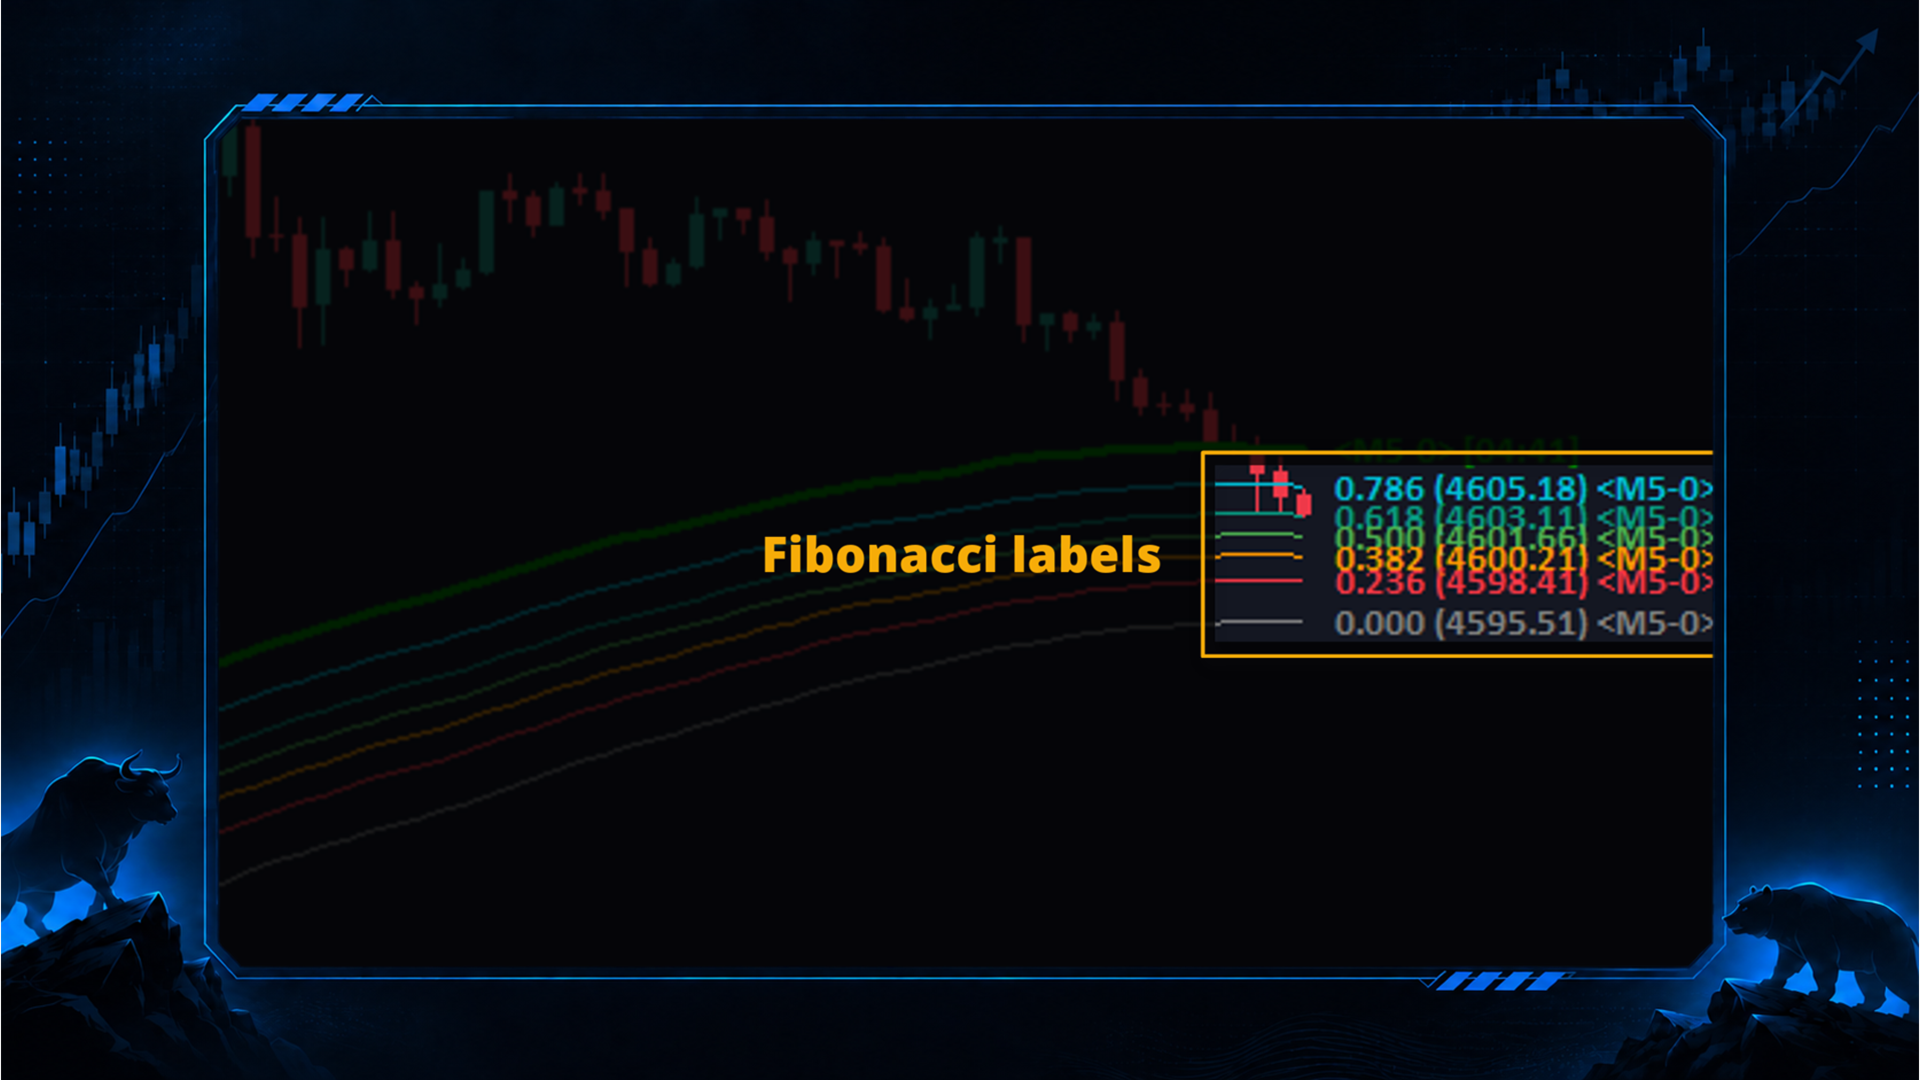
- Label visibility
When enabled, the label displays the Fibonacci ratio, its current price value, and the corresponding timeframe.
7. Meaning of the Fibonacci levelsThe Fibonacci levels represent different pullback depths inside the active trend structure.
0.786: shallow pullback, closest to the Midline
0.618: moderate pullback
0.500: middle of the trend zone
0.382 and 0.236: deeper pullback
0.000: outer volatility boundary
Because 0.786 is closest to the Midline, it generally represents a shallower pullback and faster realignment with the trend. Lower ratios are located progressively farther from the Midline.
A signal from a deeper level does not automatically mean that it is better. It indicates that price moved farther away from the Midline before crossing back in the trend direction.
The signal should therefore be evaluated together with market structure, Support and Resistance, volatility, session conditions, and the user's own risk-management method.
8. How Buy and Sell signals are createdA signal is generated only when the trend remains active and price crosses a Fibonacci level in the direction of that trend.
8.1. Buy Signal
A Buy Signal is created when:
- The current trend is Bullish.
- The previous candle is also in the Bullish trend state.
- The selected Signal Confirmation Price crosses upward through one of the enabled lower Fibonacci levels.
- A Buy Arrow is displayed below the candle.
Bullish Trend → Pullback → Upward Fibonacci Cross → Buy Signal
8.2. Sell Signal
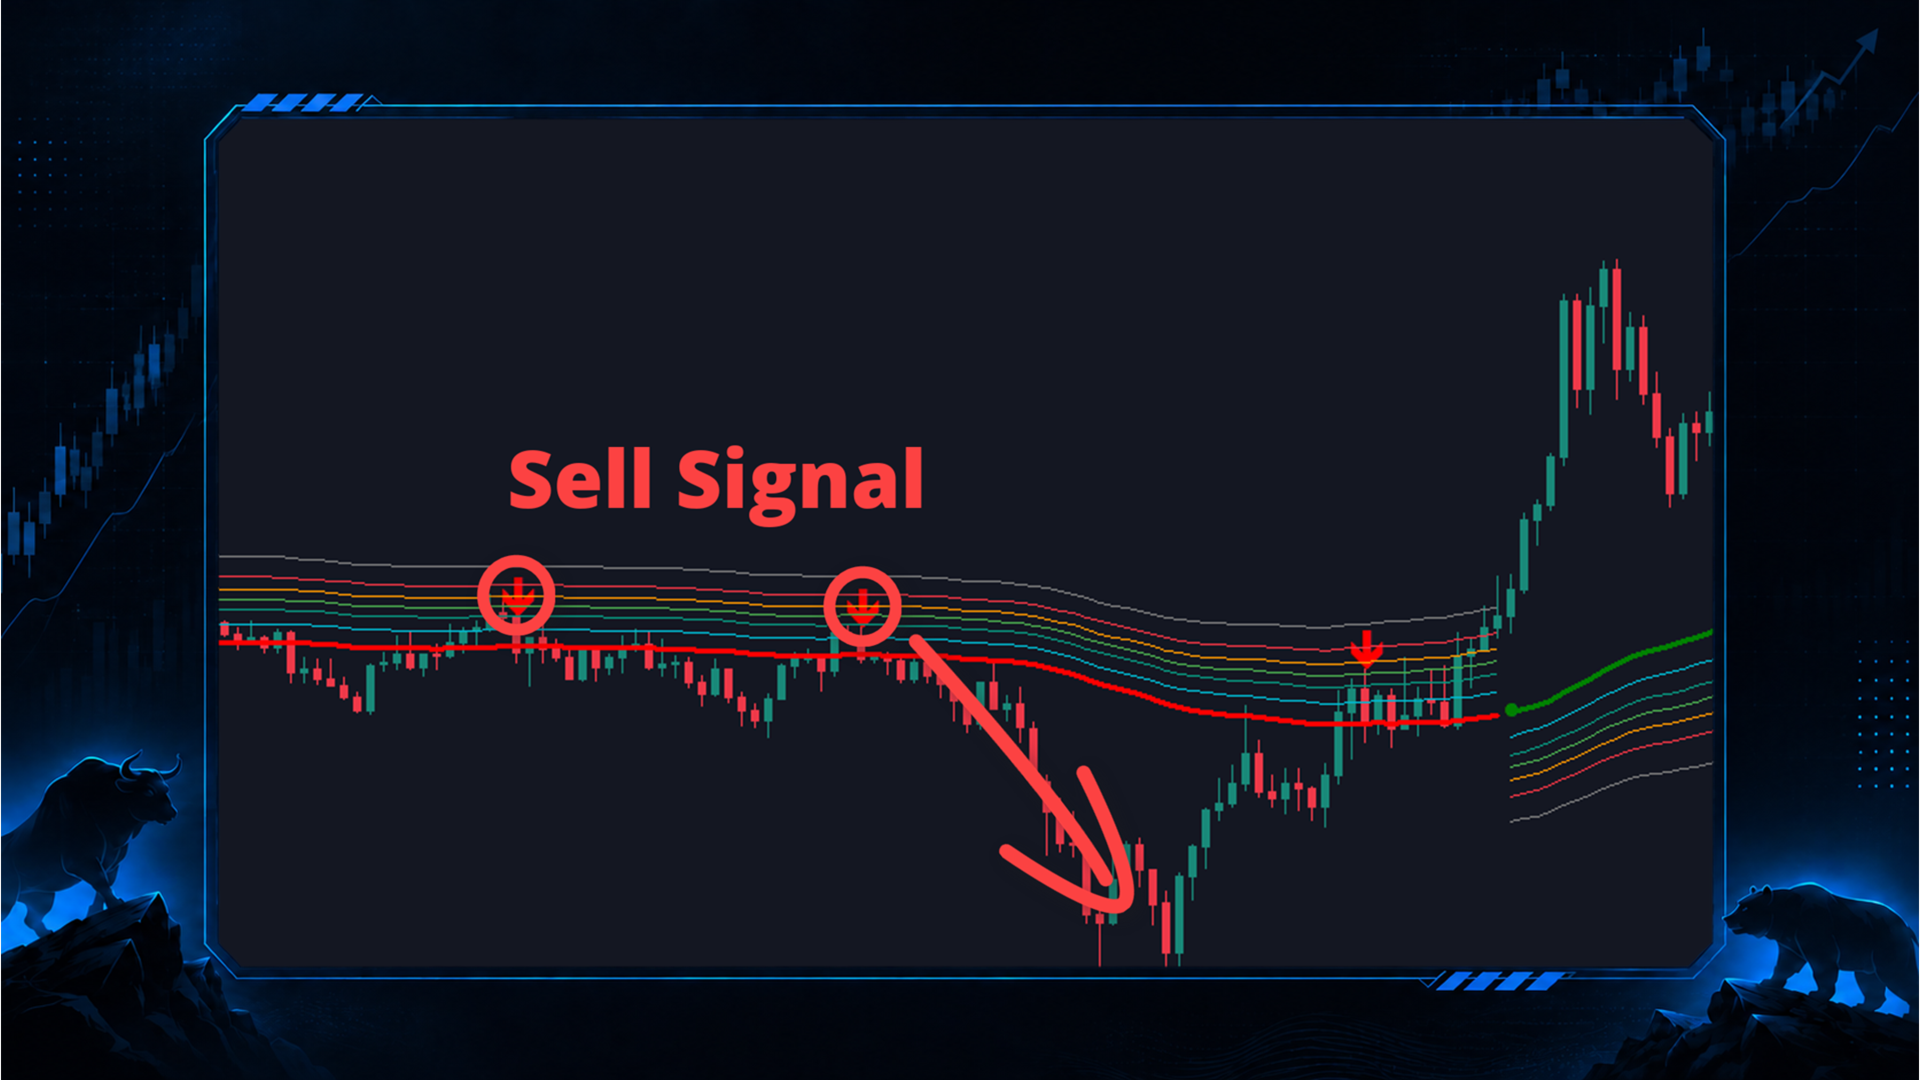
A Sell Signal is created when:
- The current trend is Bearish.
- The previous candle is also in the Bearish trend state.
- The selected Signal Confirmation Price crosses downward through one of the enabled upper Fibonacci levels.
- A Sell Arrow is displayed above the candle.
Bearish Trend → Pullback → Downward Fibonacci Cross → Sell Signal
The signal logic uses the 0.786, 0.618, 0.500, 0.382, and 0.236 levels.
Level 0.000 displays the outer band reference but is not used to generate Buy or Sell signals.
The Signal Confirmation Method is configured separately from the Trend Shift Confirmation Method. This allows the trend and the continuation signal to use different confirmation requirements.
For example:
Trend Shift Confirmation = Close
Signal Confirmation = Strong Close
With this configuration, the trend changes when the candle closes beyond an outer band, while a continuation signal requires the candle-body midpoint to cross a Fibonacci level.
This separation allows the Trend Shift calculation to remain responsive while applying a stricter condition to Fibonacci continuation signals.
10. Trend Shift marker vs. Buy/Sell signalThe Trend Shift marker and the Fibonacci continuation signal represent two different events:
Trend Shift marker: Price has crossed an outer volatility boundary and the trend state has changed.
Buy/Sell signal: Price has crossed back through a Fibonacci level while the existing trend remains active.
A Trend Shift marker can be used to identify the beginning of a new directional state.
Fibonacci signals can be used to monitor pullbacks, continuation conditions, re-entry locations, additional confirmation, or position-management events within the existing trend.
11. The complete logic at a glance12. Practical ways to use the indicatorDuring a Bullish trend:
Price breaks above Upper Band → Bullish Trend Shift → Midline turns green → Fibonacci levels appear below the Midline → Price pulls back → Price crosses upward through an enabled Fibonacci level → Buy Signal
During a Bearish trend:
Price breaks below Lower Band → Bearish Trend Shift → Midline turns red → Fibonacci levels appear above the Midline → Price pulls back → Price crosses downward through an enabled Fibonacci level → Sell Signal
13. Example of a basic trading process12.1. Trend Filter
Use the Midline color to identify the current trend state:
Green Midline → Bullish trend state
Red Midline → Bearish trend state12.2. Trend Shift Detection
Use the Trend Shift markers to identify when price has crossed an outer volatility boundary and the directional state has changed.
The Trend Shift can be used as an additional condition instead of being treated as an automatic entry.
12.3. Pullback Monitoring
Observe how far price moves into the Fibonacci structure while the existing trend remains active.
The Fibonacci level reached by price provides information about the depth of the pullback relative to the Midline and the current volatility structure.
12.4. Continuation Signal
Wait for price to cross back through an enabled Fibonacci level in the direction of the active trend.
The Buy or Sell arrow identifies that continuation condition. The signal can then be reviewed together with market structure and the user's other trading conditions.
12.5. Re-entry or Position Management
When the broader trend remains unchanged, a new Fibonacci signal after a pullback may be used as a candidate for re-entry, adding exposure, partial exit management, or another action defined by the user's trading plan.
A basic trend-continuation process can be organized as follows:
- Identify the current trend from the Midline color.
- Wait for price to pull back into the Fibonacci structure.
- Observe which Fibonacci level price reaches.
- Wait for a Buy or Sell continuation arrow in the direction of the active trend.
- Review nearby market structure before making a trading decision.
- Define the Stop Loss, exit condition, and position size according to your own trading plan.
Example of a Bullish sequence:
Price breaks above the Upper Band.
The indicator changes to Bullish.
The Midline turns green.
Fibonacci levels appear between the Lower Band and the Midline.
Price pulls back into the Fibonacci structure.
Price crosses upward through an enabled Fibonacci level.
A Buy continuation signal is displayed.
The Bearish sequence works in the opposite direction.
14. Adjusting signal sensitivityFor a more responsive indicator:
- Use shorter Midline and Volatility lengths.
- Reduce Band Width.
- Use Wick or Close confirmation.
- Enable Fibonacci levels closer to the Midline.
For more selective conditions:
- Use longer Midline and Volatility lengths.
- Increase Band Width.
- Use Close or Strong Close confirmation.
- Disable Fibonacci levels that are not part of the trading method.
- Evaluate signals after the candle has closed.
Wick confirmation may generate a condition while the current candle is still developing. Users who require closed-candle confirmation can use Close or Strong Close and evaluate completed candles.
15. AlertsThe indicator provides two main alert conditions:
15.1. Trend Shift Alert
Notifies the user when a Bullish or Bearish Trend Shift has been detected.
15.2. Signal Alert
Notifies the user when a Buy or Sell Fibonacci continuation signal appears.
Available alert channels:
- Alert Message
- Push Notification
- Send Email
- Sound
Alerts can be enabled for the current chart symbol or for all symbols monitored by the Scanner.
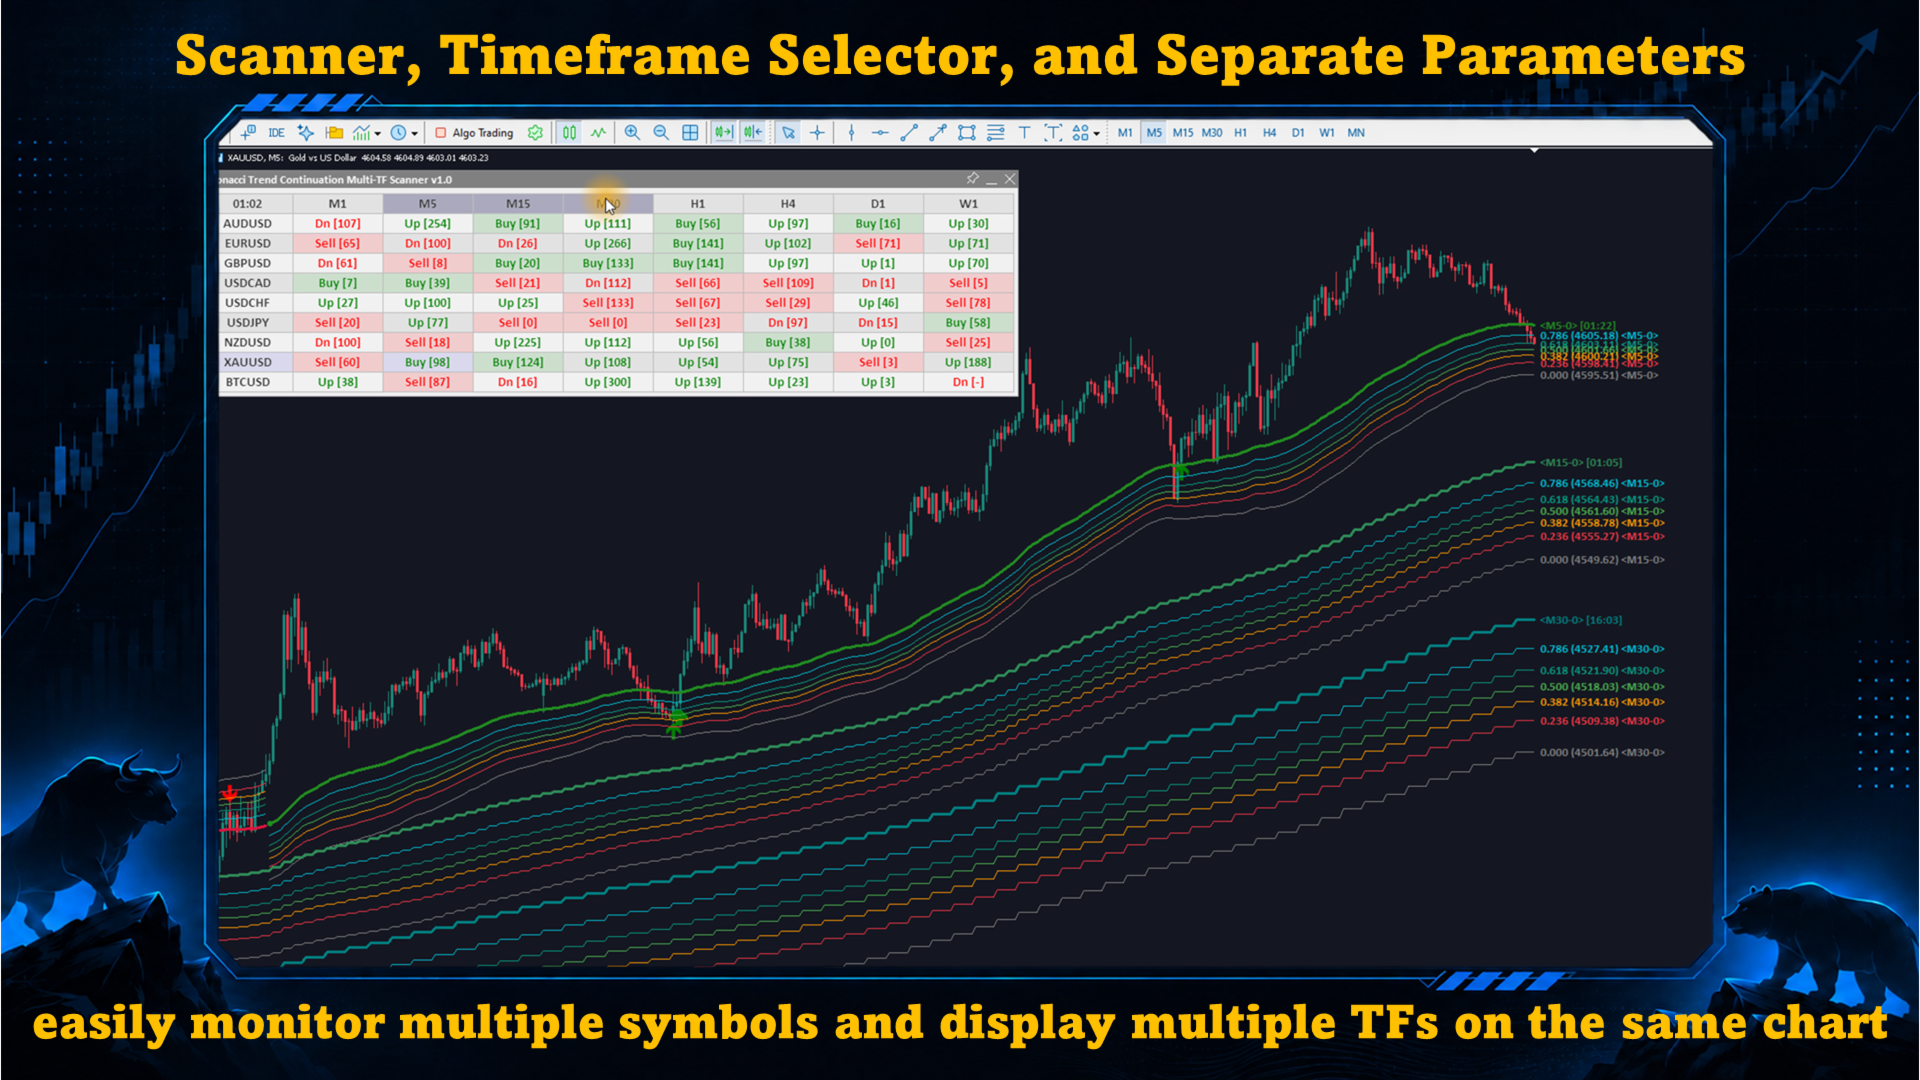
16. Multi-Timeframe analysisThe indicator can display data from a selected timeframe independently of the chart timeframe. The Timeframe Selector can also display several selected timeframes simultaneously on the same chart.
A simple Multi-Timeframe structure is:
Higher Timeframe → trend context
Lower Timeframe → pullback and continuation signal
For example, H1 can be used to identify the broader trend while M15 is used to monitor Fibonacci pullbacks and continuation signals.
Separate Parameters allow each timeframe to use its own calculation values, Fibonacci settings, colors, alerts, and display options.
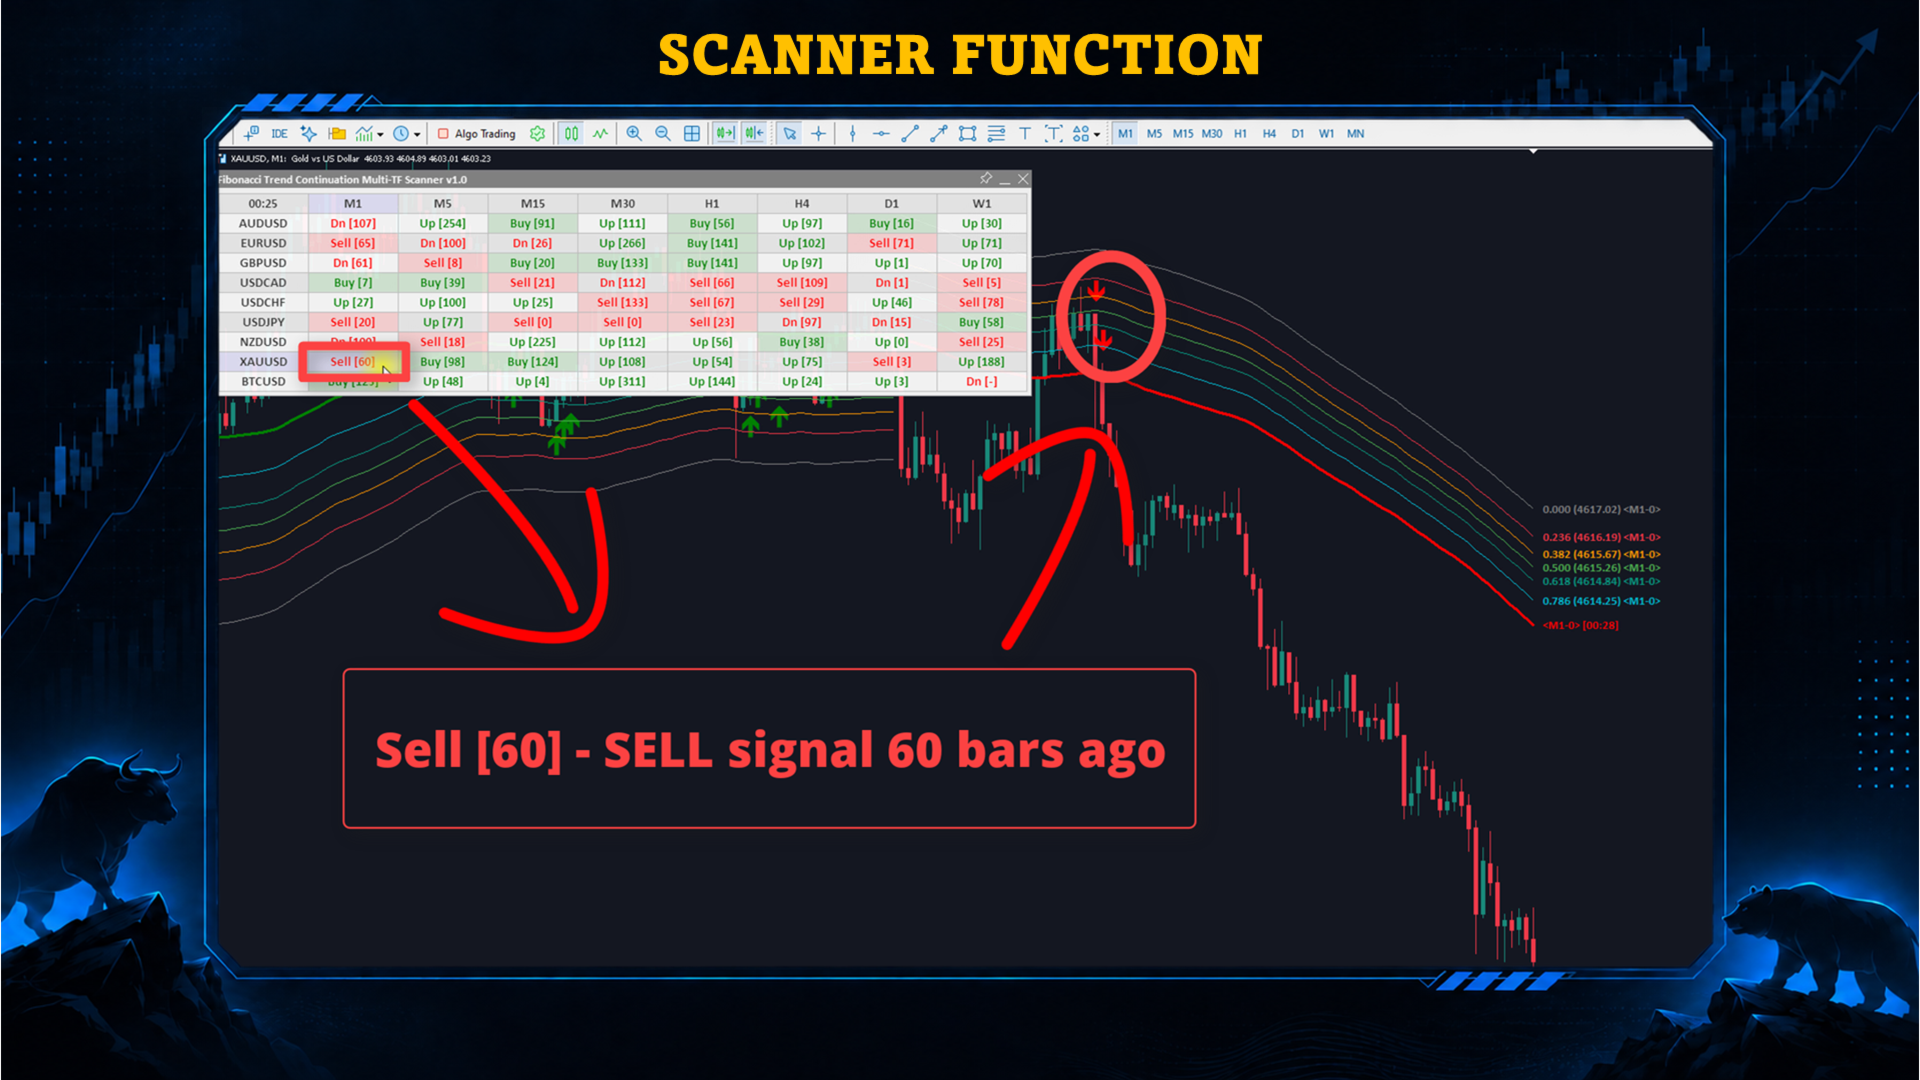
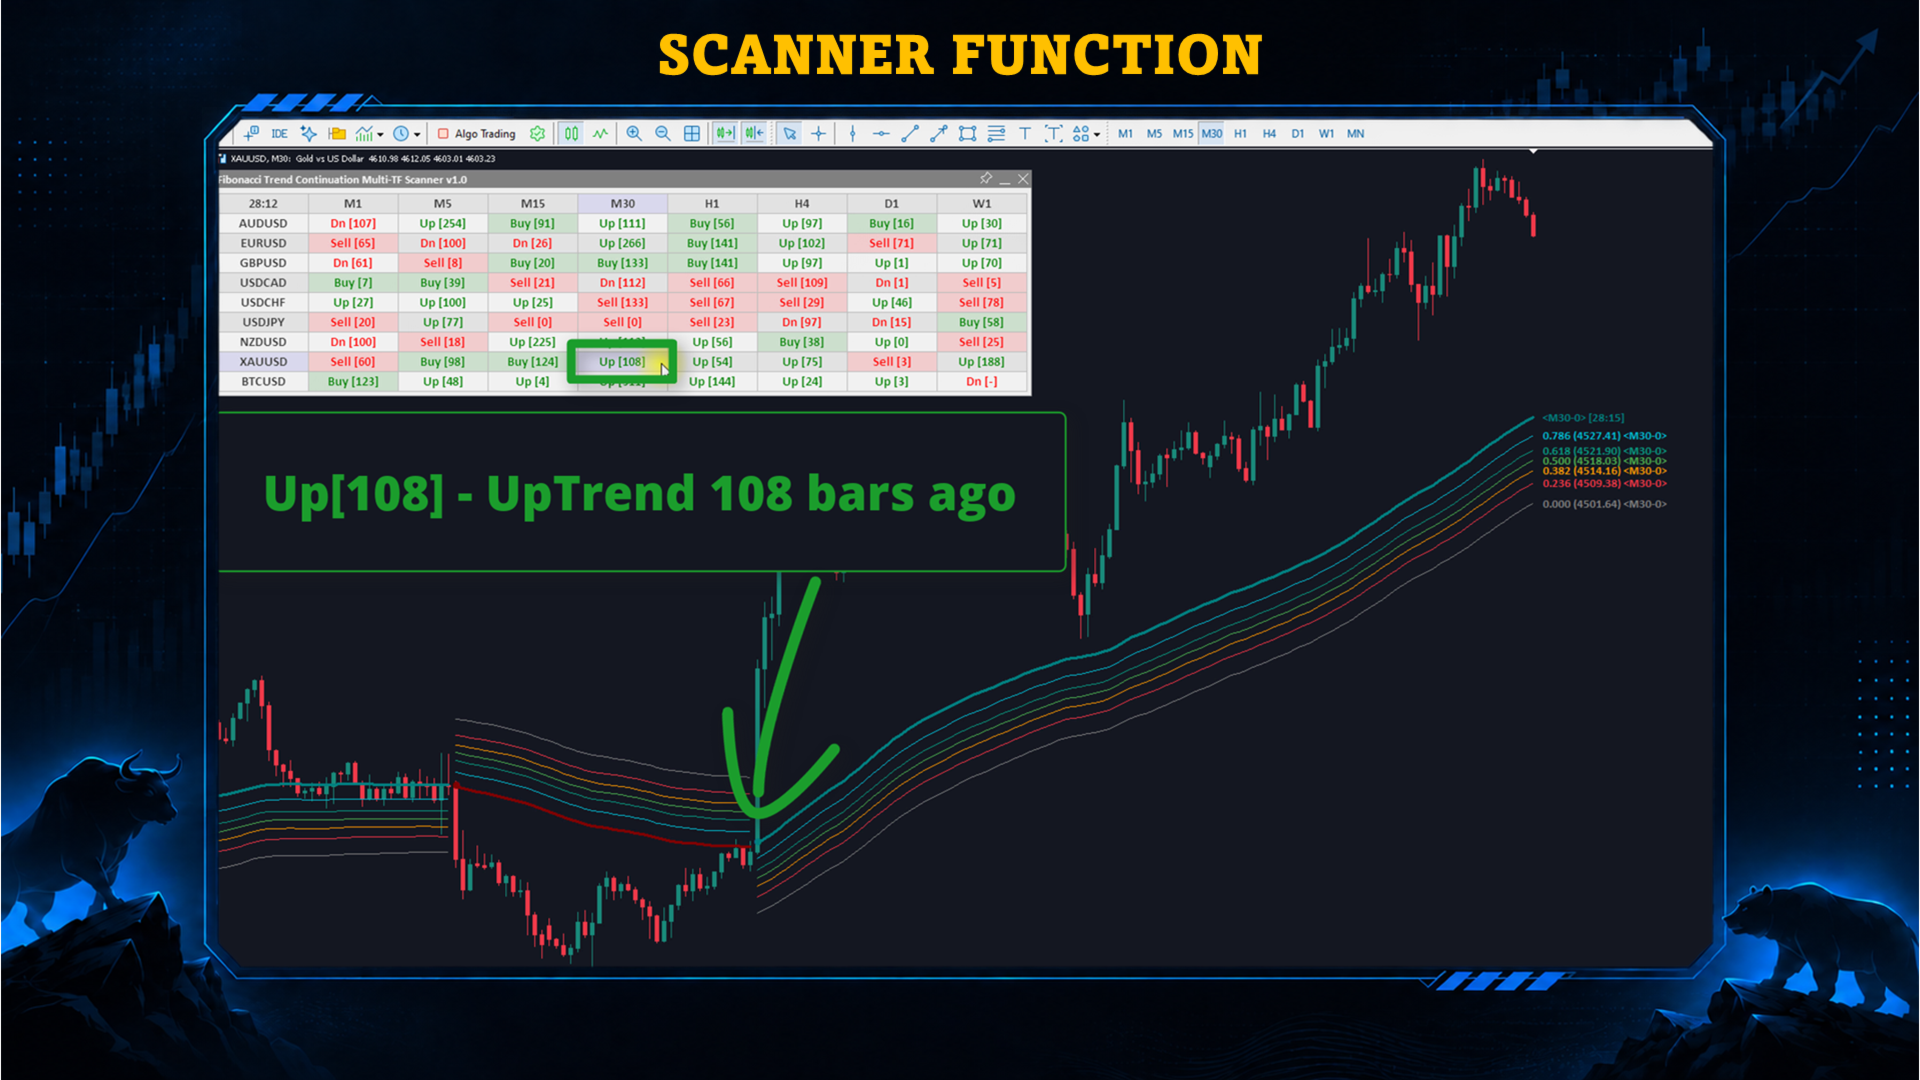
17. Multi-Symbol and Multi-Timeframe ScannerThe Scanner monitors selected symbols and timeframes directly from one chart. It can be used to compare trend states, locate recent signals, observe timeframe alignment, and select symbols for further chart analysis.
Symbol sources include:
- Current symbol only
- Custom symbol list
- Market Watch symbols
Clicking a Scanner cell can change the current chart to the corresponding symbol and timeframe.
The indicator can be:
- Always displayed on the chart
- Hidden while the Scanner and alerts continue operating
- Shown or hidden using a hotkey
- Shown or hidden using a Scanner button
- Displayed through the Timeframe Selector
The Scanner supports up to 10 timeframes.
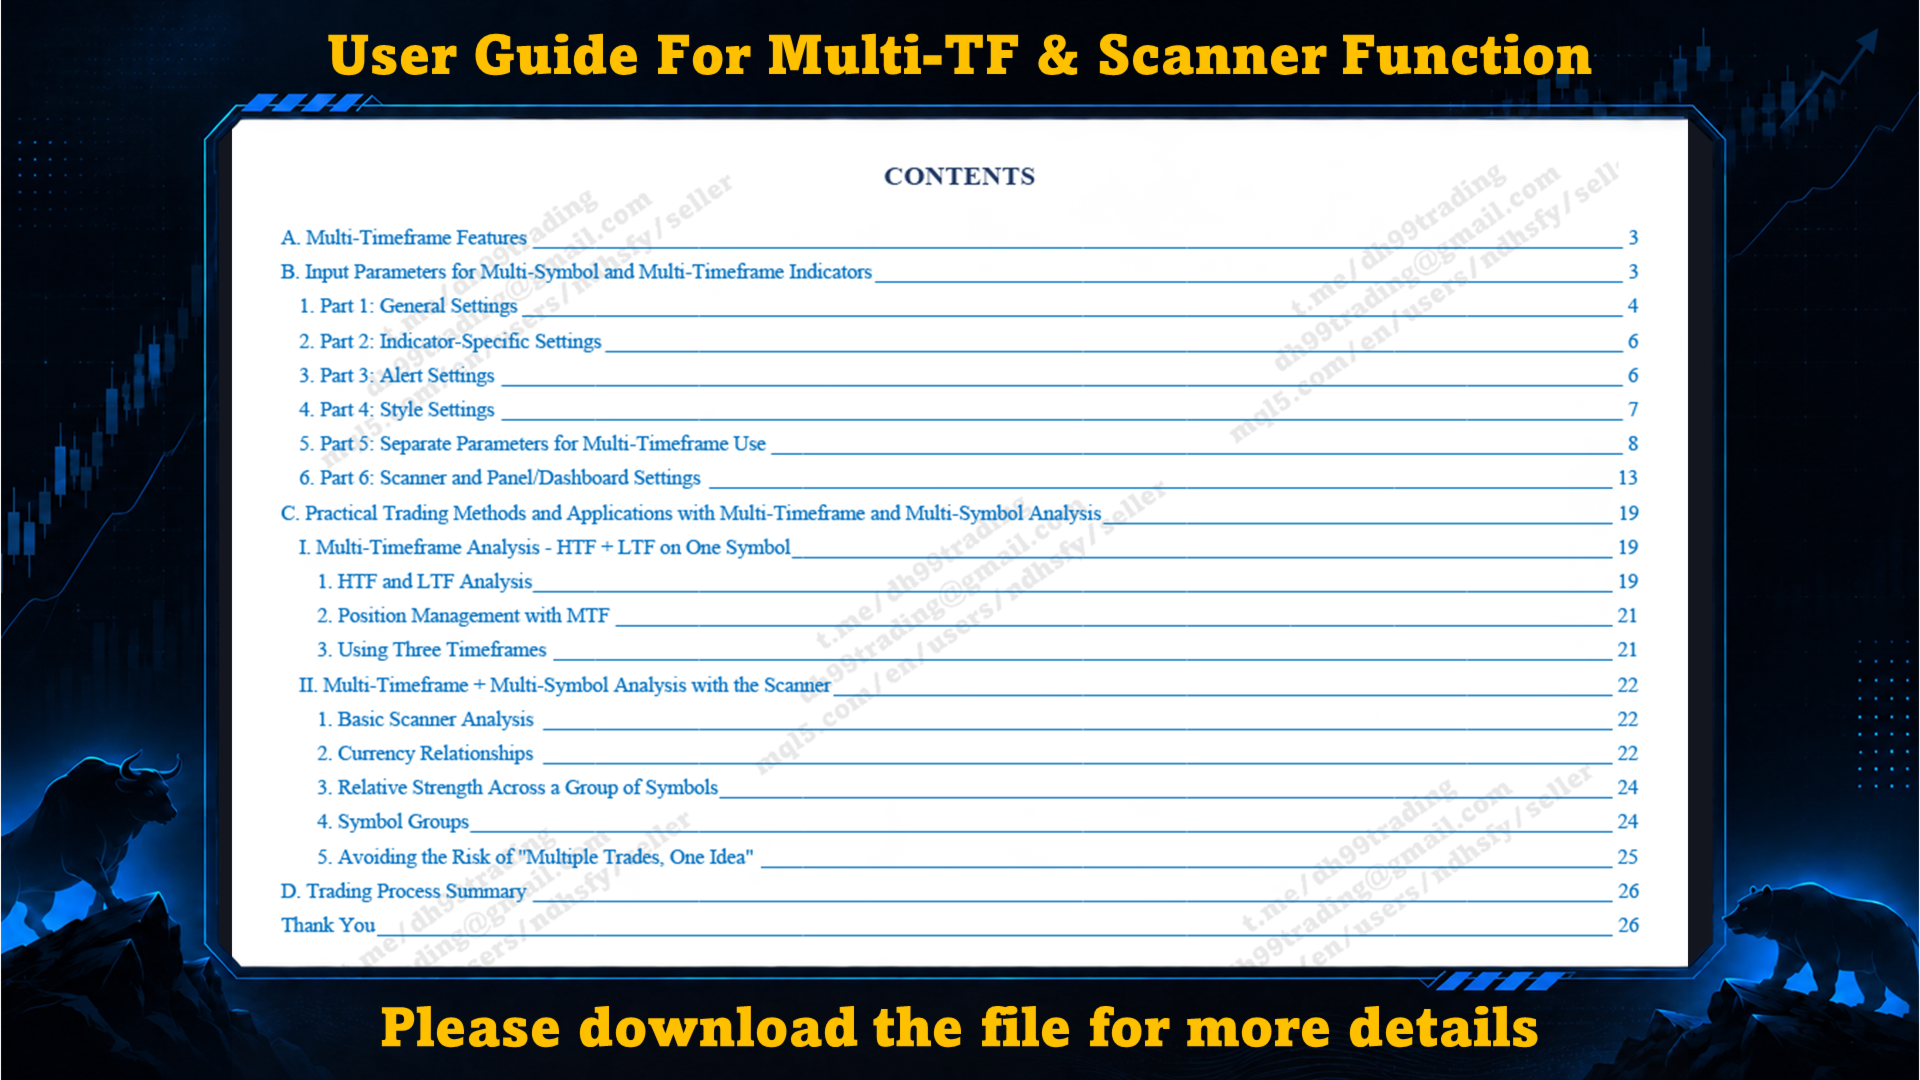
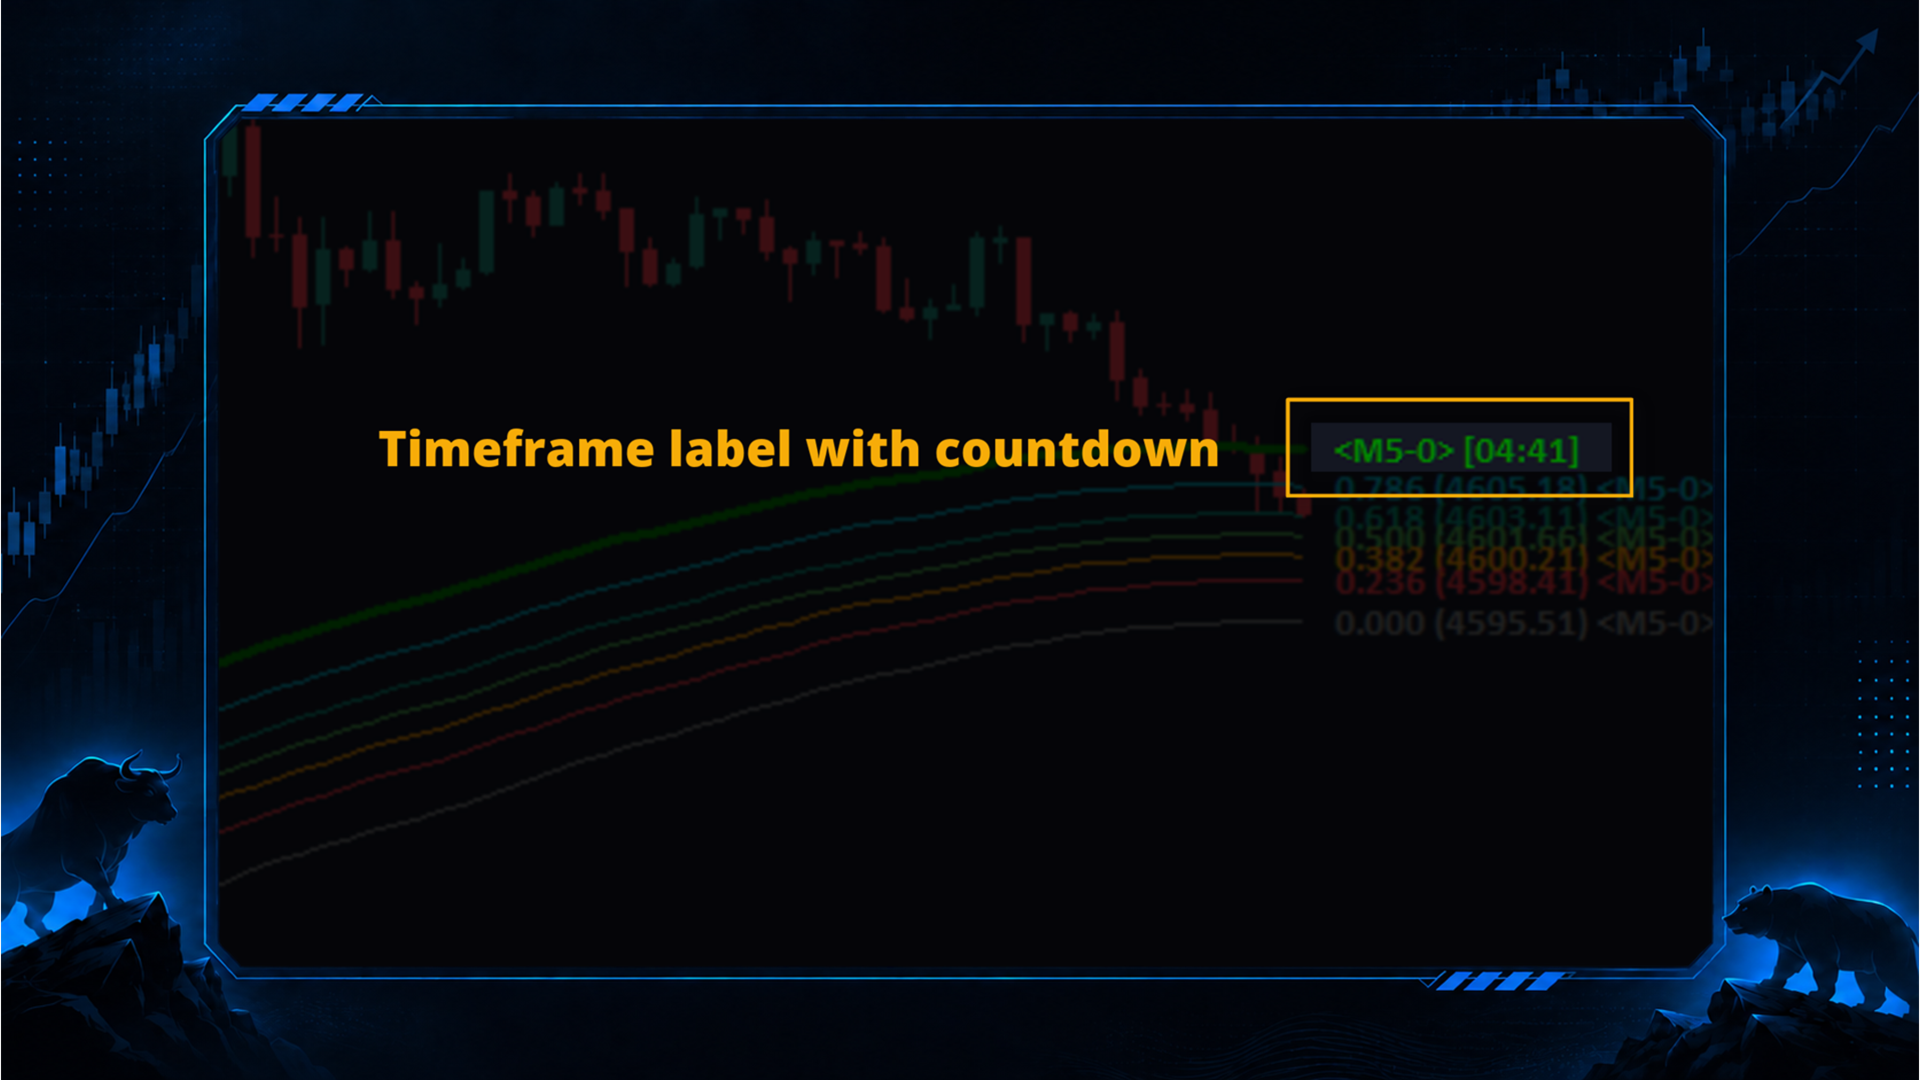
For detailed instructions about Multi-Timeframe display, the Scanner, Separate Parameters, Timeframe Selector, Scanner Alerts, Hotkeys, Timeframe Labels, and related controls, please use the Multi-Timeframe & Multi-Symbol Guide linked at the beginning of this page.
18. Main calculation settings- Volatility MA Method: selects the moving-average method used for the final volatility smoothing.
- Delta High-Low MA Method: selects the moving-average method used to smooth the candle High-Low range.
- Delta High-Low MA Period: controls the first smoothing stage of the candle range.
- Volatility Length: controls the final smoothing period used for the volatility value.
- Midline MA Method: selects the moving-average method used for the Midline.
- Midline Applied Price: selects the price source used by the Midline.
- Midline Length: controls the response speed and smoothness of the Midline.
- Band Width: controls the distance between the Midline and the outer volatility bands.
- Trend Shift Confirmation Method: determines how a Bullish or Bearish Trend Shift is confirmed.
- Signal Confirmation Method: determines how price must cross a Fibonacci level to create a Buy or Sell signal.
The five signal Fibonacci values can be changed independently:
- Fibonacci 0.786 Value
- Fibonacci 0.618 Value
- Fibonacci 0.500 Value
- Fibonacci 0.382 Value
- Fibonacci 0.236 Value
Each Fibonacci line also includes separate display settings for:
- Show or hide
- Line style
- Line width
- Line color
- Label visibility
Level 0.000 includes the same visual settings but is used as the outer-band reference rather than a Buy or Sell signal level.
20. Visual settingsThe main chart elements can be customized independently:
- Buy Signal display, arrow code, color, and width
- Sell Signal display, arrow code, color, and width
- Uptrend Line color, style, and width
- Downtrend Line color, style, and width
- Fibonacci line color, style, width, and label visibility
- Timeframe label visibility, size, and position
- Current-candle countdown
- Bullish and Bearish trend-state detection
- Moving-average Midline with selectable price source
- Two-stage volatility smoothing
- Dynamic Upper and Lower volatility bands
- Configurable Trend Shift confirmation
- Bullish and Bearish Trend Shift markers
- Dynamic Fibonacci pullback structure
- Custom Fibonacci values
- Buy and Sell Fibonacci continuation signals
- Independent Signal Confirmation Method
- Trend Shift and Signal alerts
- Message, Push, Email, and Sound alerts
- Customizable lines, labels, and signal arrows
- Multi-Timeframe display
- Timeframe Selector
- Separate parameters for each timeframe
- Multi-Symbol and Multi-Timeframe Scanner
- Scanner alerts for monitored symbols
- Hotkey and button display modes
- The indicator is an analysis tool and does not place or manage trades.
- Current-candle values can change while the candle is forming.
- Linear Interpolation changes only the visual appearance of higher-timeframe data displayed on lower timeframes. It does not change the original higher-timeframe calculation or signal.
- Use a unique ID when adding multiple instances of the indicator to the same chart.
- Maximum Bars to Process can be reduced to improve performance when monitoring many symbols and timeframes.
- More symbols, timeframes, displayed lines, and alerts require additional terminal resources.
- Signals should be combined with independent analysis and appropriate risk management.
At its core, the indicator follows a clear sequence:
Price breaks the outer band → Trend Shift
Trend state determines the Midline color and Fibonacci position
Price pulls back into the Fibonacci structure
Price crosses back in the trend direction → Buy or Sell continuation signal
From this foundation, the indicator can be used as a trend filter, for monitoring direction changes, for evaluating pullback depth, for locating continuation conditions, or as one component of a broader Multi-Timeframe trading approach.




























































趋势指标,结合其他的指标很不错!