Index Cadence TechnoTrader
- Experts
-
Nice Trader
 📊 Systematic & Algorithmic Trader | MT5 Expert Advisors & Tools | Live Signals | Since 2011
I build and run fully automated strategies as Expert Advisors. Disciplined risk, diversification, long-term consistency.
Trading since 2011 · Algorithmic since 2018 · Live signals on MQL5 since 2024 - Version: 1.2
- Updated: 3 September 2026
- Activations: 10
LIVE SIGNAL - TechnoTrader EA Showcase
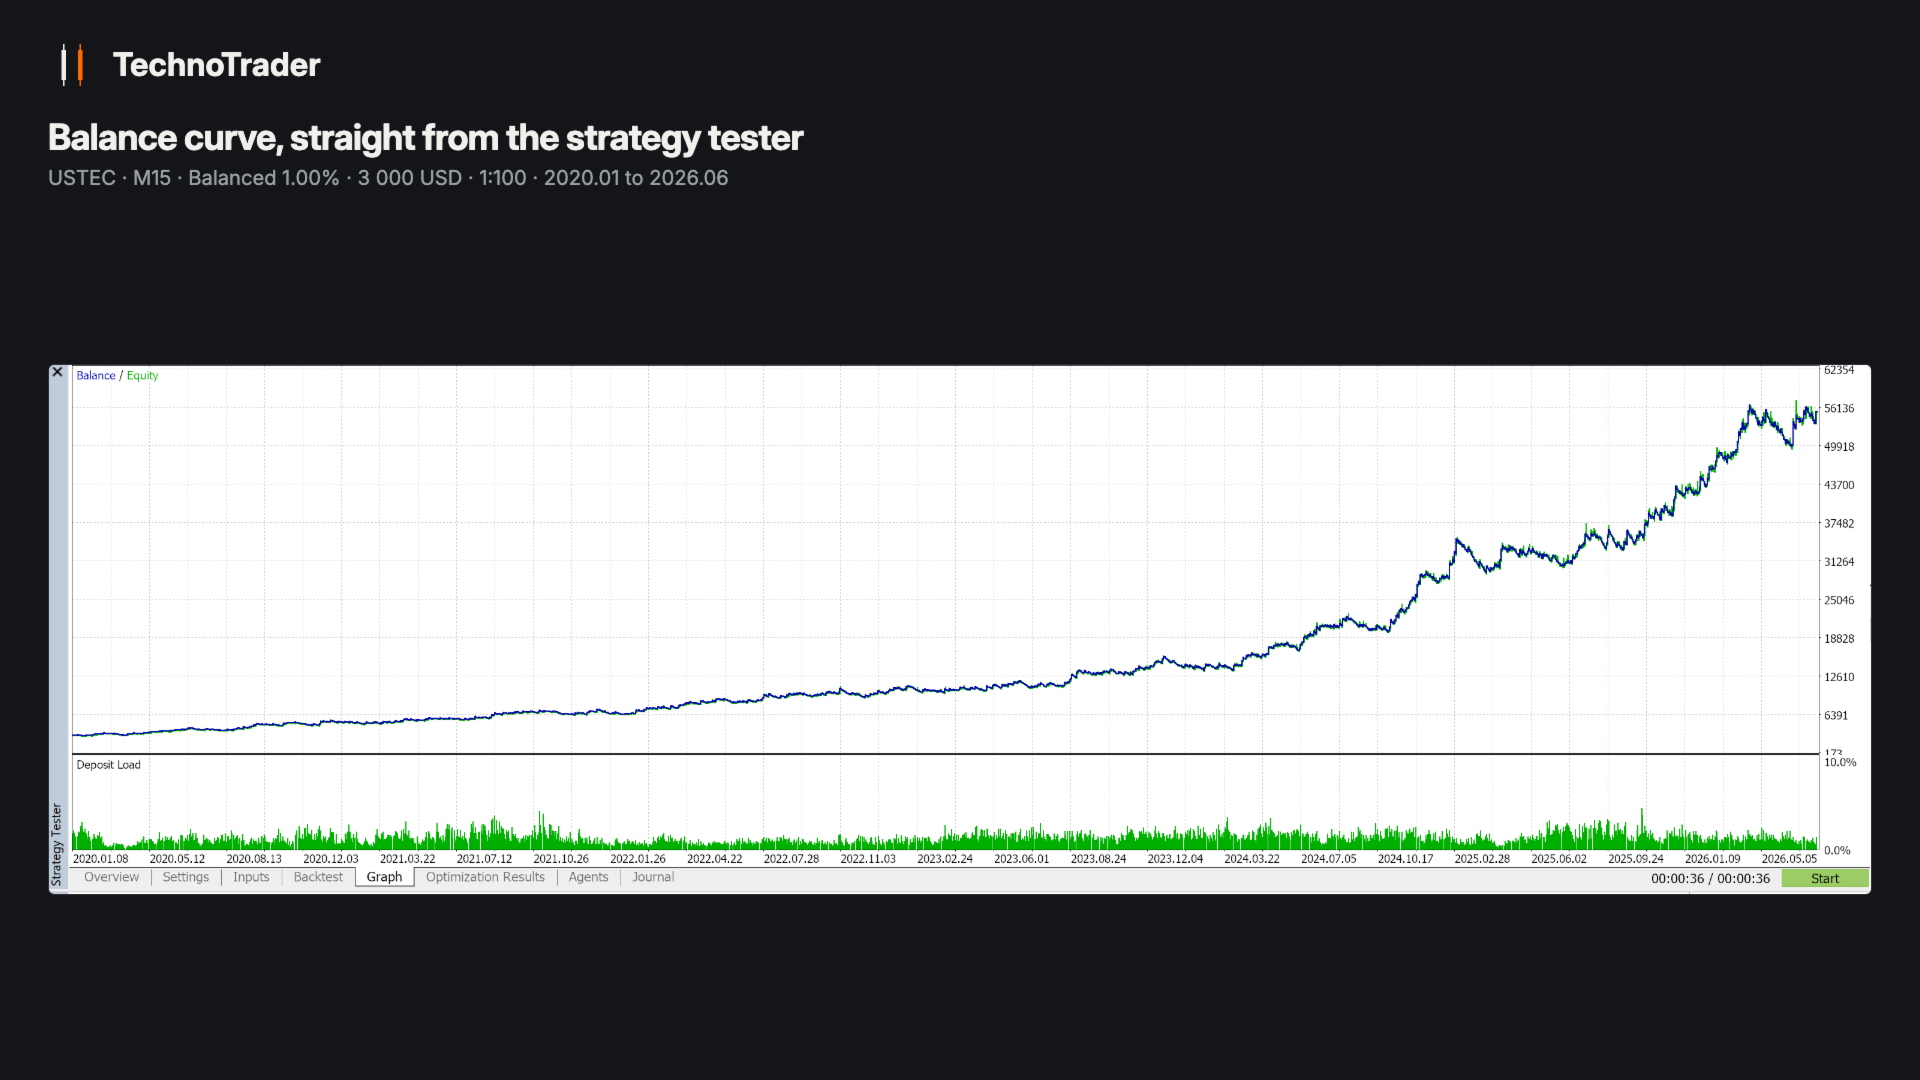
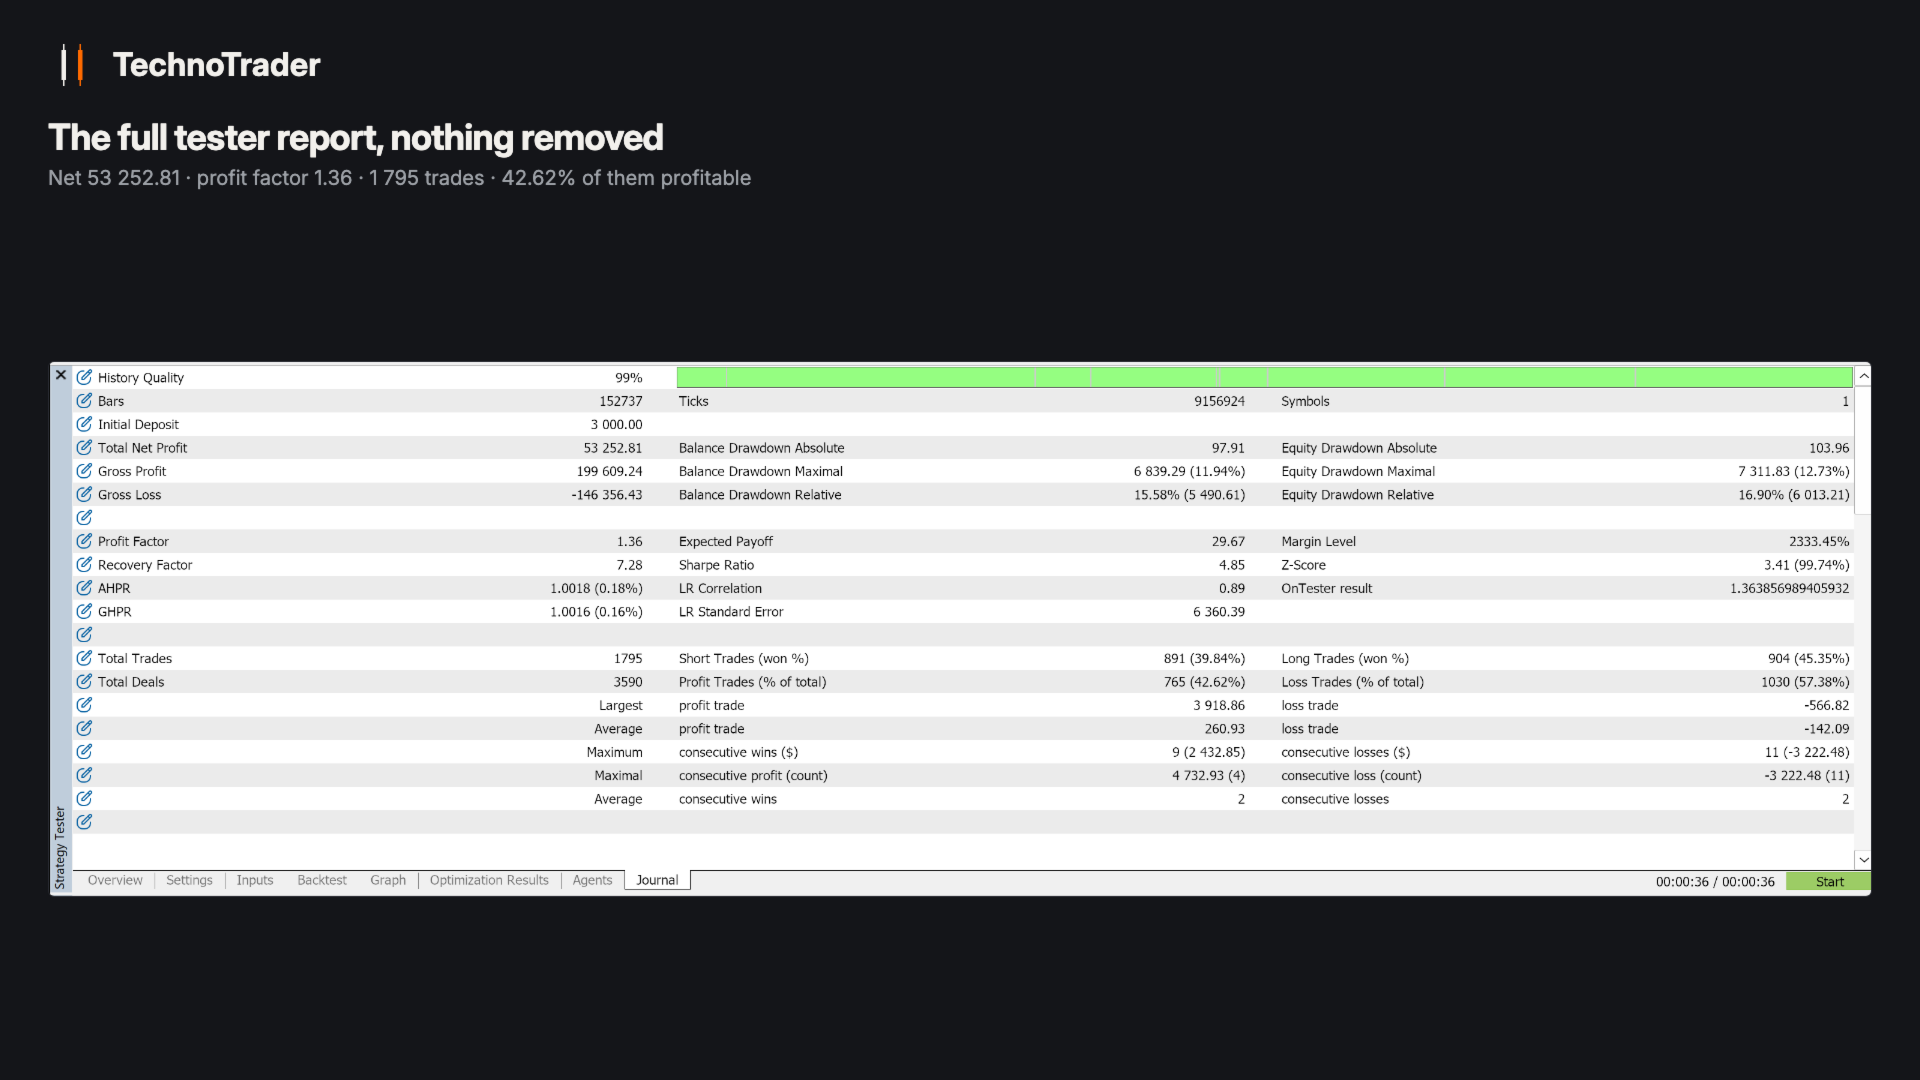
Index Cadence trades one instrument, the US tech index CFD, intraday and flat before the close: about 275 trades a year, 57.2% a year at a 16.9% worst equity drawdown on the default package, measured 2020 to 2026 on a 3000 USD account. This is not a holy grail and we will not sell it as one. It is one measured edge, executed with discipline, on prices that have already happened.
That signal is a real account running this EA at factory defaults, alongside two other products from the same line: Gold Tempo on gold and Bitcoin Interval on Bitcoin. Nothing on it is tuned. Three strategies share one small account, so its curve belongs to the three together, and its drawdown can run deeper than the figures on this page.
Around the US cash open the EA measures how far this market normally travels by each time of day, using the last 14 sessions, and draws a band from that. A 15-minute candle closing outside the band is the signal: above it buys, below it sells. Every position carries a hard broker-side stop, and everything is closed before the end of the trading day. No overnight, no weekend.
What the backtest shows (2020.01 - 2026.06, M15, leverage 1:100)
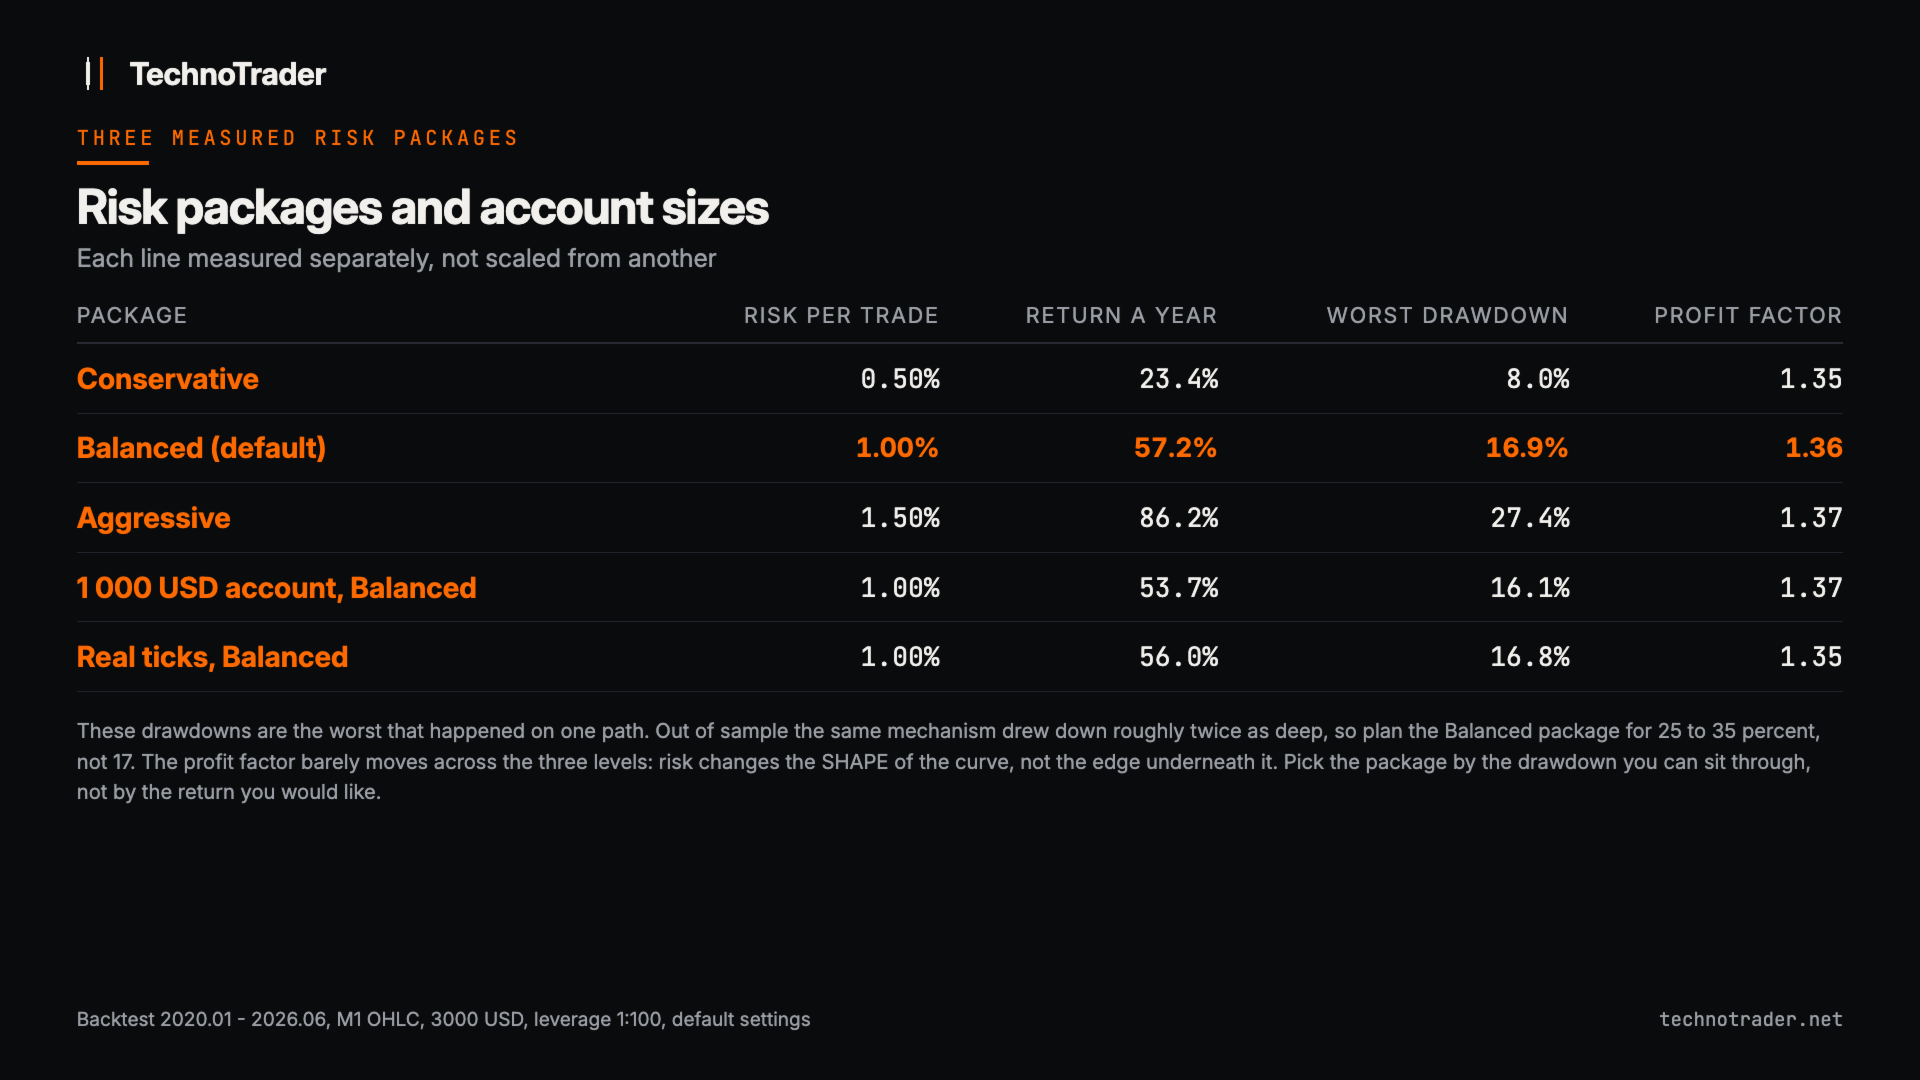
Three risk packages on a 3000 USD account, each measured separately, not scaled from the others:
| Package | Risk per trade | Average per year | Worst equity drawdown | Profit factor |
|---|---|---|---|---|
| Conservative | 0.50% | about 23% | 7.96% | 1.35 |
| Balanced (default) | 1.00% | about 57% | 16.9% | 1.36 |
| Aggressive | 1.50% | about 86% | 27.38% | 1.37 |
Those drawdowns are the worst that happened on one path. Out of sample the same mechanism drew down roughly twice as deep, so plan Balanced for 25 to 35 percent, not 17. A Fixed lot package also exists: every trade opens with the lot you set, no risk-based sizing, so it has no row here.
| Account, Balanced | Average per year | Equity drawdown | Profit factor |
|---|---|---|---|
| 3000 USD | 57.2% | 16.9% | 1.36 |
| 1000 USD | 53.7% | 16.1% | 1.37 |
| 500 USD | 47.3% | 23.0% | 1.37, see the minimum-lot note below |
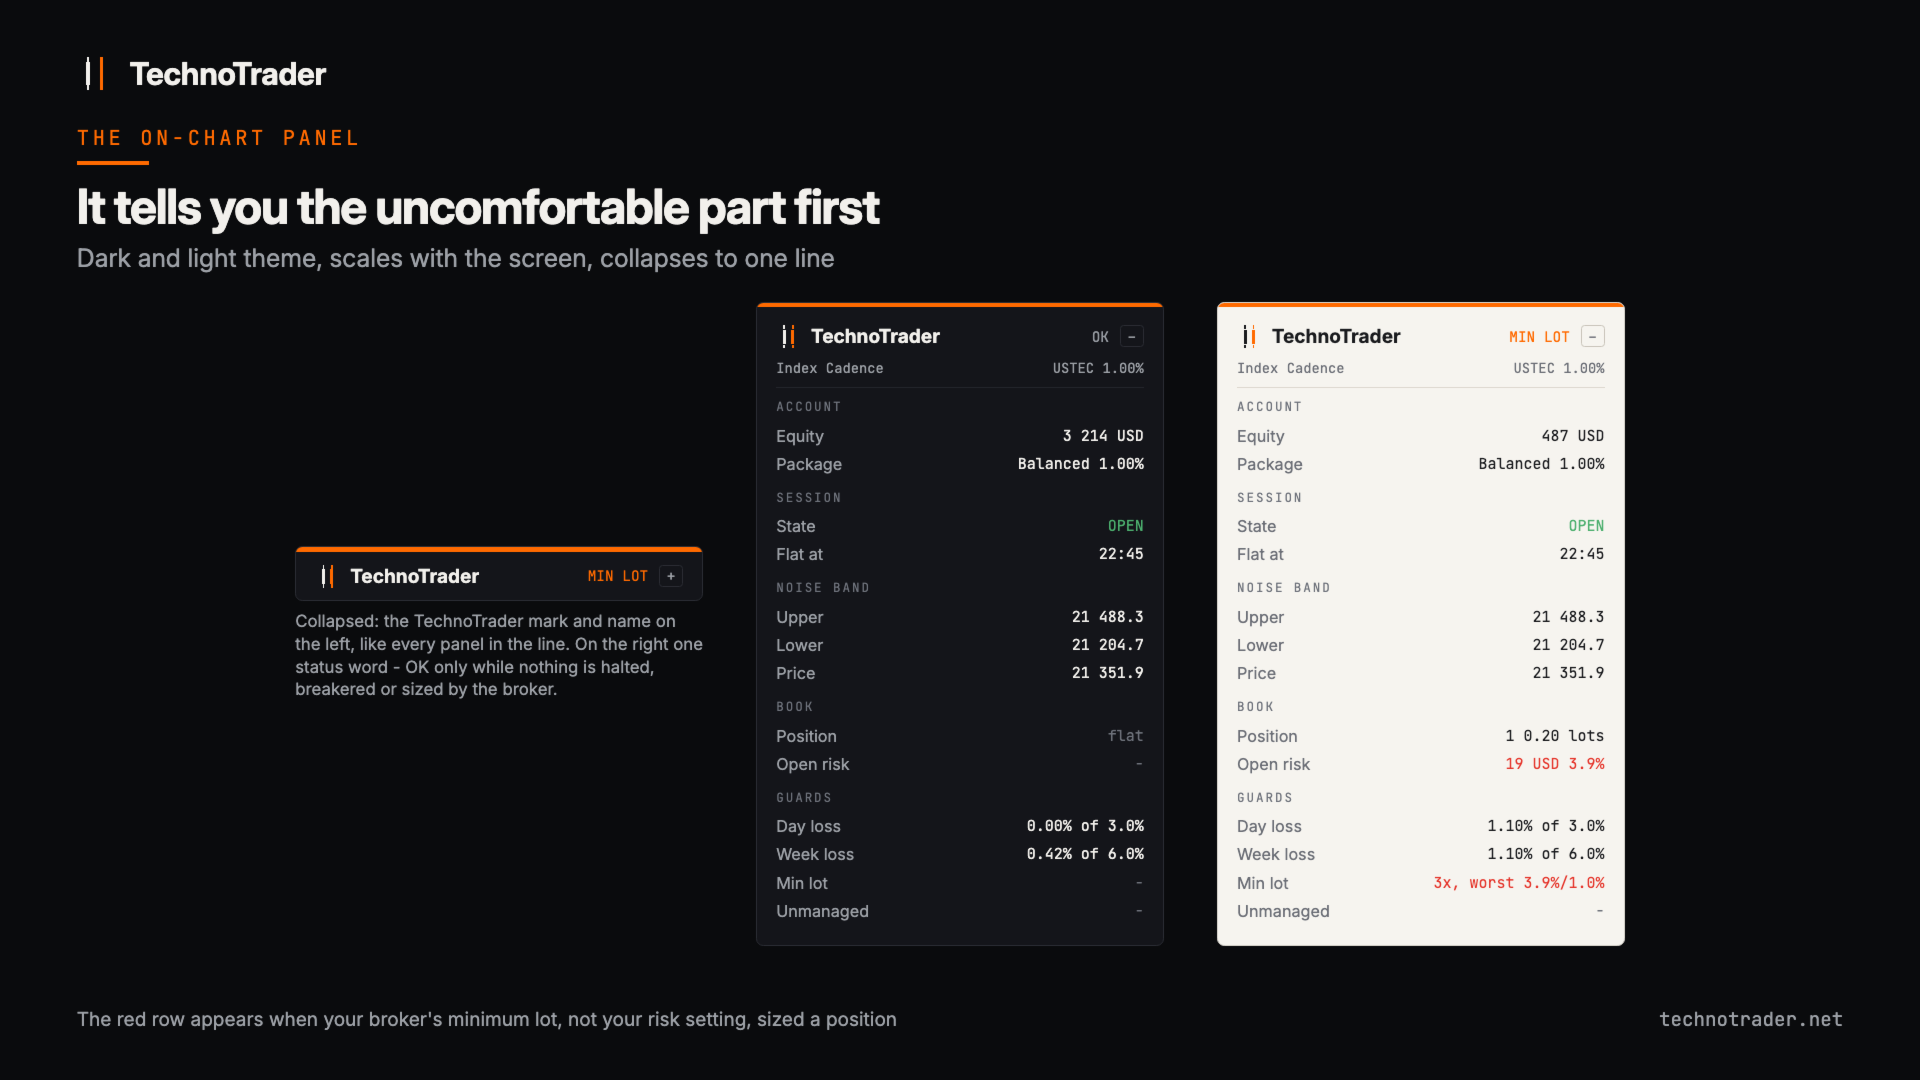
Below about 2000 USD the broker's minimum lot can no longer size a trade the way your risk setting asks, and not at random: it is the widest-stop trades, from the most volatile weeks. The EA takes them anyway, at the minimum lot, and says so every time - while it runs, in the summary, and as a red row on the panel. Measured on 500 USD: the same return as skipping them, on 1779 trades instead of 1562, drawdown 23.0% instead of 15.7%, worst single position risking 3.9% against a 1.0% setting. And the index has roughly doubled since 2020, so at today's price a 500 USD account is at the minimum lot almost every trade, not one in eight - that row is carried by the early years. An input switches to skipping instead.
On real tick data instead of 1-minute bars: 56.0% per year, drawdown 16.8%, profit factor 1.35, identical trade count. Intraday systems usually lose a lot to tick-level modelling; this one loses under one percentage point, because entries are on closed 15-minute candles and stops are wide relative to the spread.
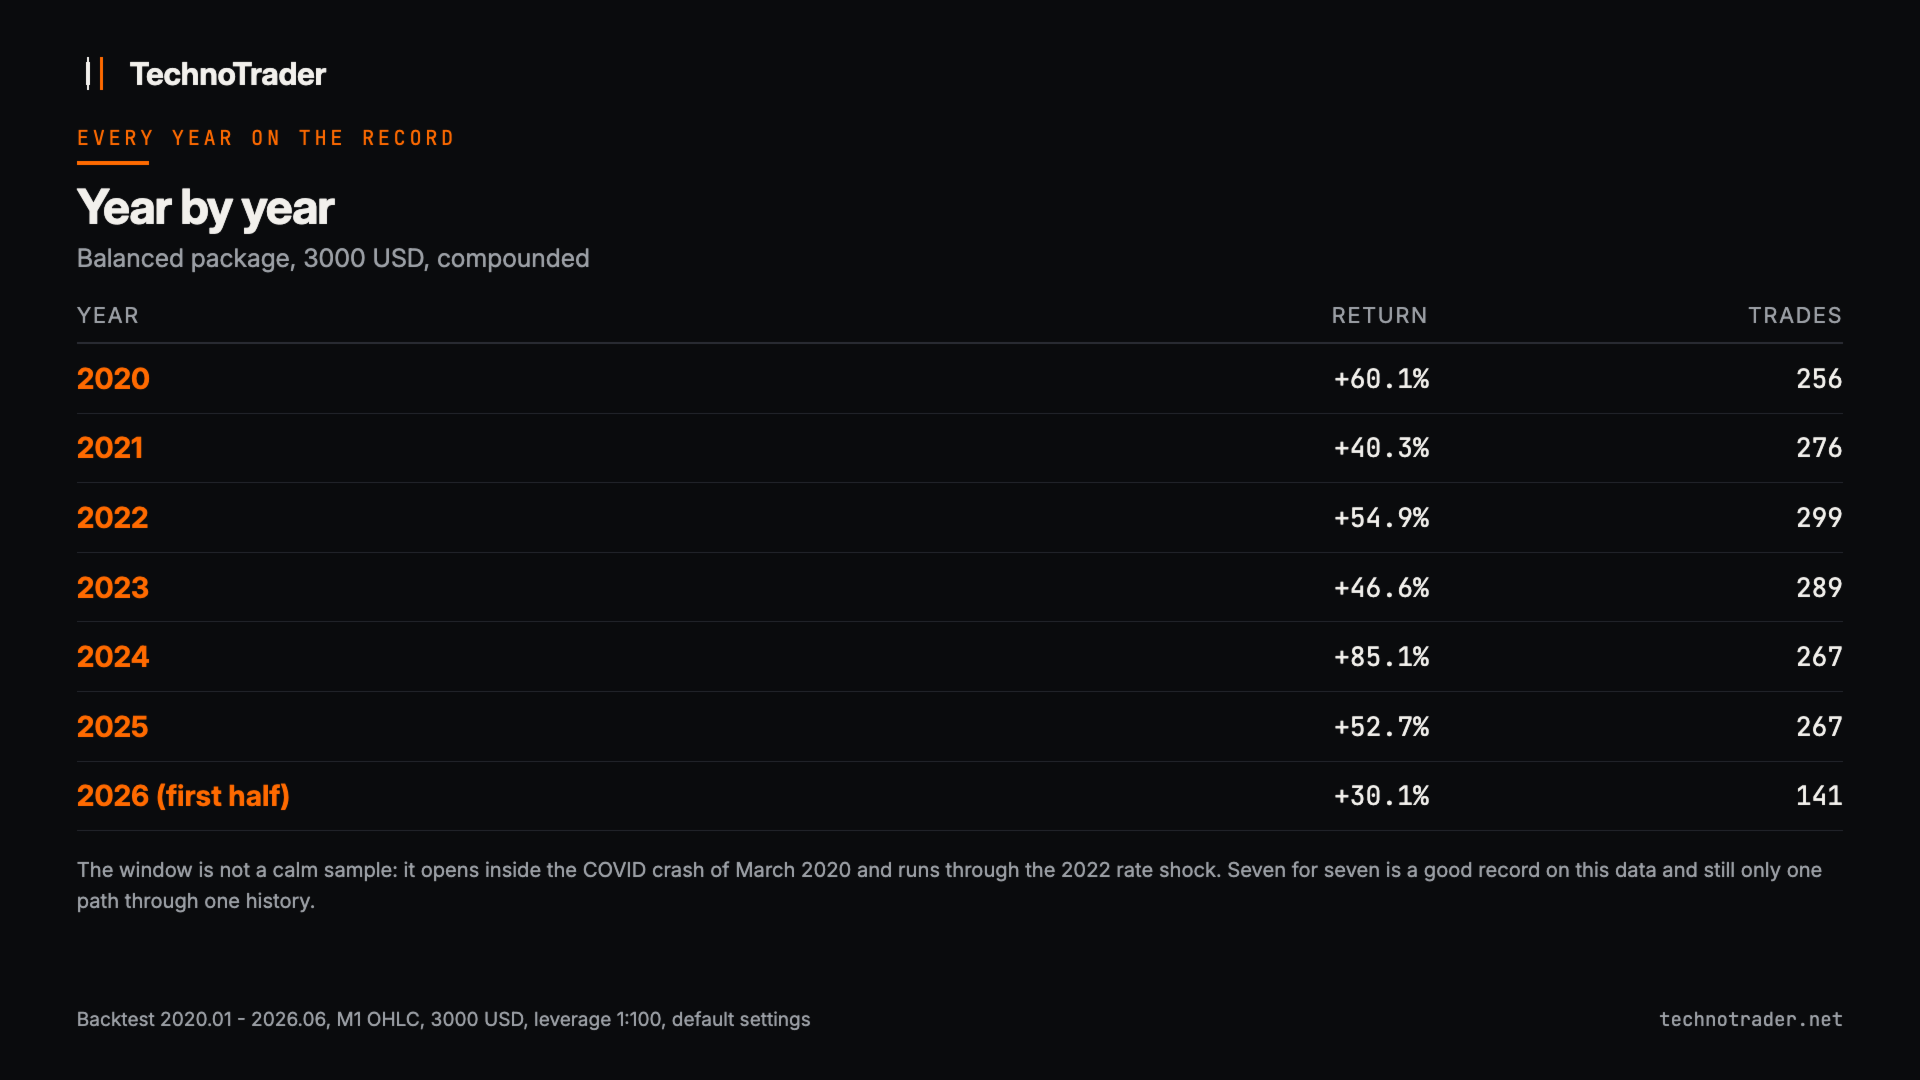
Year by year
| Calendar year | Return |
|---|---|
| 2020 | +60% |
| 2021 | +40% |
| 2022 | +55% |
| 2023 | +47% |
| 2024 | +85% |
| 2025 | +53% |
| 2026, first half | +30% |
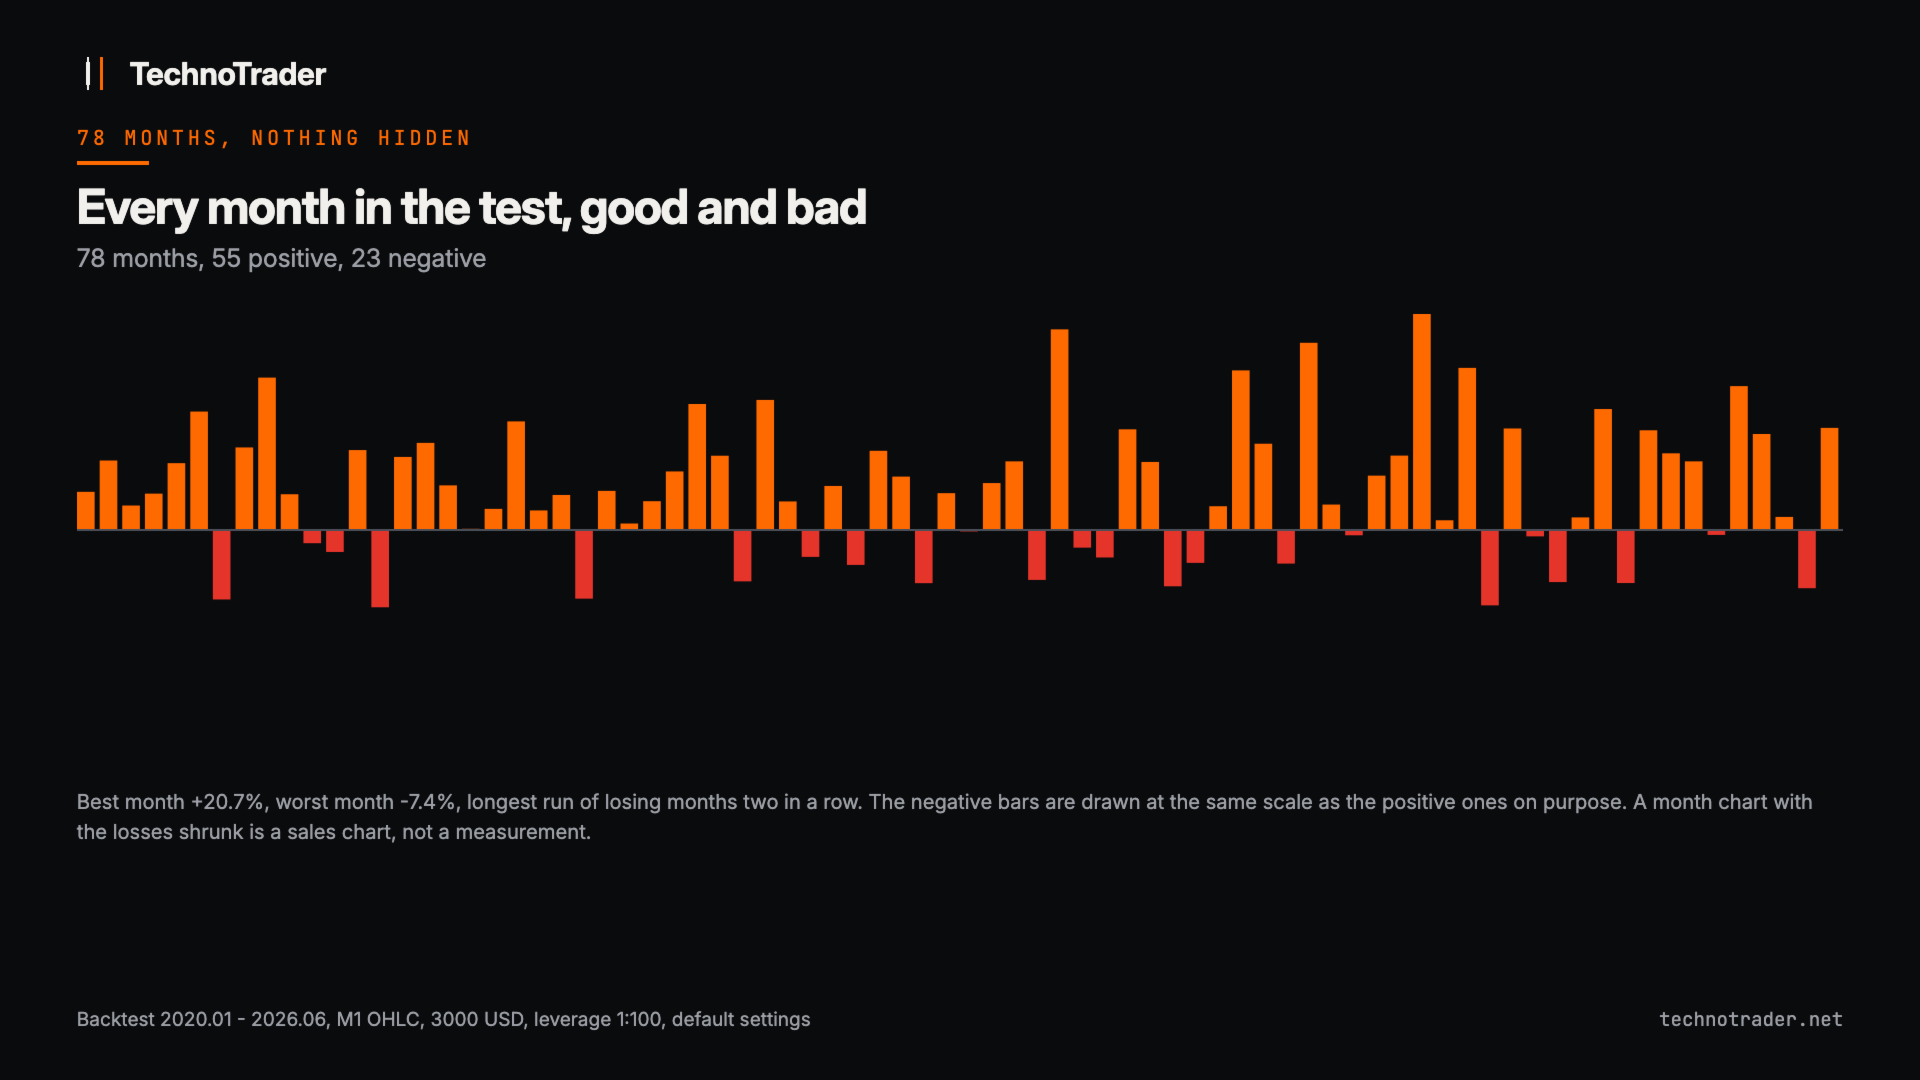
Judge it in months, not trade by trade. In the same test 42% of trades ended positive and 72% of months did (56 of 78), the worst month was -7.4%, the longest run of losing months was two, and none of the 67 rolling twelve-month windows was negative. One path through one history, not a guarantee.
Losing streaks
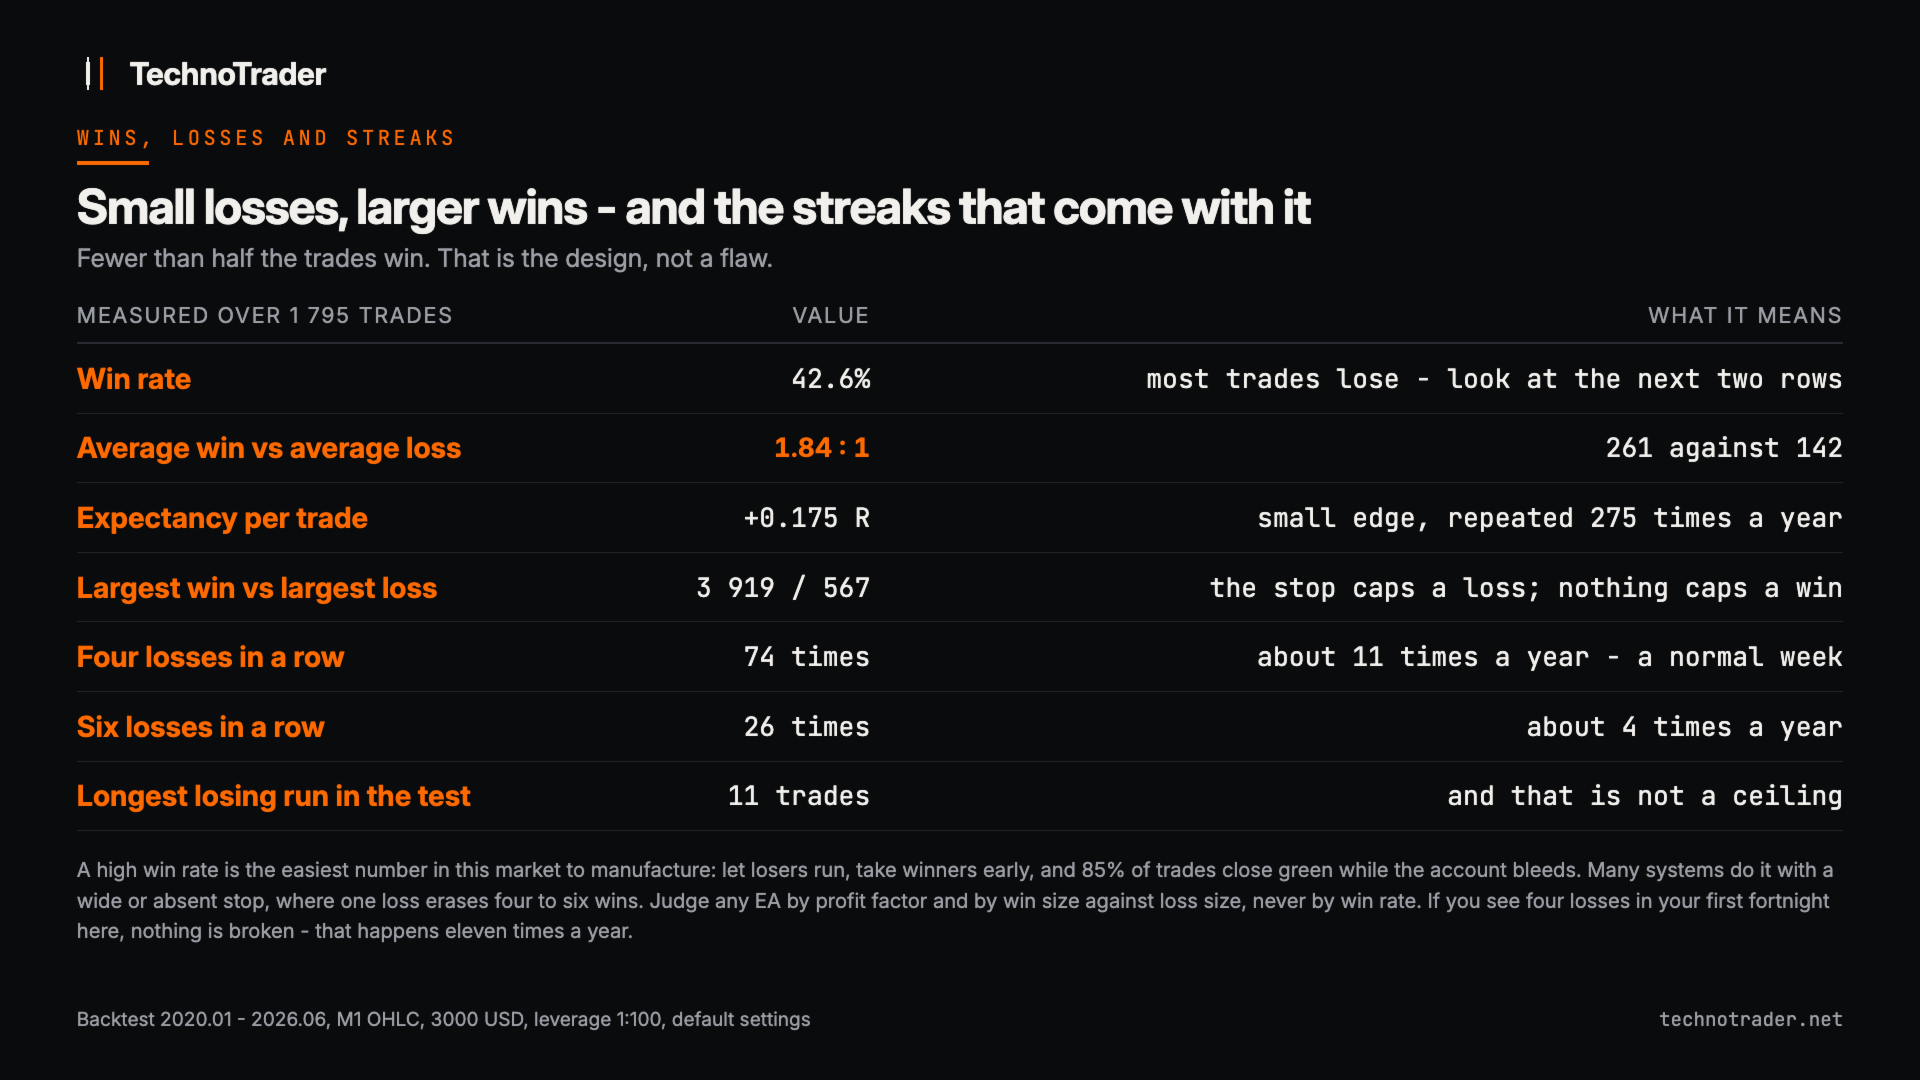
With a 42% win rate, runs of losses are arithmetic, not malfunction.
| Run of losses | Times in the test | How often that is |
|---|---|---|
| Four in a row | 74 | about 11 times a year |
| Five in a row | 45 | about 7 times a year |
| Six in a row | 26 | about 4 times a year |
| Eight in a row | 7 | roughly once a year |
| Eleven in a row | 1 | the longest in the whole test. The longest run of wins was 9. |
Four losses in your first fortnight is normal here. But 11 is the longest streak on one path, not a ceiling: a longer run is entirely possible live, and the account has to be able to sit through one.
Why the win rate is the wrong number to judge by
Fewer than half these trades make money, by design. The average winner made 261 and the average loser lost 142, a payoff of 1.84 to 1, leaving an expected 0.175 of one risk unit per trade. That small edge, repeated 275 times a year, is the whole product. The extremes show the shape: the largest winner made 3919, the largest loser lost 567. A hard stop caps what a loss can become; nothing caps a winner except the end of the day.
A high win rate is the easiest statistic in this market to manufacture: let losers run, close winners early, and 85% of trades close in profit while the account bleeds. Judge by profit factor and average win against average loss instead - both are in the report the free demo generates on your own data.
The honest part
The 17% drawdown is a floor, not an expectation: one realised number from one path through six and a half years, carrying a large sampling error. On an out-of-sample window the same mechanism drew down about twice as deep, so the realistic expectation for Balanced is 25 to 35 percent. Plan your account for the larger number.
The out-of-sample evidence is thin and we would rather say so than hide it. Our index CFD history starts in 2020, so the only earlier test available was the S and P 500 for 2017-2019, and it produced a profit factor of 1.07: positive, but weak. Worse, one year carries all of it (2018), 2017 and 2019 were flat to slightly negative, the longest run of losing months was four against two in sample, and the dominant trade direction flipped between the windows. That is a real warning sign and it belongs on this page, not in a drawer.
Two features cannot be judged from any test here: the news filter is invisible to the strategy tester, and prop mode changes the risk level, which changes everything downstream of it. The window covers the COVID crash of March 2020 and the 2022 rate shock, so it is not a quiet sample - but six and a half years is a short life for a system, and a backtest only describes how fixed rules behaved on prices that already happened.
One instrument, one bet
Measured, not assumed: the same engine across ten index markets in three time zones gave a clean gradient, the three US indices leading and every European and Asian index well below them. Outside that family the edge does not pay for its costs, and a second US index at fixed total risk diluted the result rather than diversifying it, because these markets move together intraday. So you are buying one bet, not a portfolio: no second engine carries a bad stretch on the first. Two thirds of the profit comes from the first 45 minutes after the US cash open, so a broker whose spread widens sharply there will cost you more than the usual amount.
What it does not do
- No martingale, no grid, no averaging down
- No hidden recovery tricks
- No holding a loser overnight to avoid booking it
- No profit cap, no stopping because the account is up
Every position carries a hard broker-side stop from the moment it opens. Daily and weekly loss breakers block new entries only; open positions stay managed. The stretch you would most want to switch it off is usually the one before the recovery.
Optional blocks
Prop-firm rule protection, off by default. The system is flat by the end of every day, so it never carries the overnight exposure most firms restrict. The block tracks static and daily drawdown and flattens well before the limit rather than at it. It also forces risk to 0.40% per trade, deliberately: simulating a 10 percent target with a 10 percent static and 5 percent daily limit, starting a challenge on every trading day of an out-of-sample window, 25.3% of attempts breached a rule at 1.00% and 0.7% did at 0.40%. In-sample data hides that difference entirely. The cost is 17.4% per year at a 6.8% drawdown, against 57.2% and 16.9% normally. It protects the rules; it does not promise you will pass. One warning we hit ourselves: prop platforms often carry very little price history, so you may not be able to verify anything on their server.
News filter, off by default. It pauses new entries around high-impact releases in the instrument's own currency. The economic calendar is not available inside the MetaTrader strategy tester - we verified it, the call returns error 4014. It therefore cannot be backtested by us or by you, and every figure here was measured with it off. Switched on, the EA takes fewer trades than any test shows, and writes a journal line saying so.
Trade randomisation, off by default. It shifts lot size by a few percent either way, so your entries are not identical to other accounts running the same system - which is what firms check for. Your risk moves by the same percentage. Measured on two seeds: one run 1.5% below the unrandomised result, the other 1.1% above, drawdown and profit factor unchanged.
Year-end pause, on by default. Liquidity between the holidays is thin; skipping it improved the test result slightly at an unchanged drawdown. Both dates are inputs.
Broker data and costs
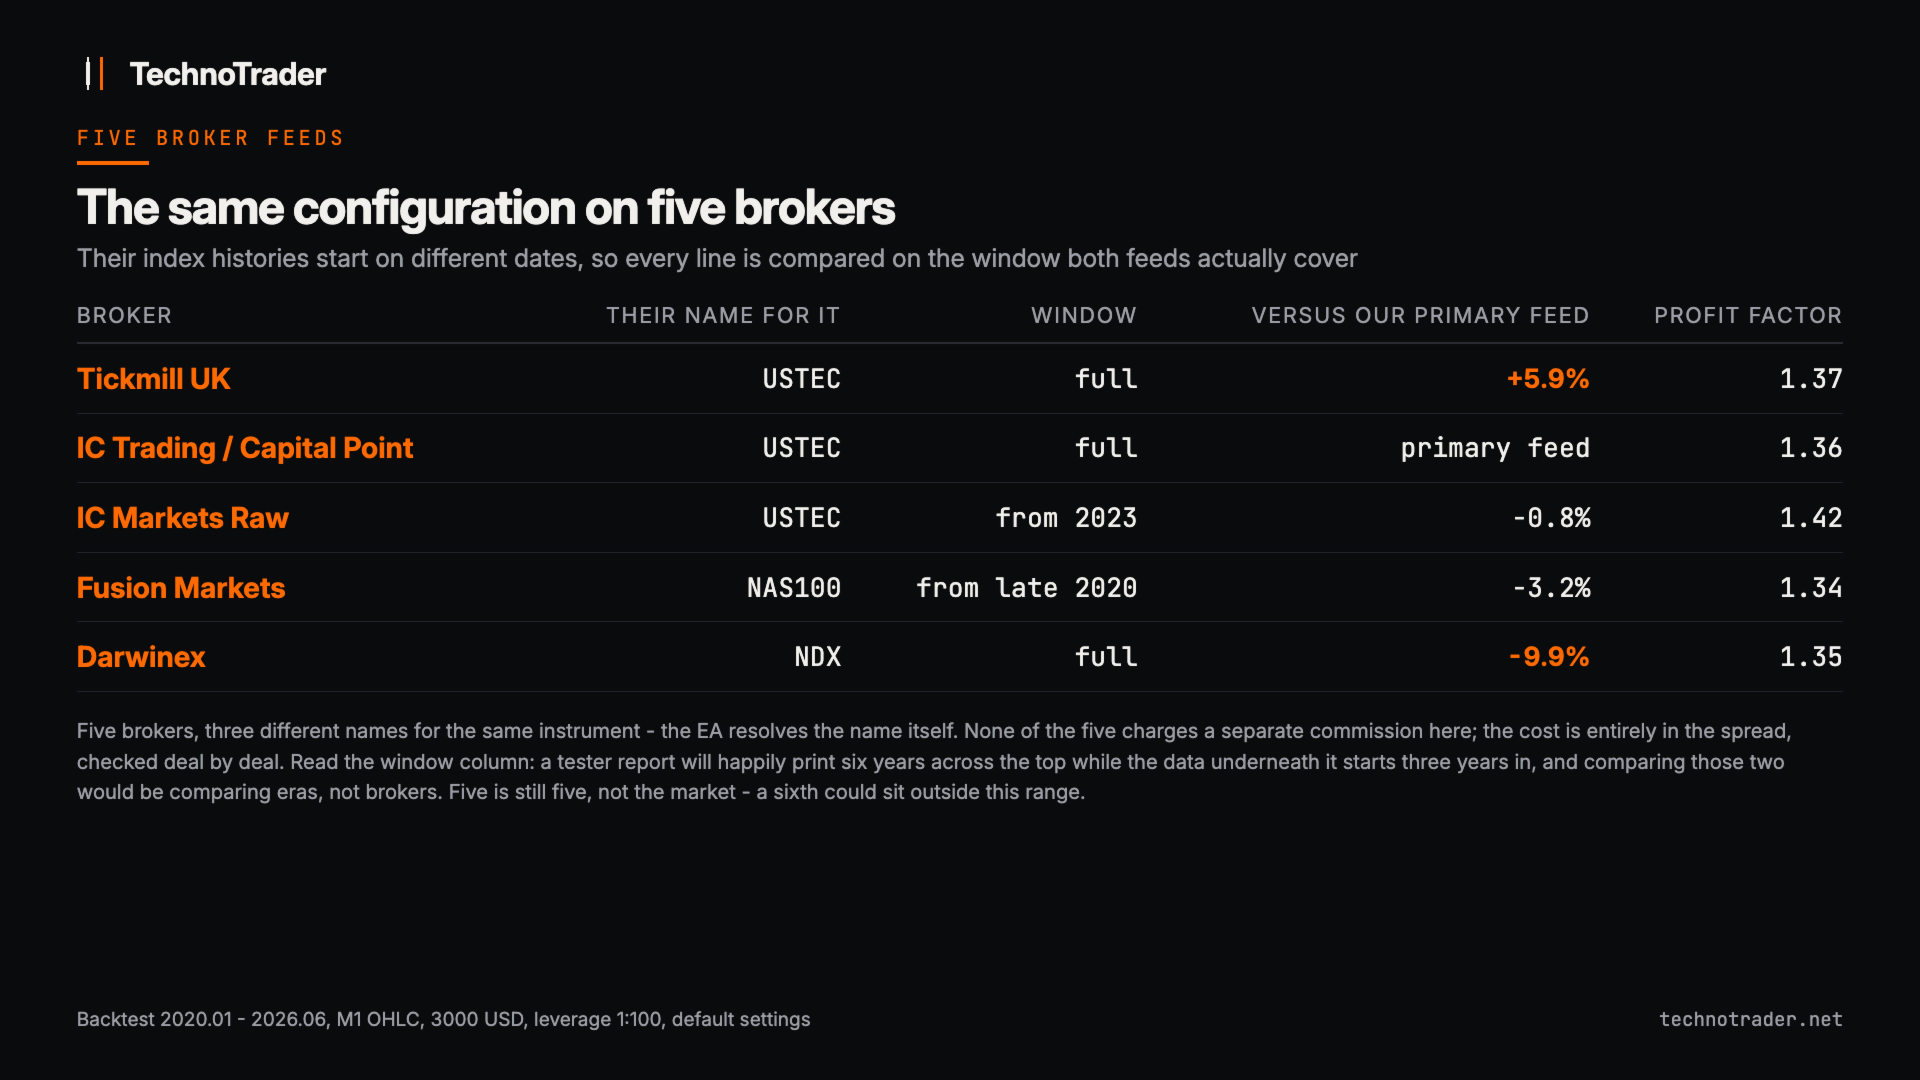
The headline figures come from one raw-spread server with no separate commission on this index CFD. If your broker charges a round-trip commission, enter it in the commission input so the EA's cost gate can see it - otherwise the gate will admit trades whose stop is too small to be worth taking. The same configuration was then measured on four more brokers, each compared on the window both feeds actually cover rather than the date range printed at the top of a report.
| Broker | Window compared | Against the primary feed |
|---|---|---|
| Tickmill UK | full window | 5.9% more profit, profit factor 1.37 against 1.36 |
| IC Markets Raw | from 2023 | 0.8% less, profit factor 1.42 against 1.39 on the matched window |
| Fusion Markets | from late 2020 | 3.2% less and a deeper drawdown, 18.0% against 15.6%. The price of a wider spread |
| Darwinex | full window | 9.9% less, profit factor 1.35 against 1.36. The largest gap we found |
Across five brokers the result runs from 9.9% worse to 5.9% better, profit factor 1.34 to 1.42, win rate 42.3% to 44.2%. None charges a separate commission here, so the cost sits entirely in the spread, which we checked deal by deal. But five is not the market: a sixth could sit outside that range, and a broker whose spread widens sharply at the US open would hurt more than any of these did. Run the free demo on your own broker's data; that result, not this page, is what your account would have seen. Broker names are test data sources only, with no affiliation.
Requirements
- Hedging account, leverage 1:100 or higher. Netting accounts are refused loudly at start, and every published figure was measured at 1:100.
- A broker offering a US tech index CFD. The EA resolves the common names itself and a suffix input covers the rest. A missing symbol is reported loudly; it will never quietly trade the chart symbol instead.
- It trades on 15-minute bars, the only timeframe it was measured on. Attach it to any single chart; that chart's symbol and timeframe are both ignored.
- Strategy tester: 1 minute OHLC is a valid model and real ticks give nearly the same result. Open prices only is not supported.
- The mechanism is anchored to the US cash open. Out of the box it is set for GMT+2 and GMT+3 servers and corrects itself when the US and European clock changes disagree; one input covers any other offset. At startup it prints the session anchor, the entry cut-off and the flat time into the journal.
- Every broker other than our test source is untested. "It gives different numbers at my broker" is expected behaviour, not a defect.
About the price
The price reflects what we can prove today and no more: five brokers' data over one market era, and out-of-sample evidence we call thin above. As that evidence grows, the price follows it upward.
Support: the product's Comments tab. Demo results from brokers we have not tested are welcome there - every shared test makes the picture more honest for the next buyer.