Bitcoin Interval TechnoTrader
- Experts
-
Nice Trader
 📊 Systematic & Algorithmic Trader | MT5 Expert Advisors & Tools | Live Signals | Since 2011
I build and run fully automated strategies as Expert Advisors. Disciplined risk, diversification, long-term consistency.
Trading since 2011 · Algorithmic since 2018 · Live signals on MQL5 since 2024 - Version: 1.1
- Updated: 30 August 2026
- Activations: 10
LIVE SIGNALS - TechnoTrader EA Showcase · Techno Long Term IC · Techno Long Term · Techno Growth
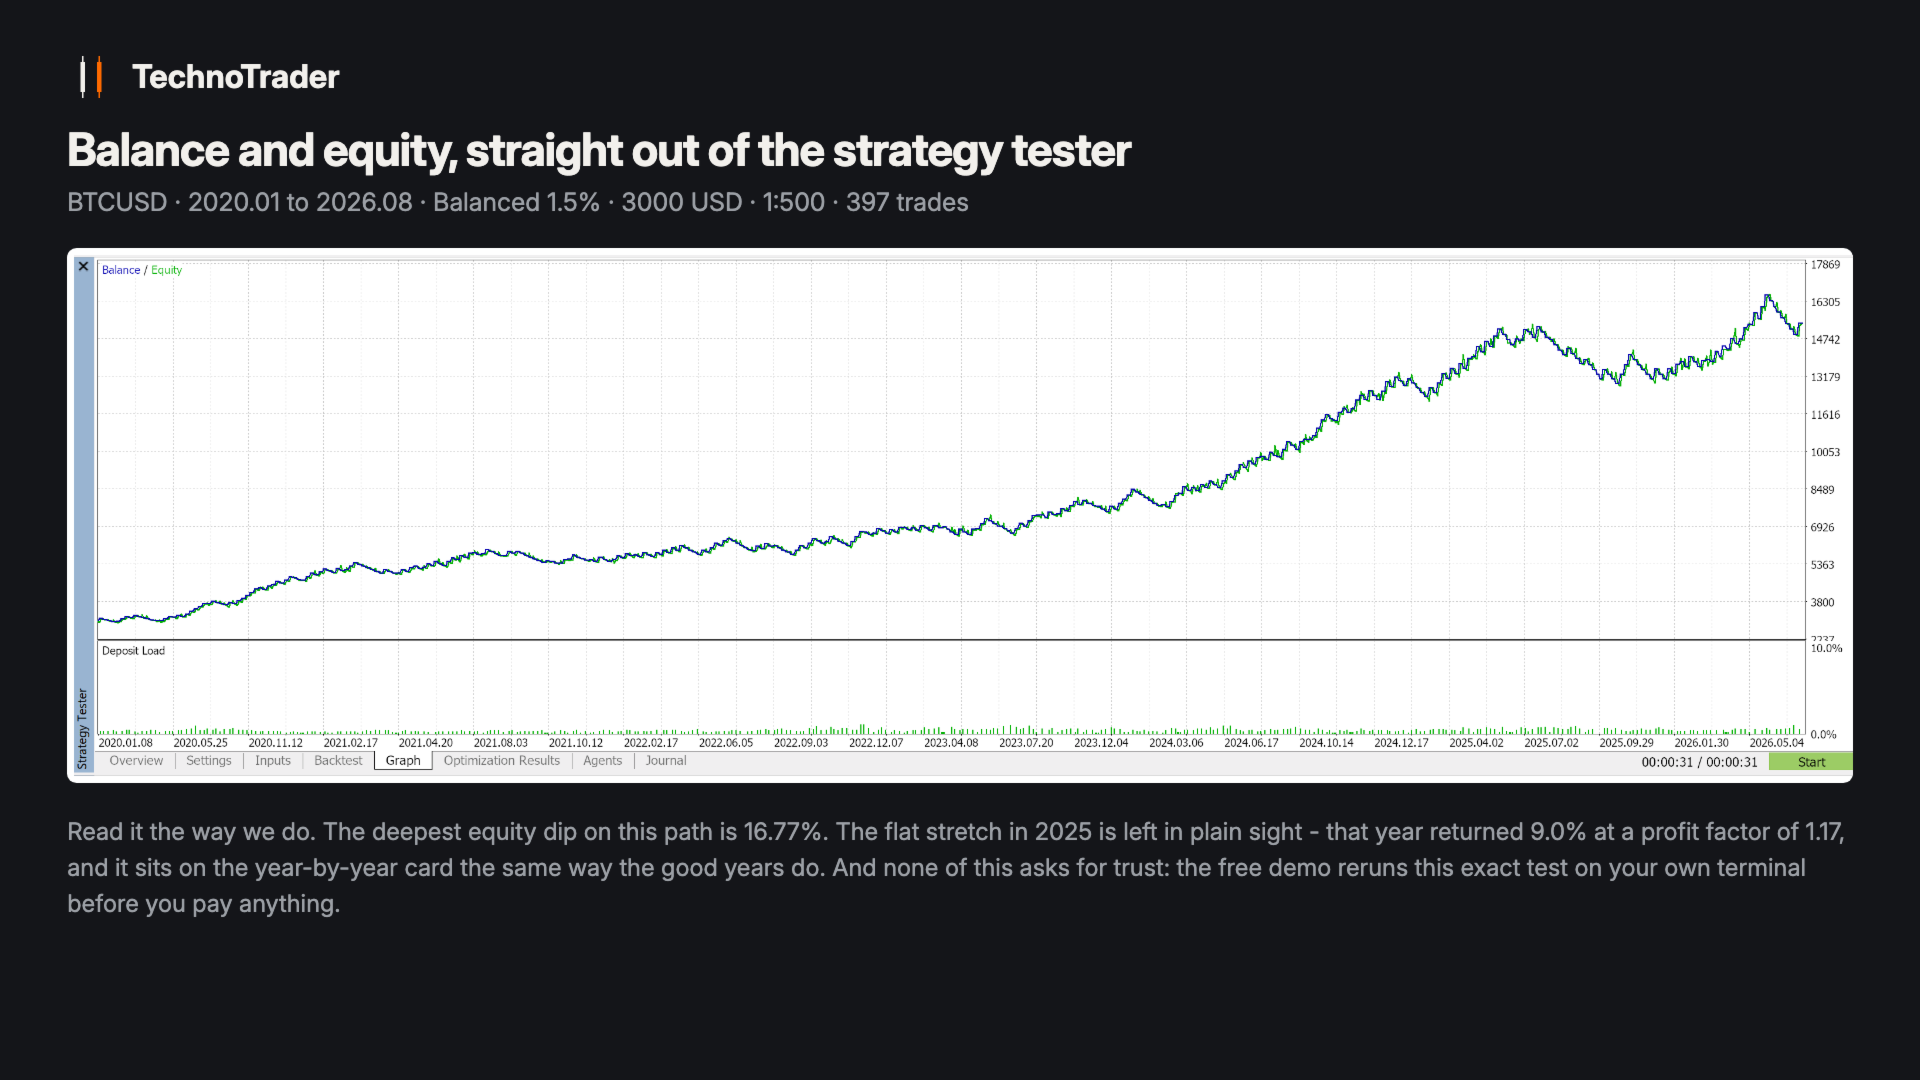
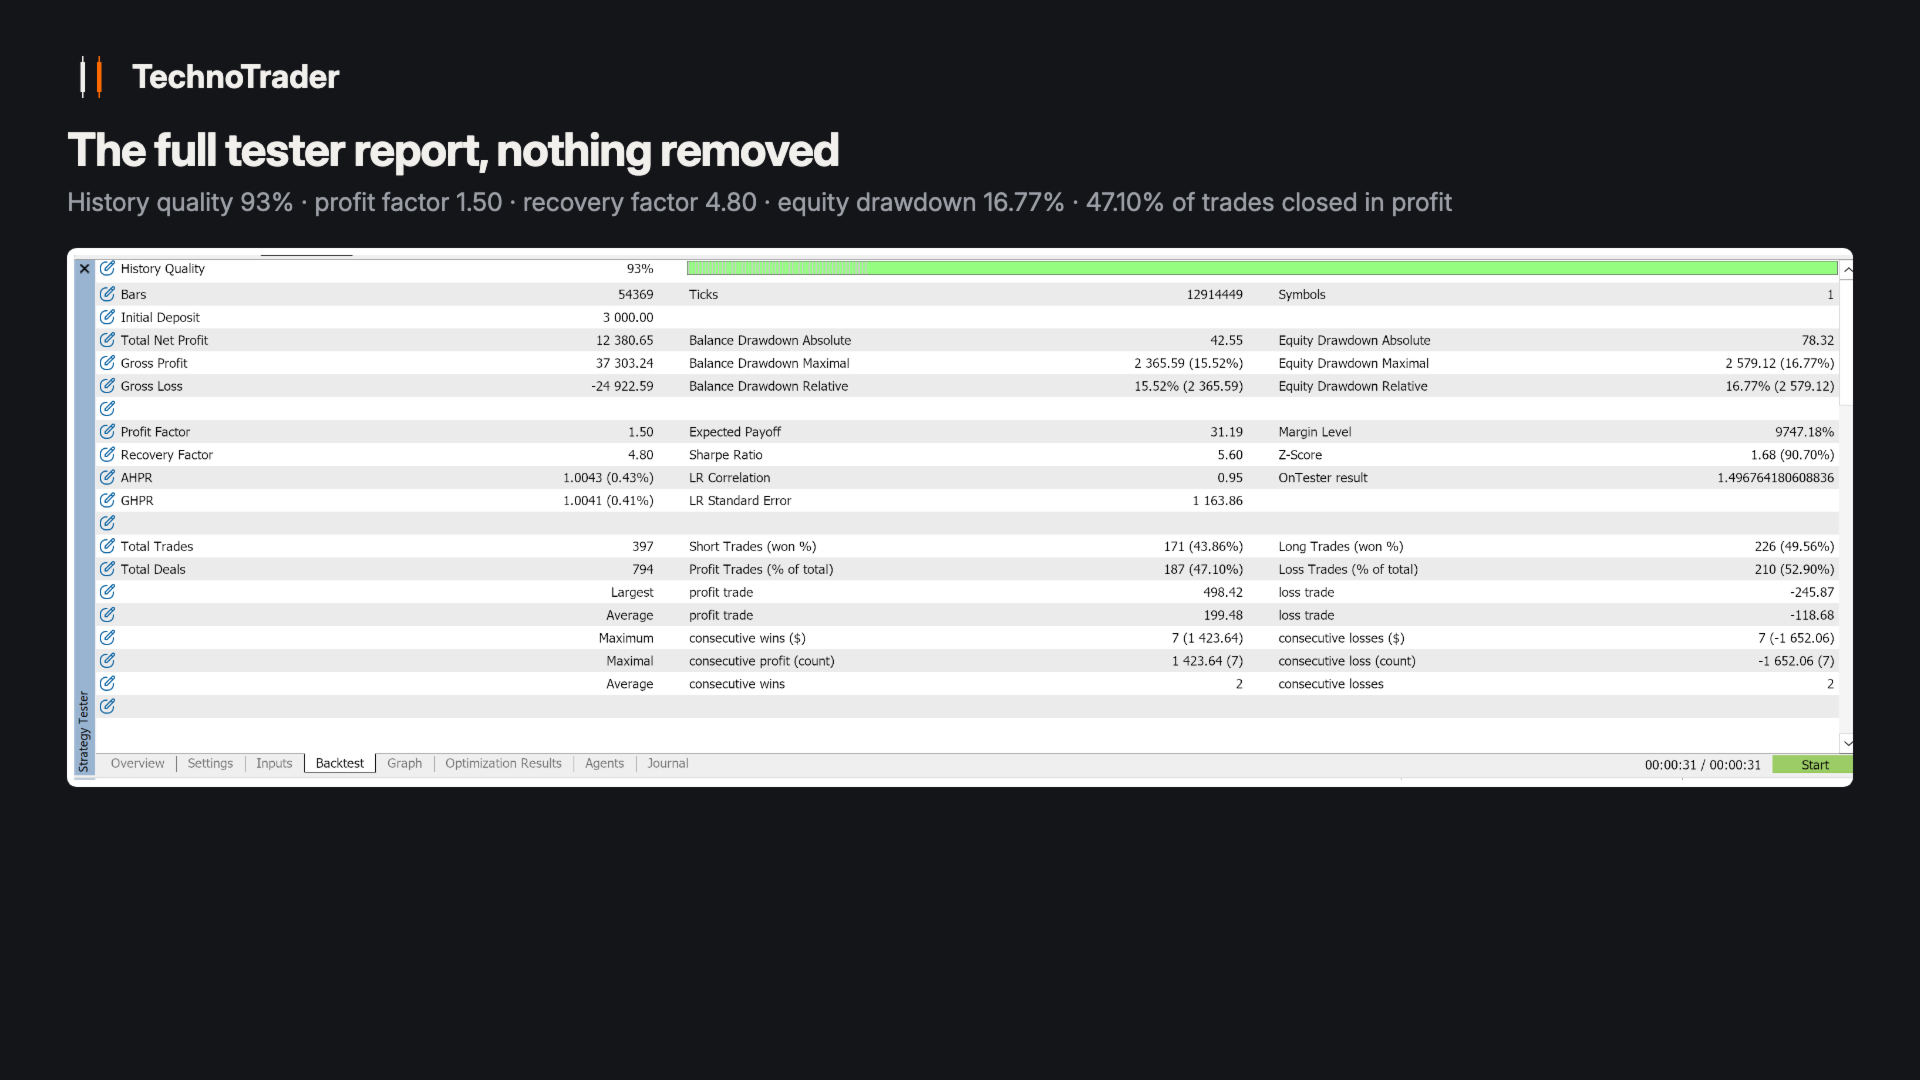
Bitcoin Interval trades BTCUSD only, about sixty trades a year, with a broker-side stop on every one: 28.3% a year at a 16.77% worst equity drawdown, measured across 2020 to 2026 on default settings.
This is not a holy grail. It is a rules-based system: every entry, stop and exit follows conditions fixed in advance, and nothing is discretionary. It is built to be held long term. Every figure below is a measurement, not a promise.
These rules are not a hypothesis, and the first link above is the shortest way to check that. TechnoTrader EA Showcase runs this EA at factory defaults, alongside two other products from the same line: Gold Tempo on gold and Index Cadence on a US tech index. Nothing on that account is tuned and nothing is hidden, which makes it the plainest answer available to what these files do on live money. Read it for what it is: three strategies share one small account, so the risk of all three lands on a single equity curve and its drawdown can run deeper than this product's own figures. That curve belongs to the three together, while the numbers on this page belong to this strategy alone.
The same rules also run inside three larger portfolio accounts: Techno Long Term IC, Techno Long Term and Techno Growth. Open Techno Long Term IC first, because it trades on the same broker family as the feed every figure on this page was measured on, which makes it the closest comparison there is between this backtest and real money. Two things those pages will not show you, and we would rather say them than let you find them. It is not this exact binary running there, it is the same rules at their default settings. And on those accounts this strategy is one part of a portfolio of strategies, never the whole account, which is exactly how it is built to be run.
Bitcoin Interval trades BTCUSD only. It reads calendar windows rather than the tick stream. Each module measures the price move across its window, requires that the move held inside the window, requires the daily trend to agree, and trades the continuation after the window closes. Hard broker-side stop on every position. Time limit in hours. About sixty trades a year.
| Instrument | BTCUSD. Broker symbol name and suffix are inputs |
| Holding time | Hours, capped per module |
| Trades a year | About 60 |
| Account | Hedging, from 100 USD (measured; 500+ recommended), leverage 1:100+ |
| Risk per trade | 0.5%, 1.5% or 2.5%, three measured packages, plus Custom and Fixed lot |
| Never used | Martingale, grid, averaging down |
Two modules, one risk chassis. One reads a session window inside the day. One reads the weekend. Independent signals.
How it decides
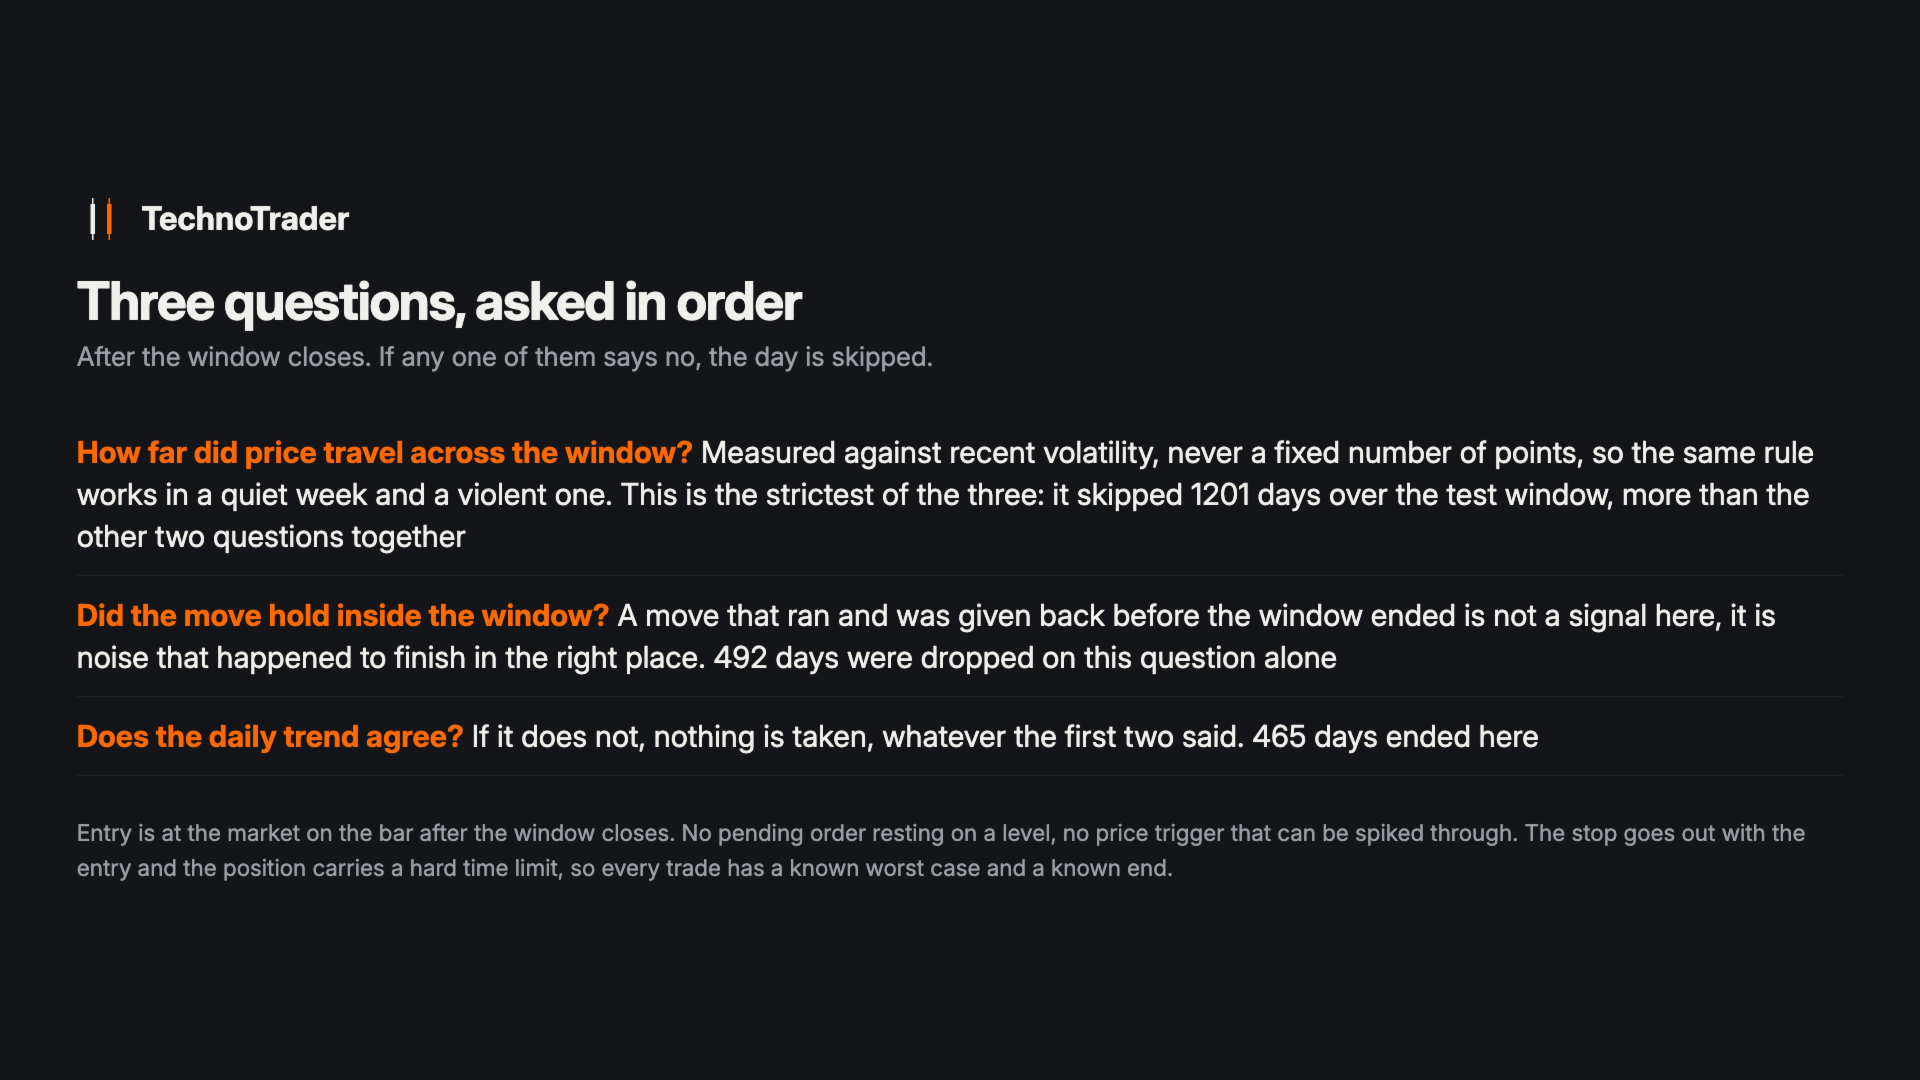
Each module waits for its window to close, then asks three questions in order. How far did price travel across the window, measured against recent volatility rather than a fixed number of points. Did that move hold inside the window, or was it given back before the window ended. Does the daily trend point the same way. Only when all three agree does it enter, at the market, on the bar after the window closes - there is no pending order sitting on a level and no price trigger to be spiked through. The stop goes out with the entry and the position carries a hard time limit, so every trade has a known worst case and a known end.
Backtest, 2020.01-2026.08
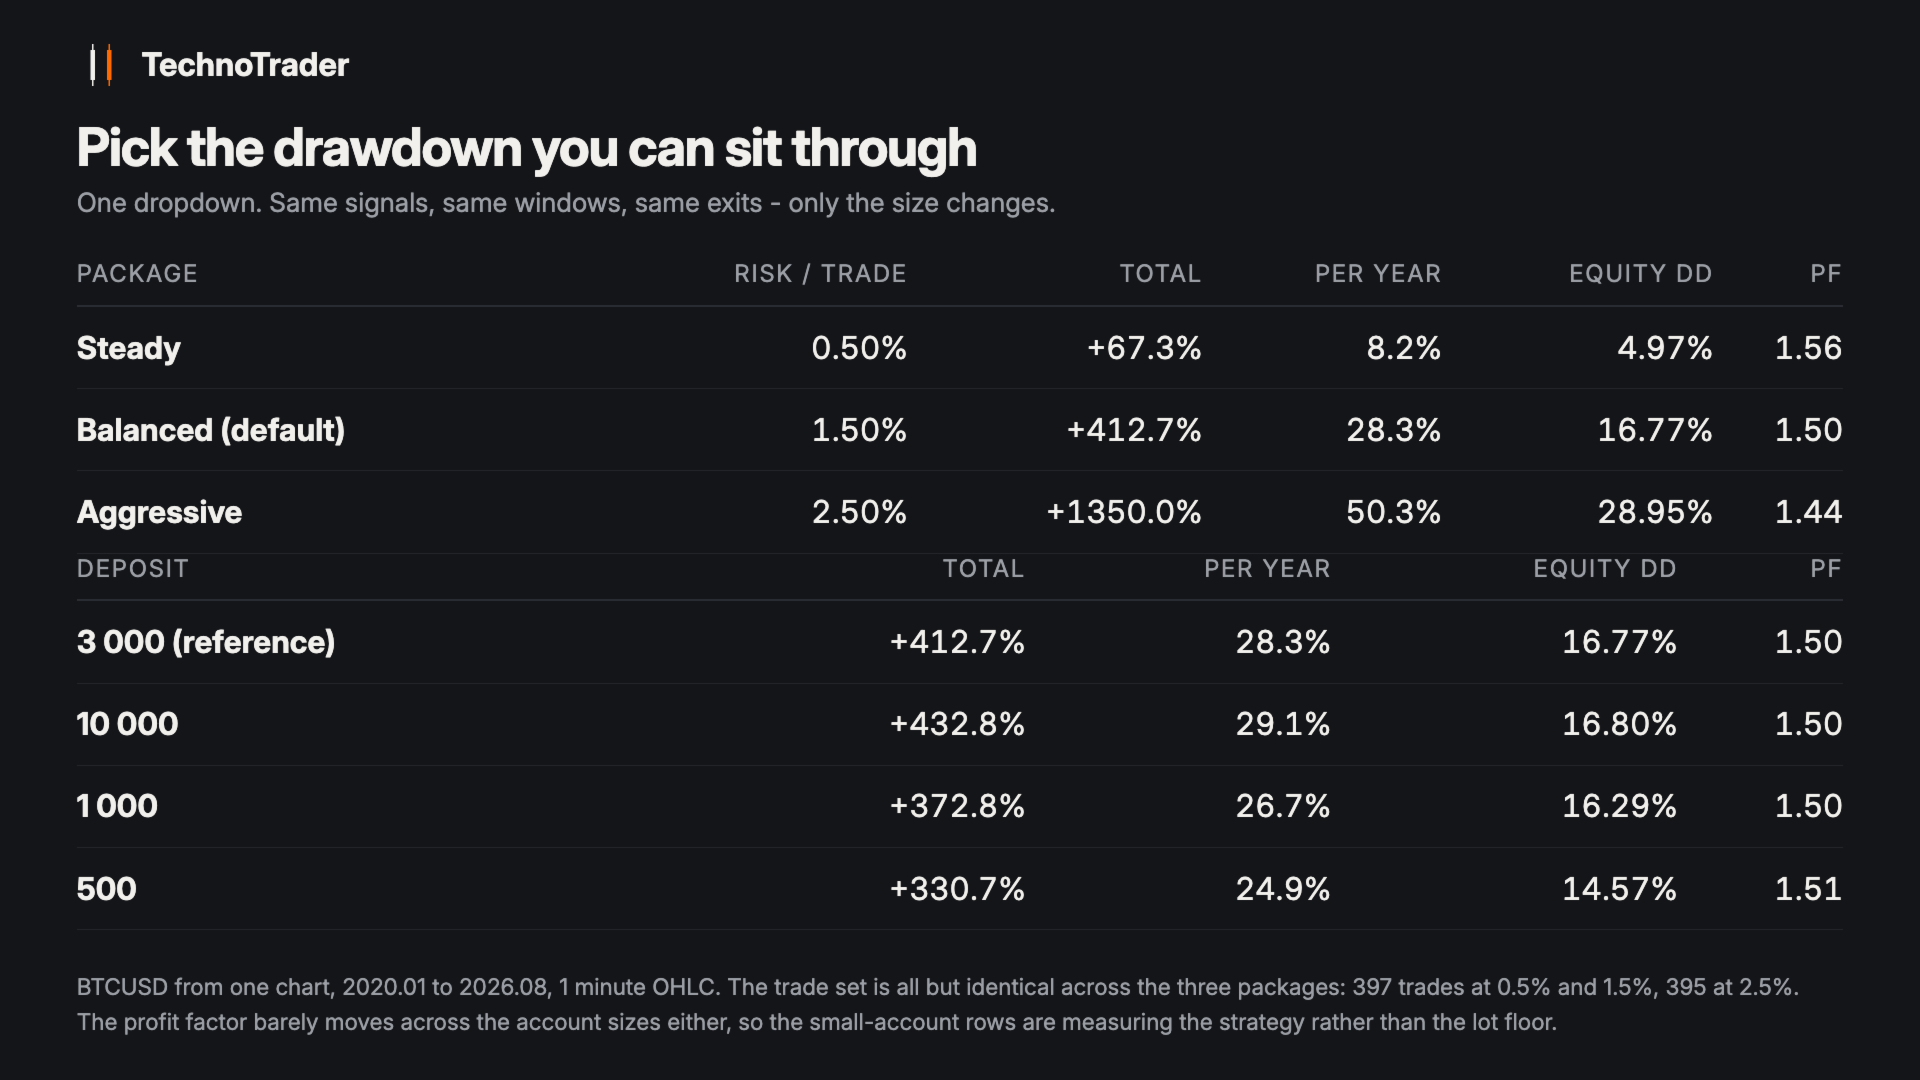
Three risk packages on a 3000 USD account, each measured separately. The trade set is all but identical across the three: 397 trades at 0.5% and 1.5%, 395 at 2.5%.
| Package | Risk | Over the window | Worst equity drawdown | Profit factor |
|---|---|---|---|---|
| Steady | 0.5% | +67.3% | 4.97% | 1.56 |
| Balanced (default) | 1.5% | +412.7% | 16.77% | 1.50 |
| Aggressive | 2.5% | +1350.0% | 28.95% | 1.44 |
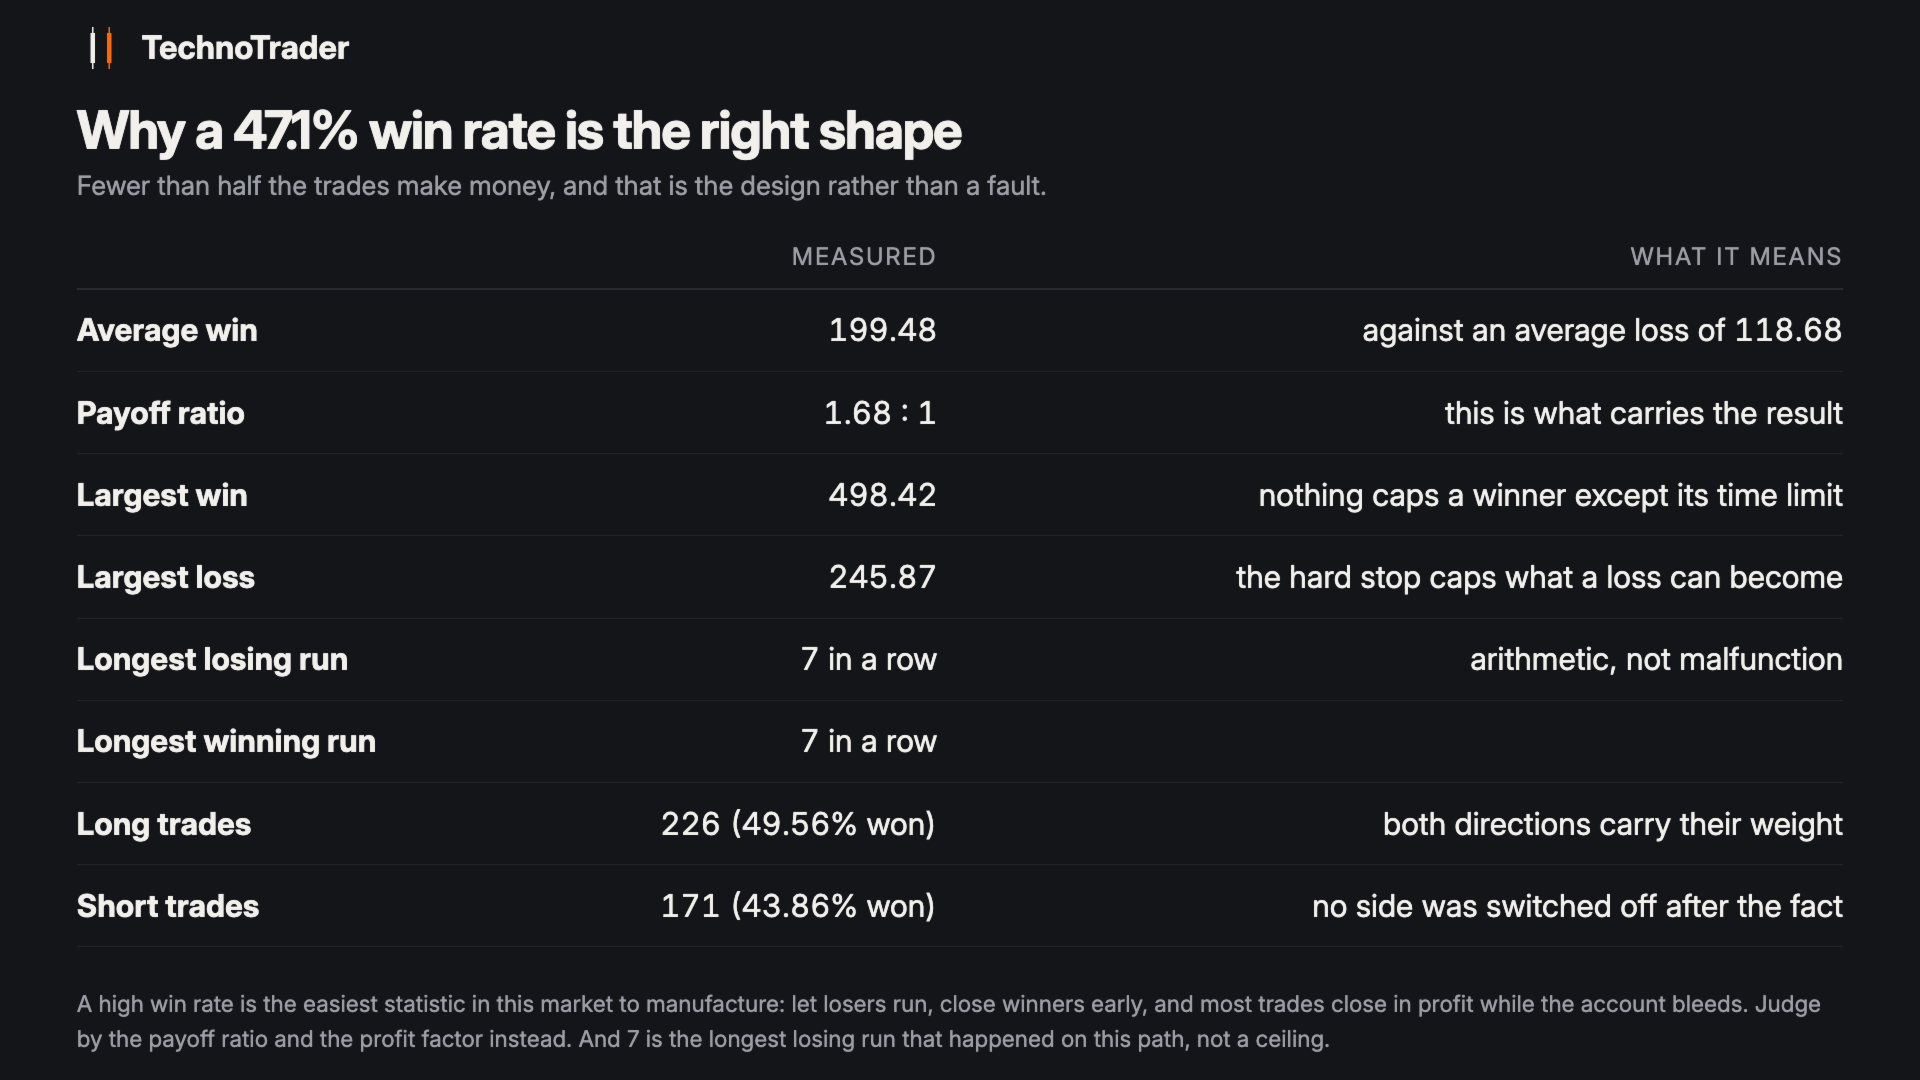
Default package: 28.3% a year, 397 trades, 47.1% closed in profit.
What the measurements show
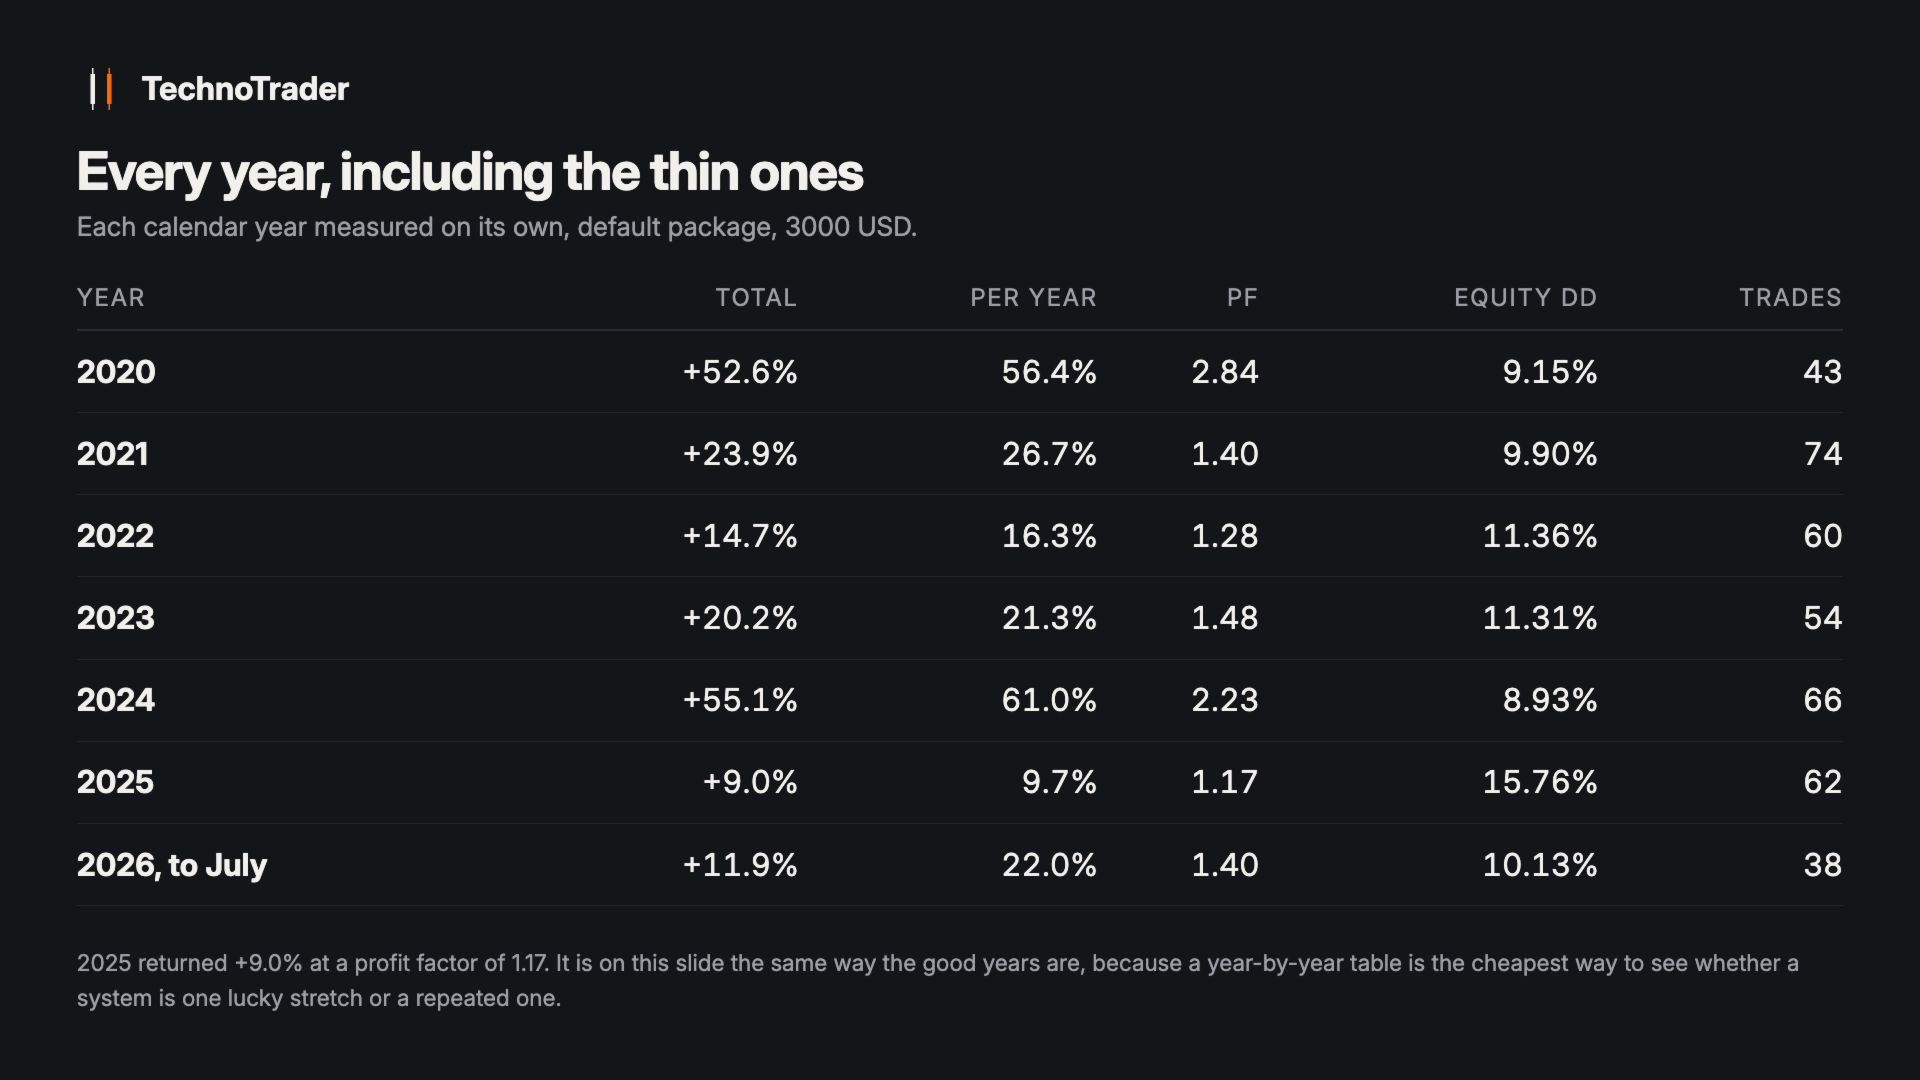
- Every calendar year in the window is positive, including the thin ones. 2025 returned +9.0% at a profit factor of 1.17, and it is on the year-by-year screenshot exactly like the good years.
- Account size barely changes the result. From 500 to 10 000 USD the return per year moves between 24.9% and 29.1% at the same profit factor.
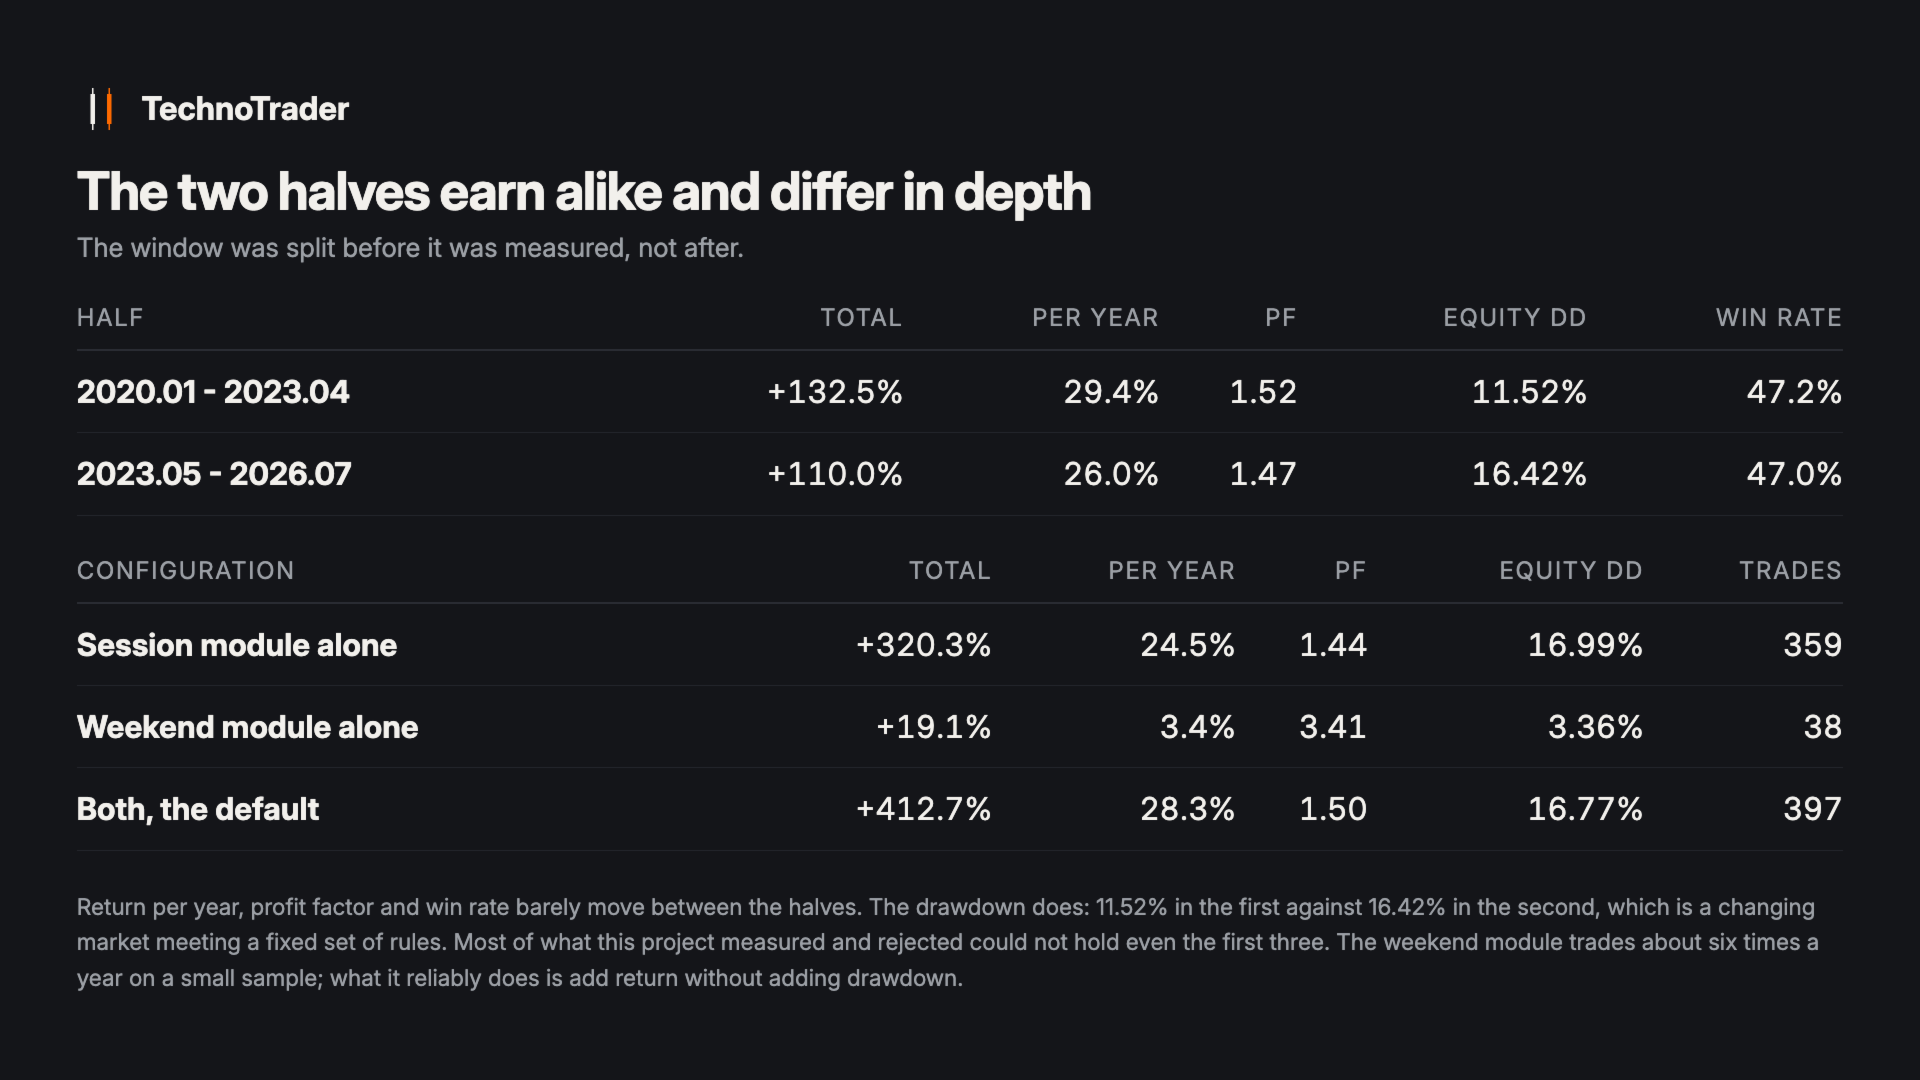
- The two modules genuinely diversify. Run together they produce a smaller drawdown than the session module produces on its own, while adding return.
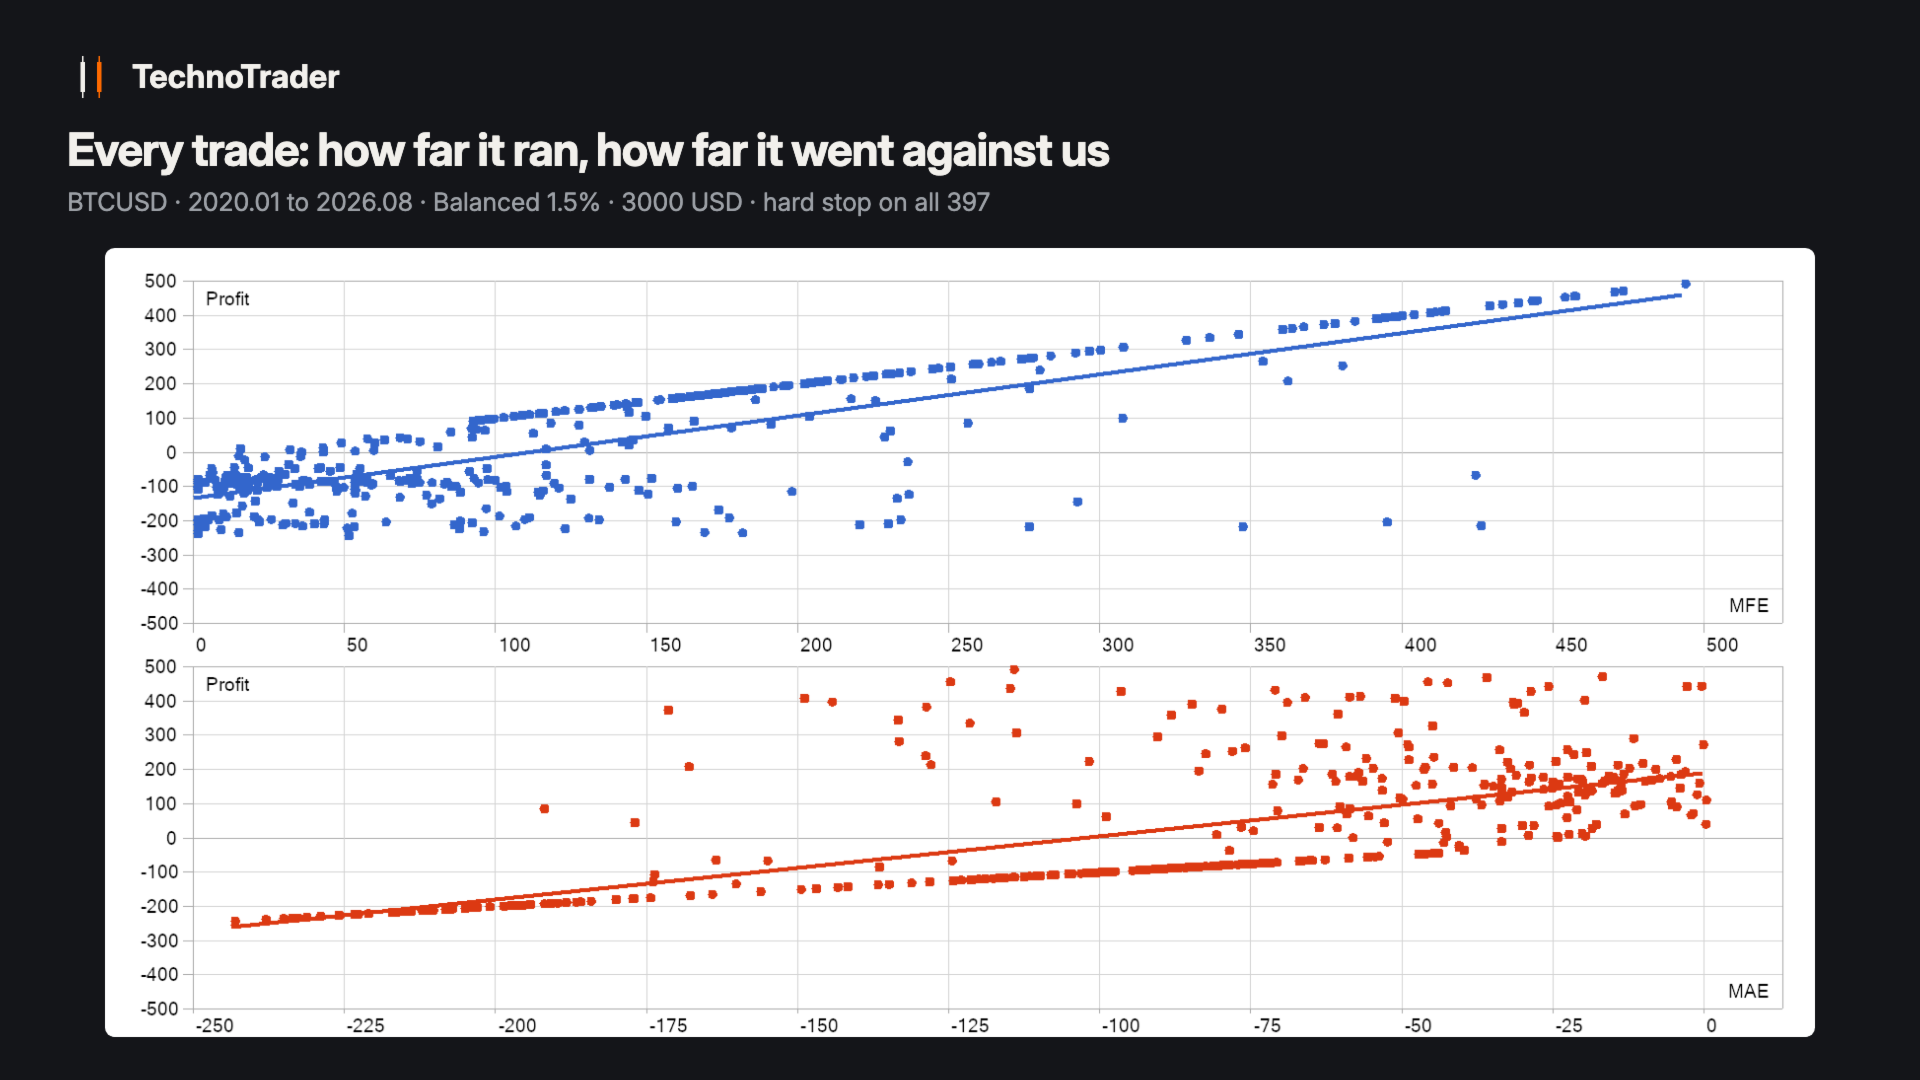
- Bars and ticks agree, so the result does not depend on optimistic fills.
- The rules already run on real money, inside three public MQL5 signals, as one component of each portfolio - and one of them trades on the same broker family as the figures above.
Account size, default package:
| Account | Over the window | Equity drawdown | Profit factor |
|---|---|---|---|
| 500 USD | +330.7% | 14.57% | 1.51 |
| 1000 USD | +372.8% | 16.29% | 1.50 |
| 3000 USD | +412.7% | 16.77% | 1.50 |
| 10 000 USD | +432.8% | 16.80% | 1.50 |
Alone, or alongside other EAs
Every figure here was measured with this EA alone on the account.
It also runs beside other EAs. One instrument, holds for hours, own magic numbers, never touches a position it did not open. Daily and weekly loss latches cap its cost in a bad week.
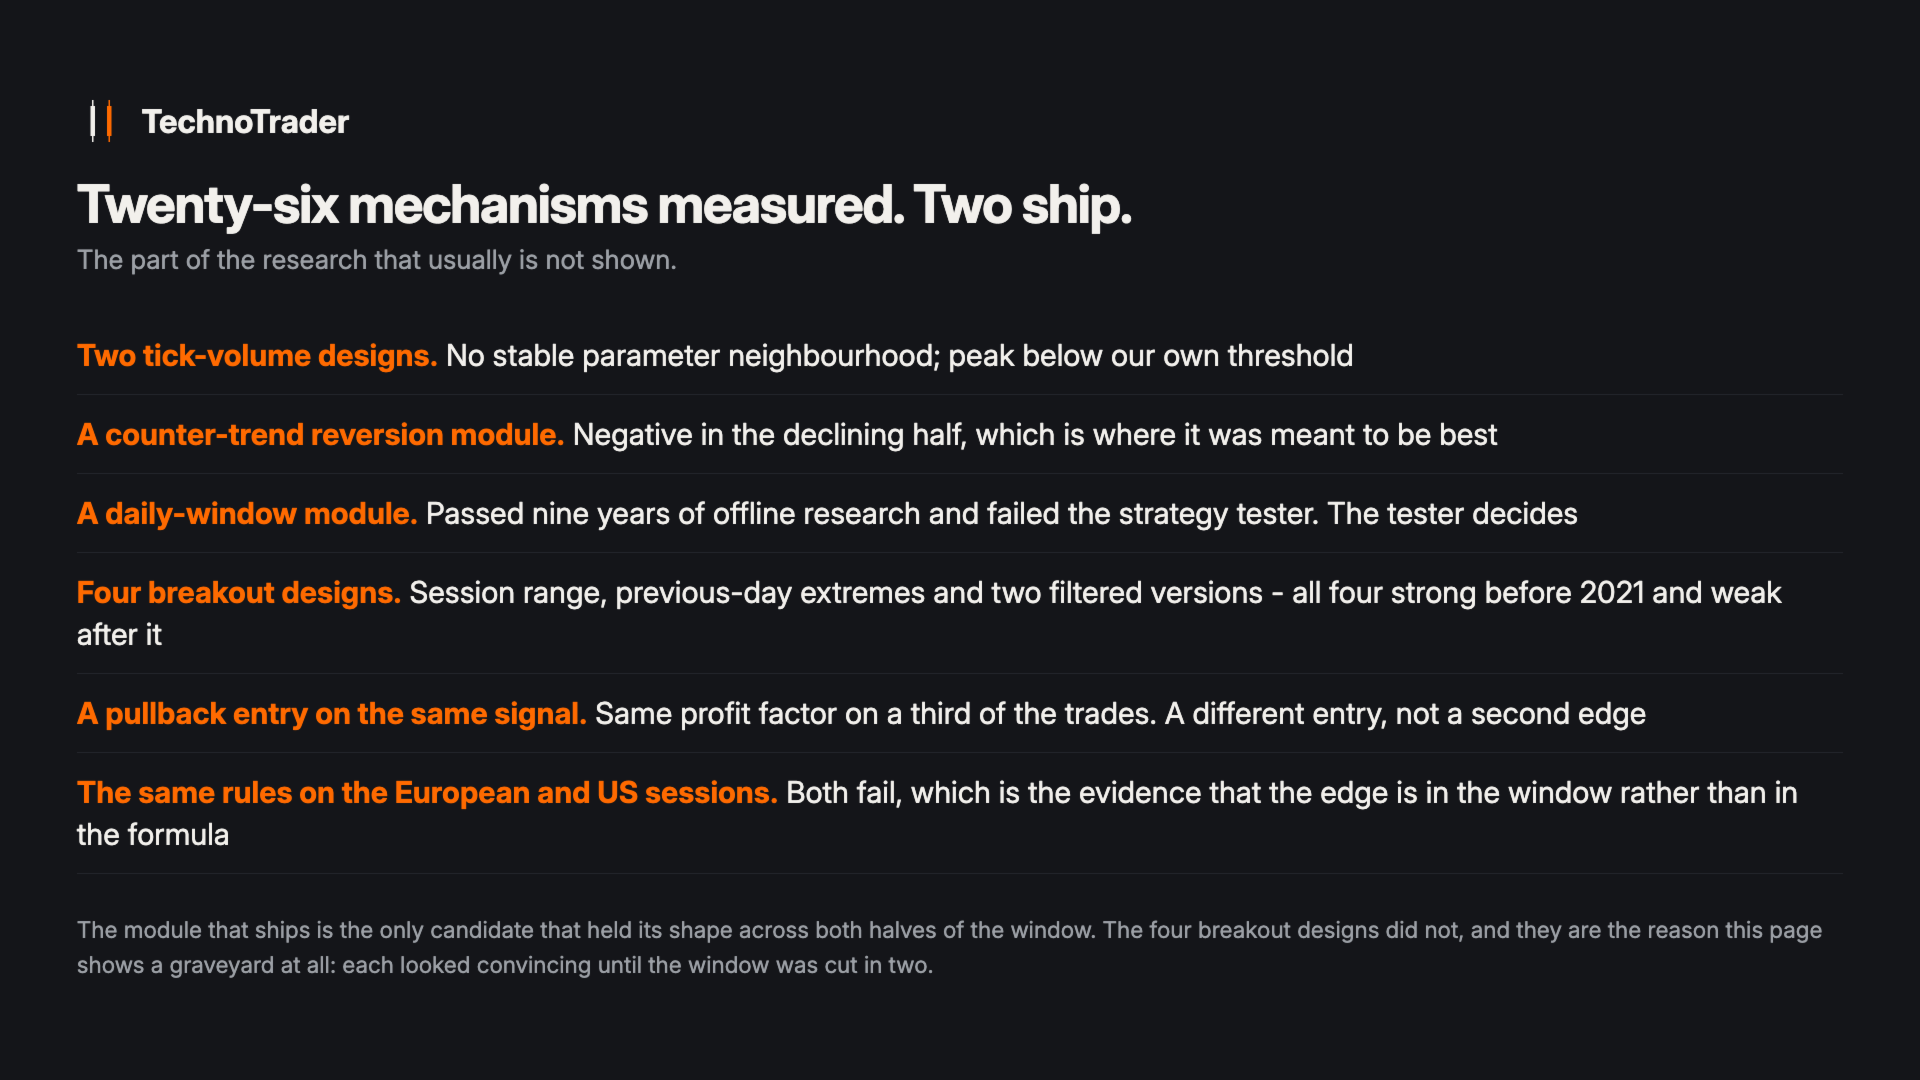
Year by year, the window split in half, each module measured on its own, the account-size ladder and the full list of what was measured and rejected are in the screenshots.
Minimum lot
The minimum position is 0.01 BTC and cannot be divided. On a small account at current Bitcoin prices the calculated size rounds up to that minimum, so real risk per trade exceeds the setting. The EA takes the trade anyway and reports it. The 500 USD row above is carried by the early years of the window, when Bitcoin was cheaper. And you can start at 100 USD: measured across twelve windows on two broker feeds, every single run ends in profit. The full window turned 100 into 943. Starting at the November 2021 top still made +601%; the 2022 bear year on its own still closed positive. One thing to know before you do: at 100 the minimum lot outweighs the risk setting, so the ride is wilder - equity drawdowns ran 23-41% against 16.77% at the reference. From about 500 the EA behaves exactly as designed.
Split in half
The window was split before measuring, not after:
| Period | Return | Profit factor | Trades | Win rate |
|---|---|---|---|---|
| 2020.01 - 2023.04 | +132.5% | 1.52 | 195 | 47.2% |
| 2023.05 - 2026.07 | +110.0% | 1.47 | 202 | 47.0% |
Limits
The window was split in half before it was measured, and both halves behave alike: 29.4% a year against 26.0%, profit factor 1.52 against 1.47. They differ in drawdown, 11.52% in the first half against 16.42% in the second, which is what a changing market does to a fixed set of rules. The 16.8% in the table is the deepest drawdown that occurred on this particular path; another path gives another number, so choose the risk package by the drawdown you are comfortable sitting through. Fewer than half the trades are profitable, by design, which is why the profit factor and the payoff ratio are the numbers to judge by rather than the win rate. A backtest describes how fixed rules behaved on prices that have already happened.
What it does not do
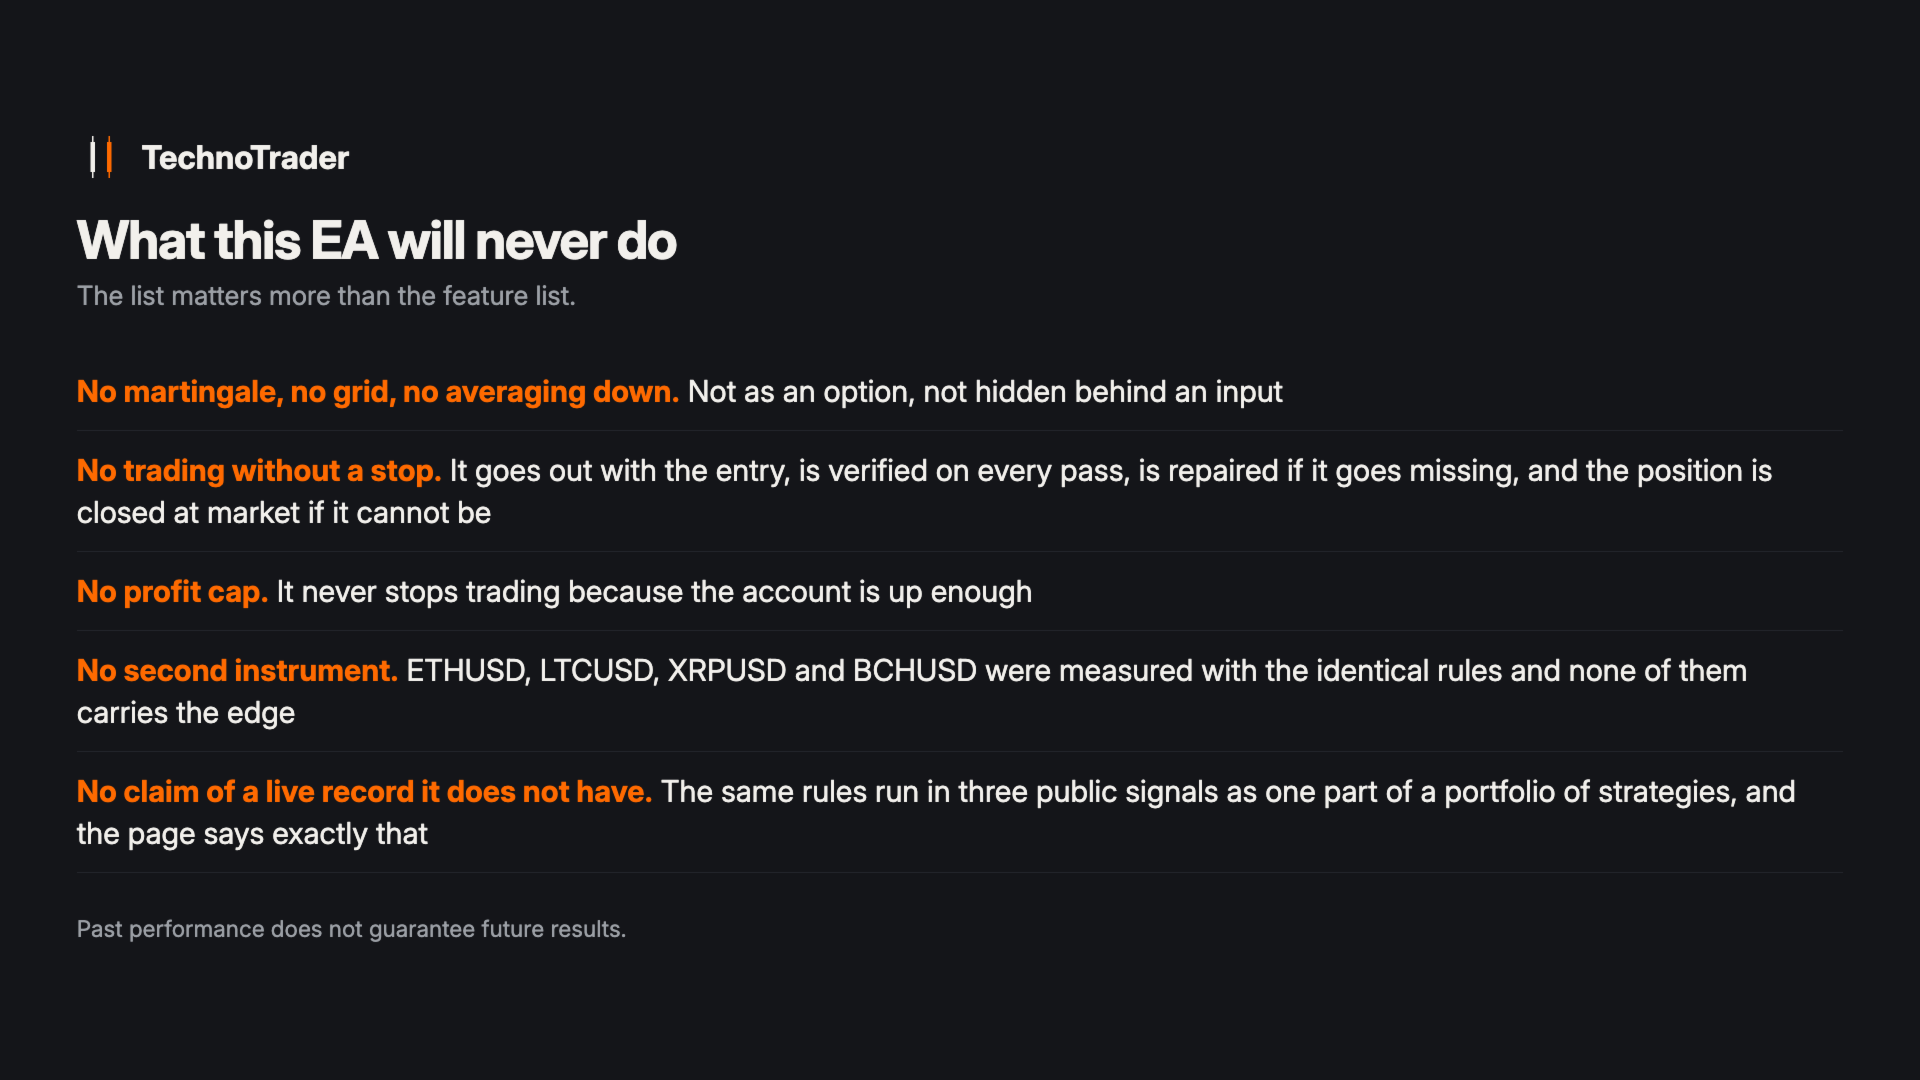
- No martingale, no grid, no averaging down
- No recovery mode, no holding a loser to avoid booking it
- No profit cap, no stopping because the account is up
The stop is sent with the entry, verified on every pass, repaired if missing, and the position is closed at market if it cannot be repaired. Daily and weekly loss latches block new entries only; open positions stay managed.
Optional blocks
Prop-firm rule protection, off by default. Tracks overall and daily drawdown limits, stops new entries near either, closes only its own positions.
Year-end pause, on by default. Every figure here was measured with it on. Both dates are inputs.
News filter, off by default. The MetaTrader strategy tester has no economic calendar. The filter therefore cannot be backtested, and every figure here was measured without it. Switched on, the EA takes fewer trades than any test shows. It writes a journal line saying so. It exists because some prop firms require it.
Trade randomisation, off by default. Prop firms check for identical trades across accounts; this shifts each position's size by up to a few percent either way so yours are not. The price is not hidden - your risk moves by the same percentage. Measured on two seeds over the same window: one run came out 0.7% below the unrandomised result, the other 1.6% above, with the profit factor unchanged at 1.50 and the drawdown slightly lower in both. Set a fixed seed for a repeatable run.
Broker data
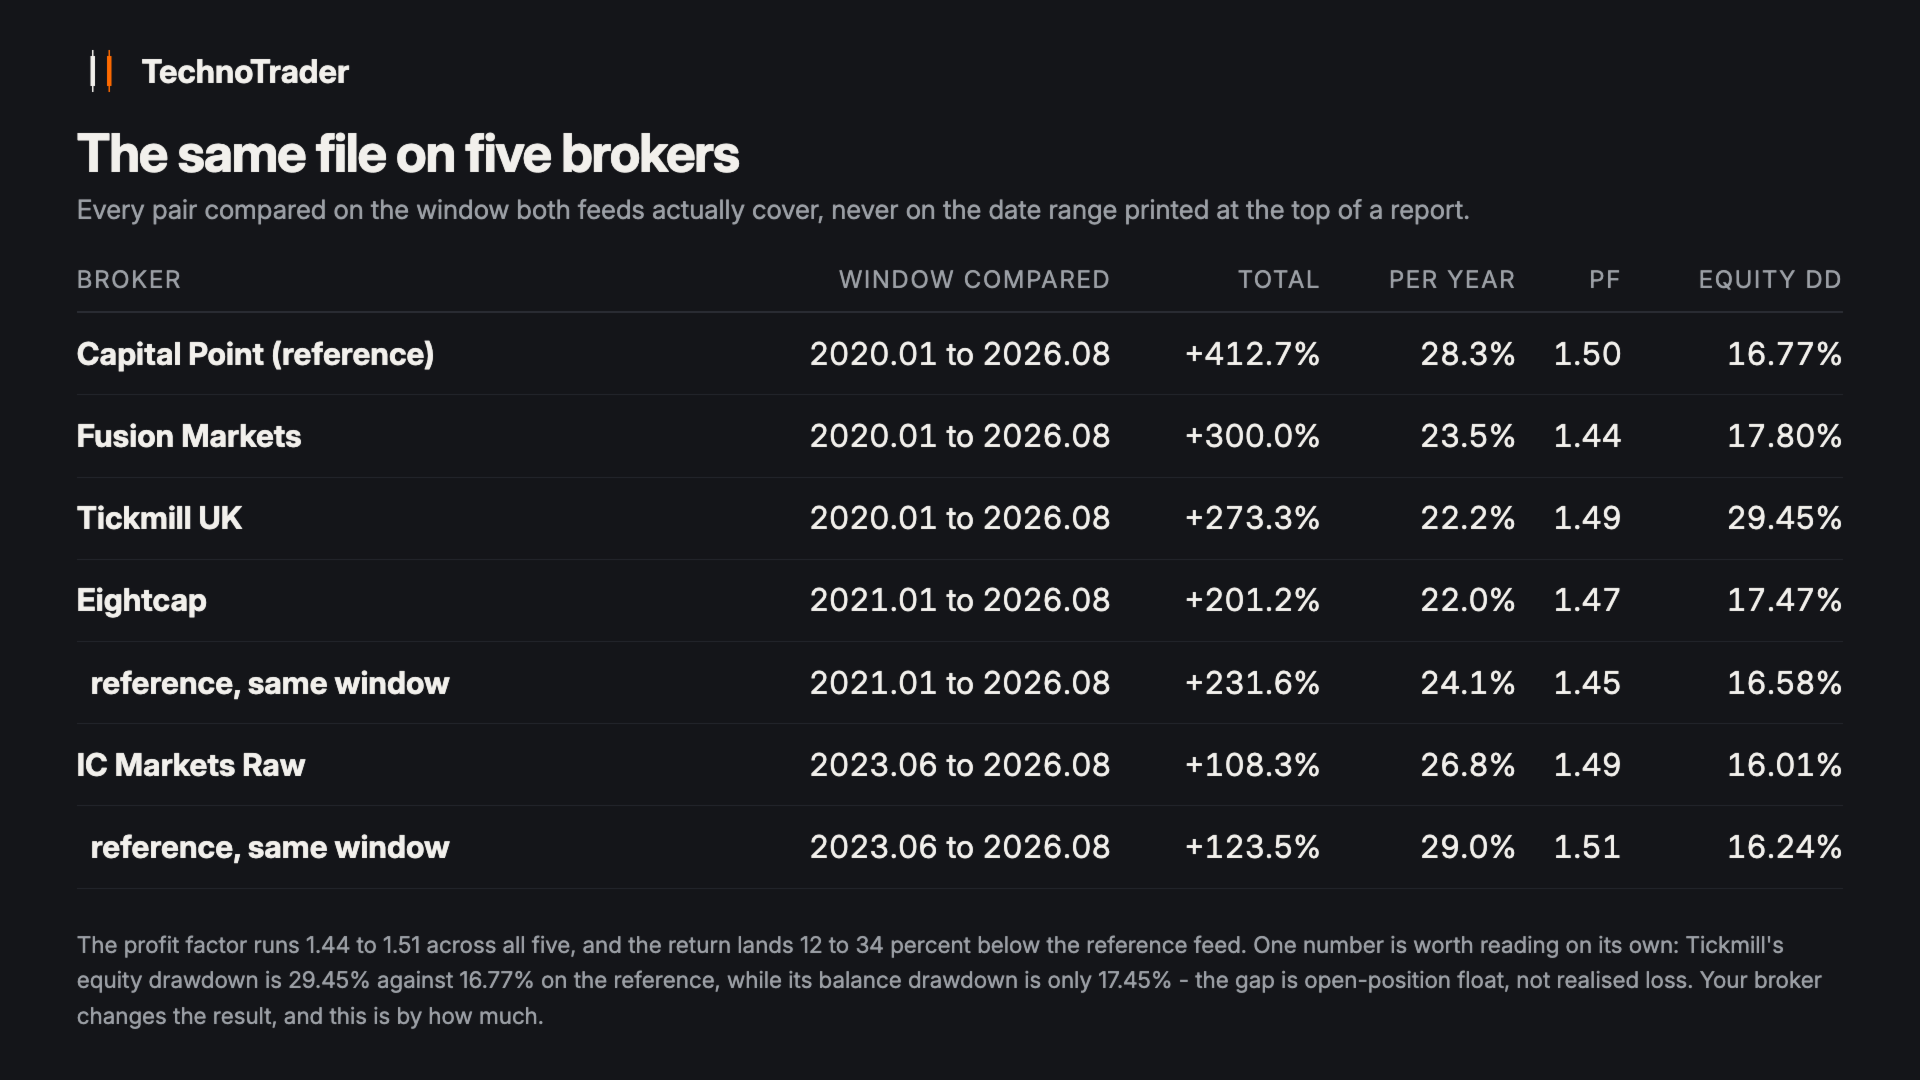
The headline figures come from one raw-spread server with no separate commission on Bitcoin. The same file was then measured on four more brokers, each compared on the window both feeds actually cover rather than on the date range printed at the top of a report. Across all of them the profit factor runs 1.44 to 1.51 and the return lands 12 to 34 percent below the reference feed. One row is worth reading on its own: on Tickmill the equity drawdown is 29.45% against 16.77% here, while its balance drawdown is 17.45% - the gap is open-position float rather than realised loss. The broker table is in the screenshots.
Any other broker is untested. Crypto spreads vary far more between brokers than currency spreads. Stops here are set from volatility, so a wider spread changes which setups clear the cost gate. Run the free demo on your own broker's data before relying on any figure here.
Requirements
- Hedging account, leverage 1:100 or higher - every figure on this page was measured on one. On a netting account the modules take turns instead: a new position opens only while the symbol is flat, so nothing ever merges.
- A broker offering Bitcoin against the dollar. If not found, the EA starts, warns on the panel and does not trade. It never substitutes the chart symbol.
- From 500 USD. Attach to any single chart; its symbol and timeframe are ignored.
- Strategy tester: one-minute bars and the tick model agree. Open prices only is not supported.
Price
99 USD until the end of Sunday 13 September 2026. From Monday 14 September, 199 USD. Expected settled price as the live record grows: 799 USD. Buyers keep all future versions at the price paid. The date will not be extended.
Support: the product's Comments tab. Demo results from brokers we have not tested are welcome there.