Multi TF Candle Timer MT4
- Indicators
- Version: 2.0
- Updated: 14 September 2026
- Activations: 10

🚀 Multi Candle Timer (MT4/MT5) — Premium Dashboard [Ultimate UI Edition]
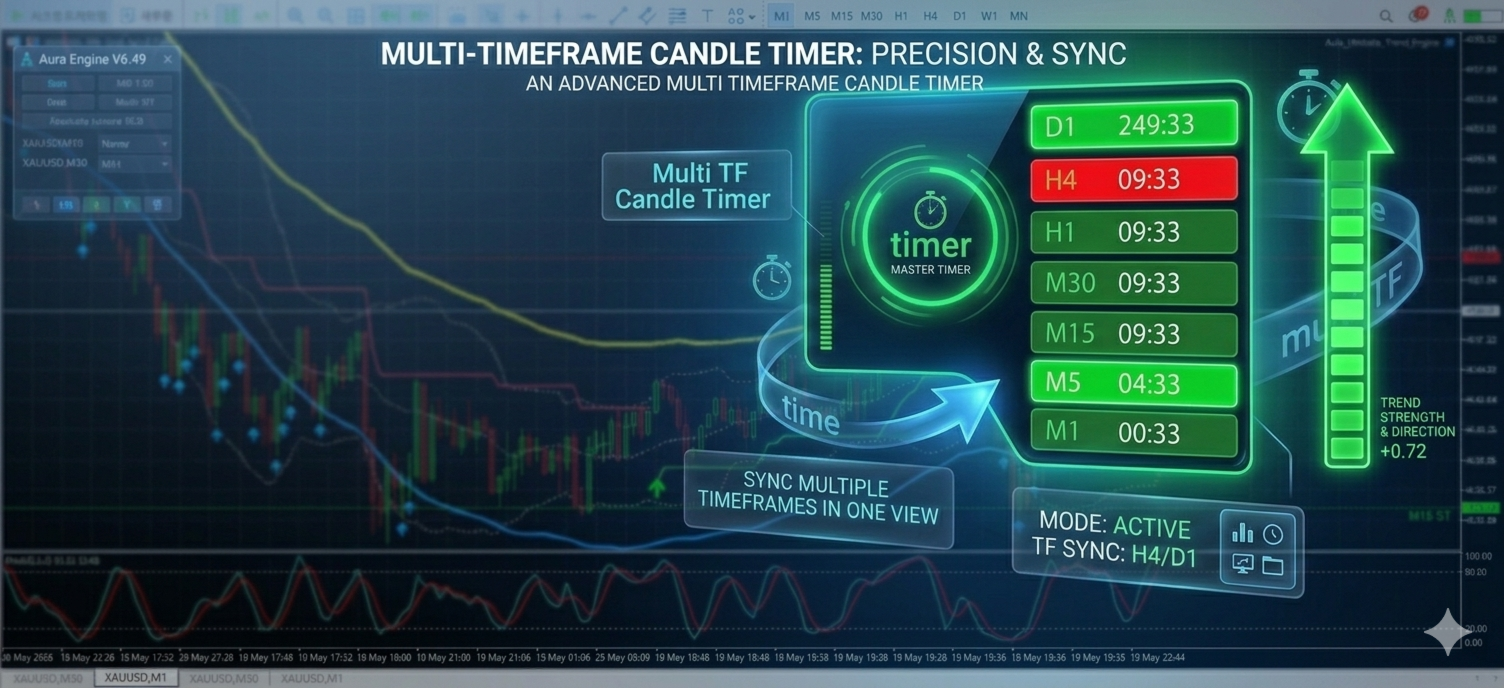
Multi Candle Timer is a high-end digital signal dashboard indicator designed to allow intuitive and complete control of complex multi-timeframe (MTF) analysis within a single chart.
Going beyond simply listing indicators, it organically combines real-time candle directionality from minute to daily charts with remaining time before market close to capture key market momentum. In particular, this major update introduces the 'On-Chart Smart Control Panel,' which allows you to control the entire design with a single click on the chart, and 'Pixel-Perfect Alignment,' which does not allow for even a one-pixel error, providing overwhelming convenience and visual perfection.
💡 Your valuable reviews and 5-star ratings are our greatest source of motivation for continuous updates and the development of high-performance programs. Thank you!
1. 🆕 [NEW] On-Chart Smart Control Panel (On-Chart Smart UI)
You no longer need to bother opening the indicator settings window (F8). Control everything on your dashboard with a single click using the intuitive always-on-top mini-panel.
-
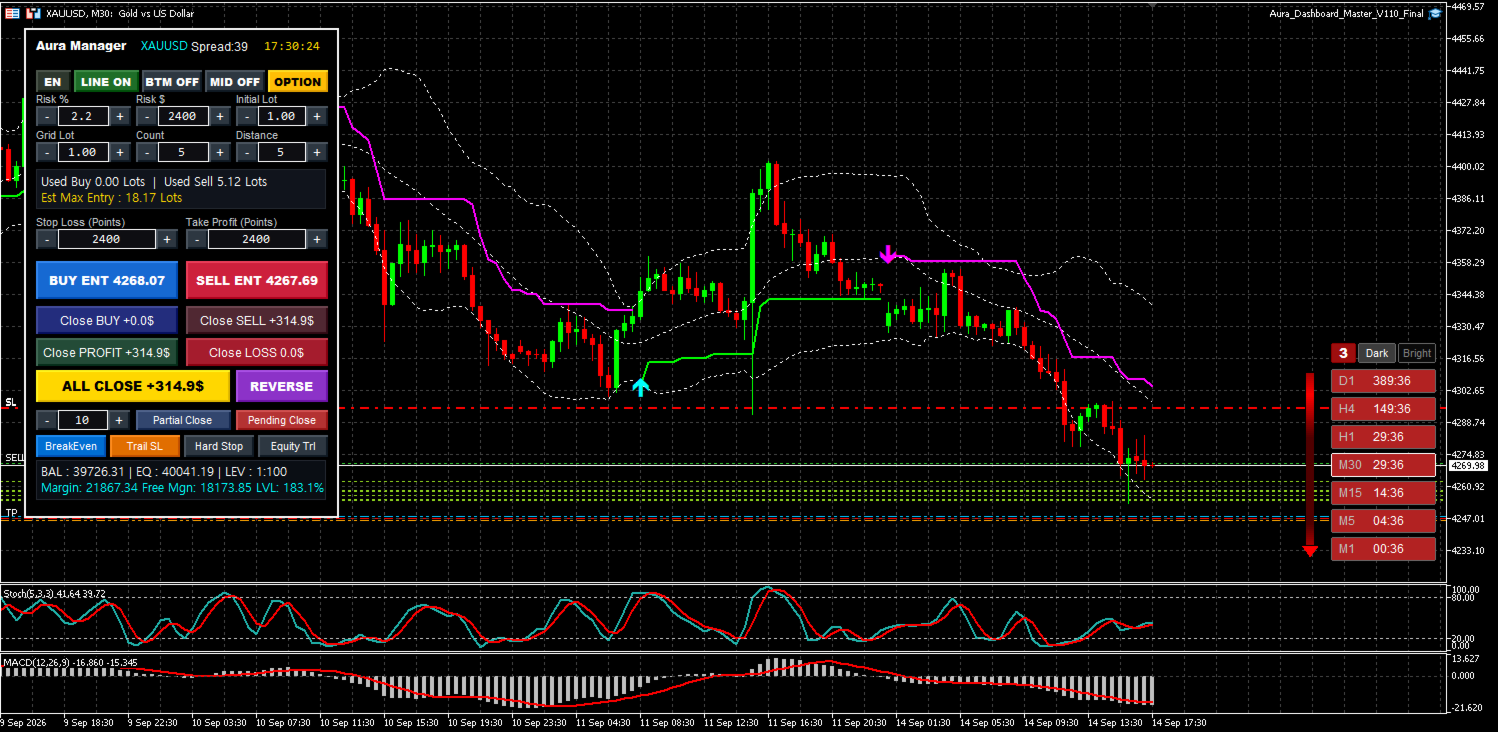
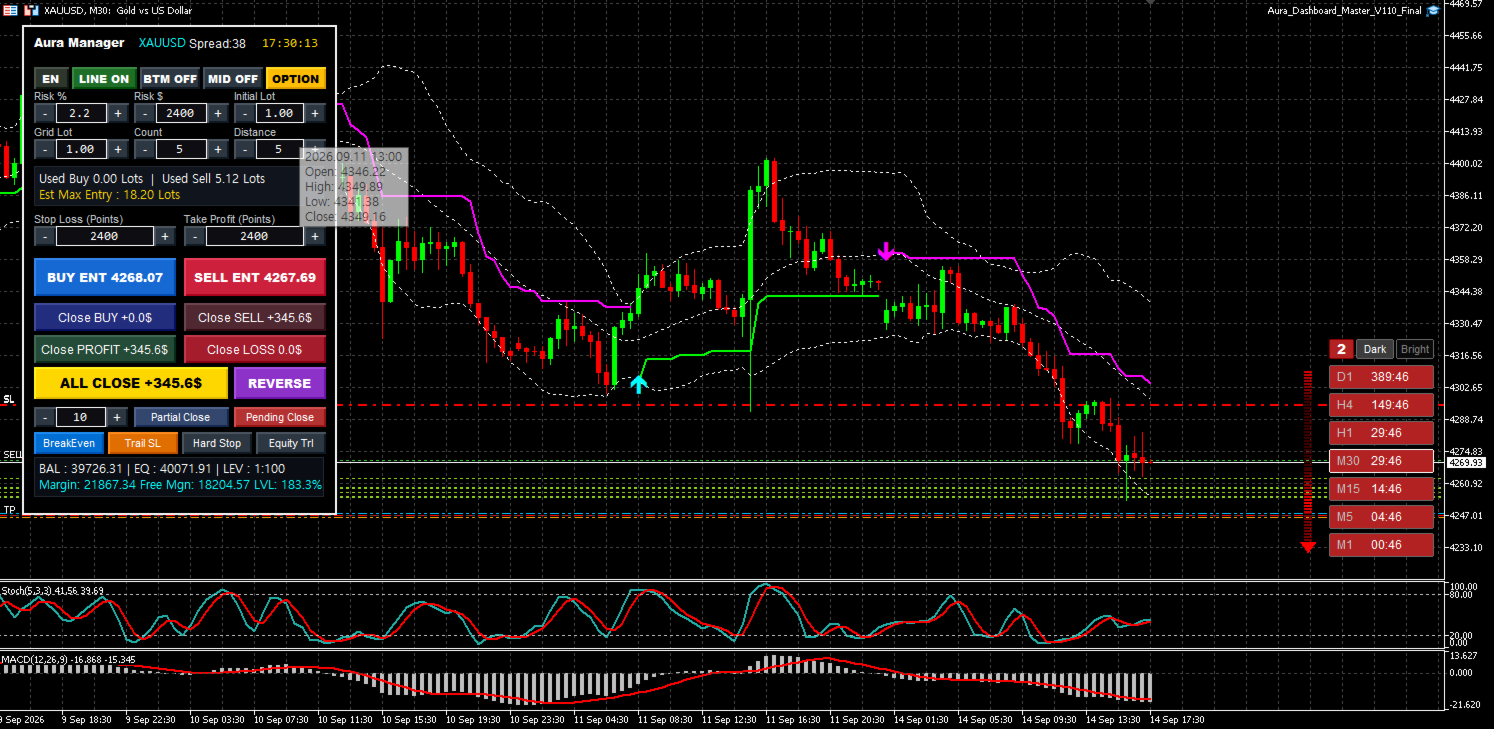
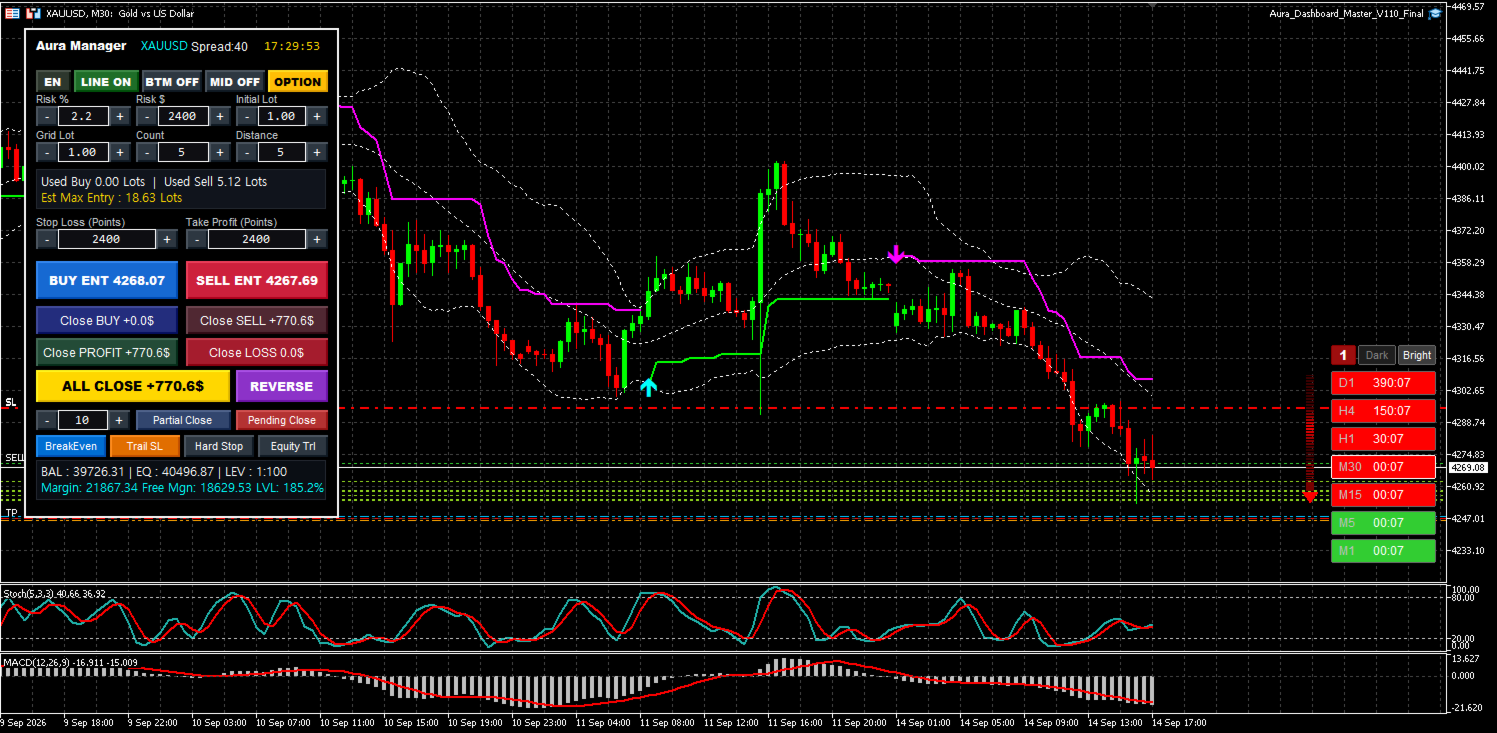
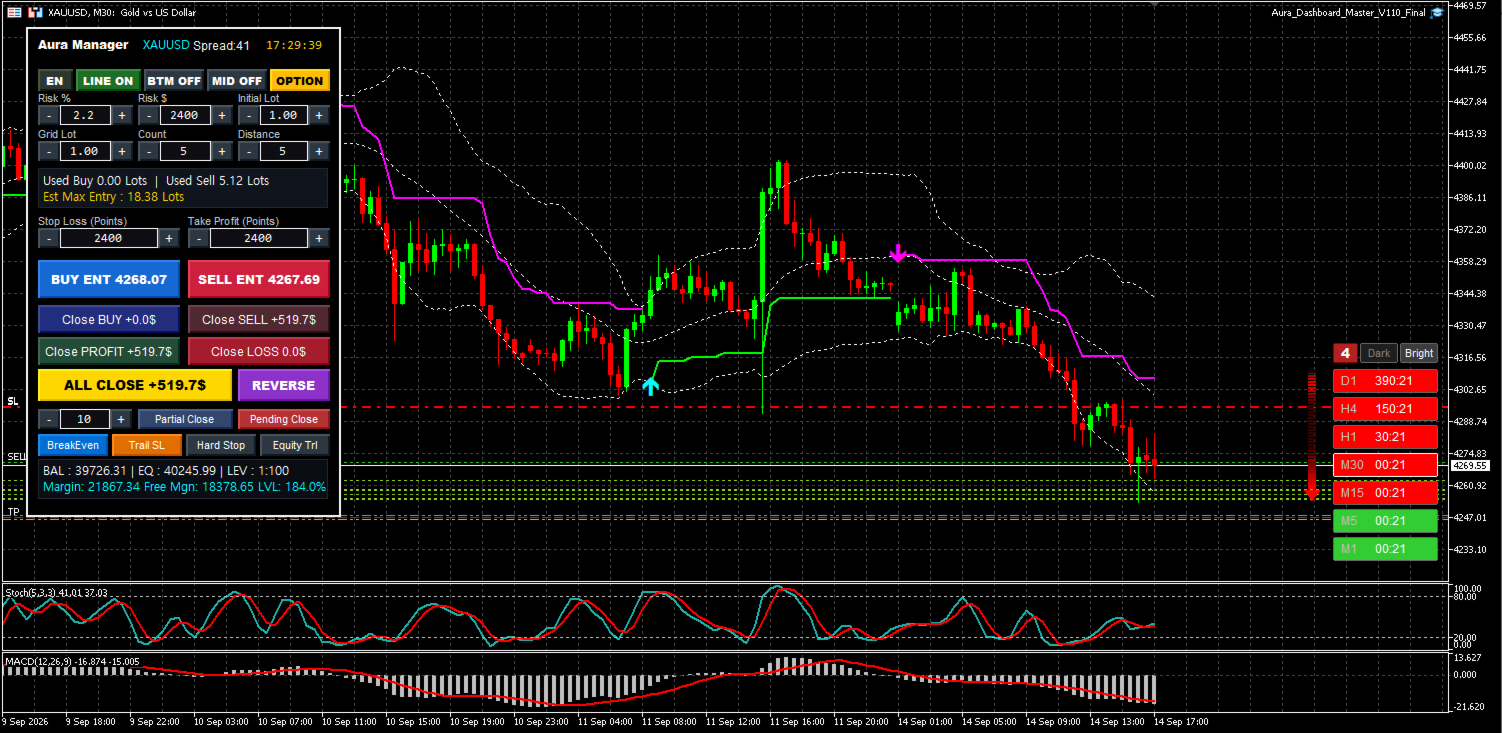
Style Quick Switch (1~4): Each time you click a number button, 4 premium arrow animation styles cycle through instantly.
-
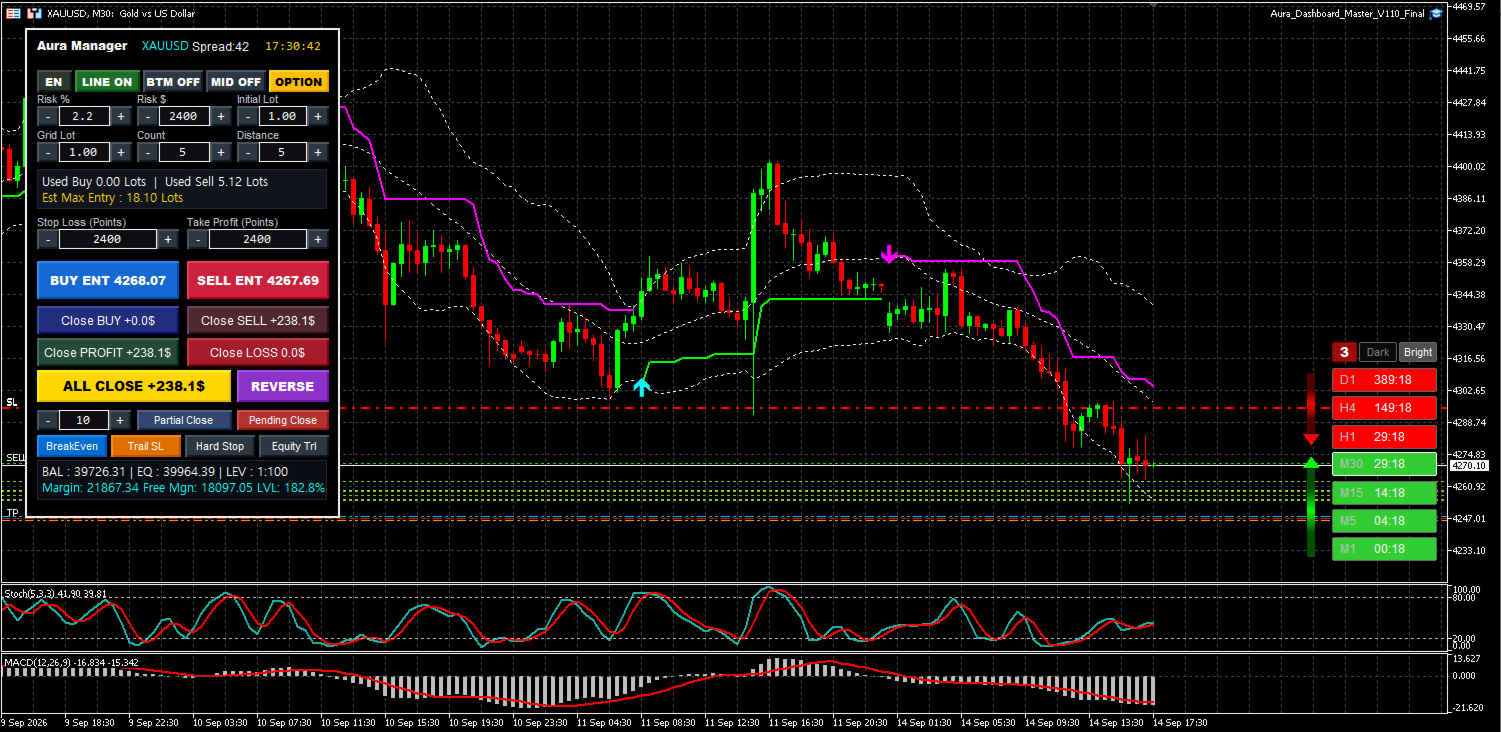
Theme Quick Switch (Dark / Bright): Instantly switch between the heavy Dark theme (Dark) that best suits the current chart background and the bright Bright theme (Bright).
-
Intuitive status display: The currently selected theme and option buttons are brightly highlighted in 3D, allowing you to grasp the current settings at a glance.
-
Smart Memory Integration: All settings changed by a click on the chart are retained even if you change the chart period or restart the terminal.
2. Key Premium Features
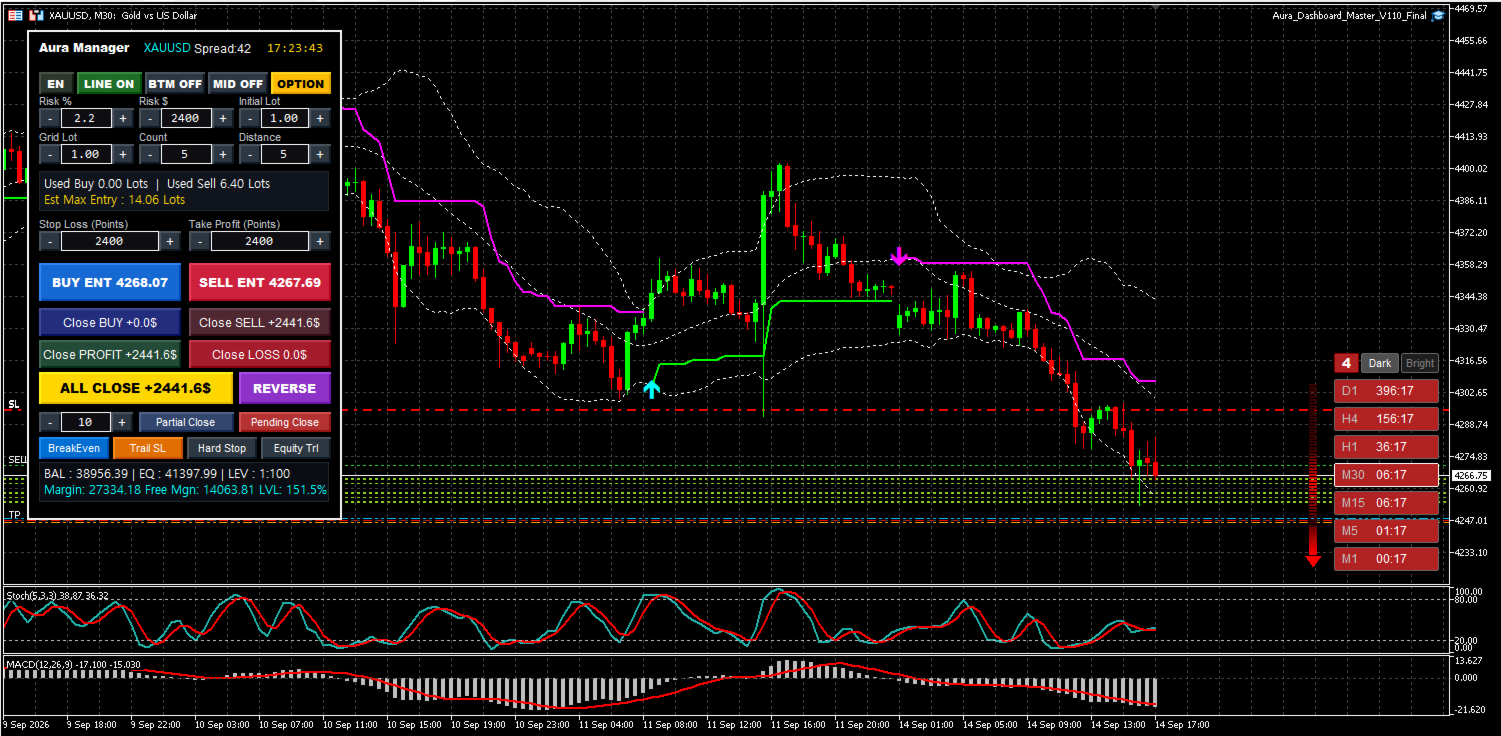
① 7-Timeframe Real-time Integrated Dashboard & Pixel Perfect Rendering The trend status of a total of 7 timeframes—D1, H4, H1, M30, M15, M5, and M1—is aligned in real-time. Notably, starting with this version, the horizontal and vertical baselines of the left-hand timeframe text and the right-hand countdown timer are center-aligned without a single pixel error, completely eliminating visual discomfort. You can collapse or expand the board with a single click using the smart toggle.
② Candle Time Countdown: The remaining time remaining to close for each candle in each timeframe is counted down in real-time in minutes:seconds (MM:SS). It maximizes entry precision by accurately predicting the confirmation time of candles in higher timeframes.
③ Dynamic Comet Trajectory Animation: Digital Flow Arrows. When the same trend matches across three or more consecutive timeframes, animated arrows appear to visually represent strong market liquidity. Designed so that waves of light flow naturally from the arrowhead (head) toward the tail (comet trajectory effect), they convey dynamism, and you can freely choose your desired effect from four styles (dense neckline, dot line, solid motion, color gradient).
3. Smart Internal Logic (Smart System Tech)
-
Perfect Object Independent Isolation (SSIG Prefix): The rendering engine is completely independently protected so that no graphic interference or deletion occurs even when overlaid with heavy third-party EAs or complex dashboards (such as Aura Dashboard).
-
Visually Flawless Rendering (Flat Border): Mathematically blocks overlapping between graphic elements (1px), preventing arrow colors from becoming dull or 3D borders from becoming blurred.
-
Ghost Incineration Engine: Tracks and incinerates excess objects in 0.01 seconds to ensure no ghosts of previous arrows remain, even in ultra-fast tick change environments.
4. How to Apply Trading Strategies (Strategy Application)
-
A. Multi-Timeframe Trend Alignment Trading: When entering on lower minute charts (M1, M5), entry is executed only when the upper timeframe board colors on the dashboard match, thereby blocking counter-trend risk.
-
B. Digital Flow Combination Entry Point: The moment a massive animated arrow signal appears when short- and long-term timelines combine marks the timing for a strong momentum surge. Utilize this as a powerful trigger for breakouts and trend following.
-
C. Time-limited Filtering: Use the countdown timer to refrain from chasing the price when the top candle closes, and target the moment when the dashboard colors align simultaneously with the creation of a new candle to increase the success rate of pullback entry.
5. User Settings (Inputs)
No complex setup is required. As soon as you drag and drop onto the chart, it processes terminal data and automatically builds the UI, and you can now control all design elements from the control panel above the chart.