Multi TF SuperTrend Map MT4

📈 Multi_TF_SuperTrend_Map Detailed Description

This product is an upgraded version of the previously developed Supertrend Pure MT5 - High-Precision Trend Follower.

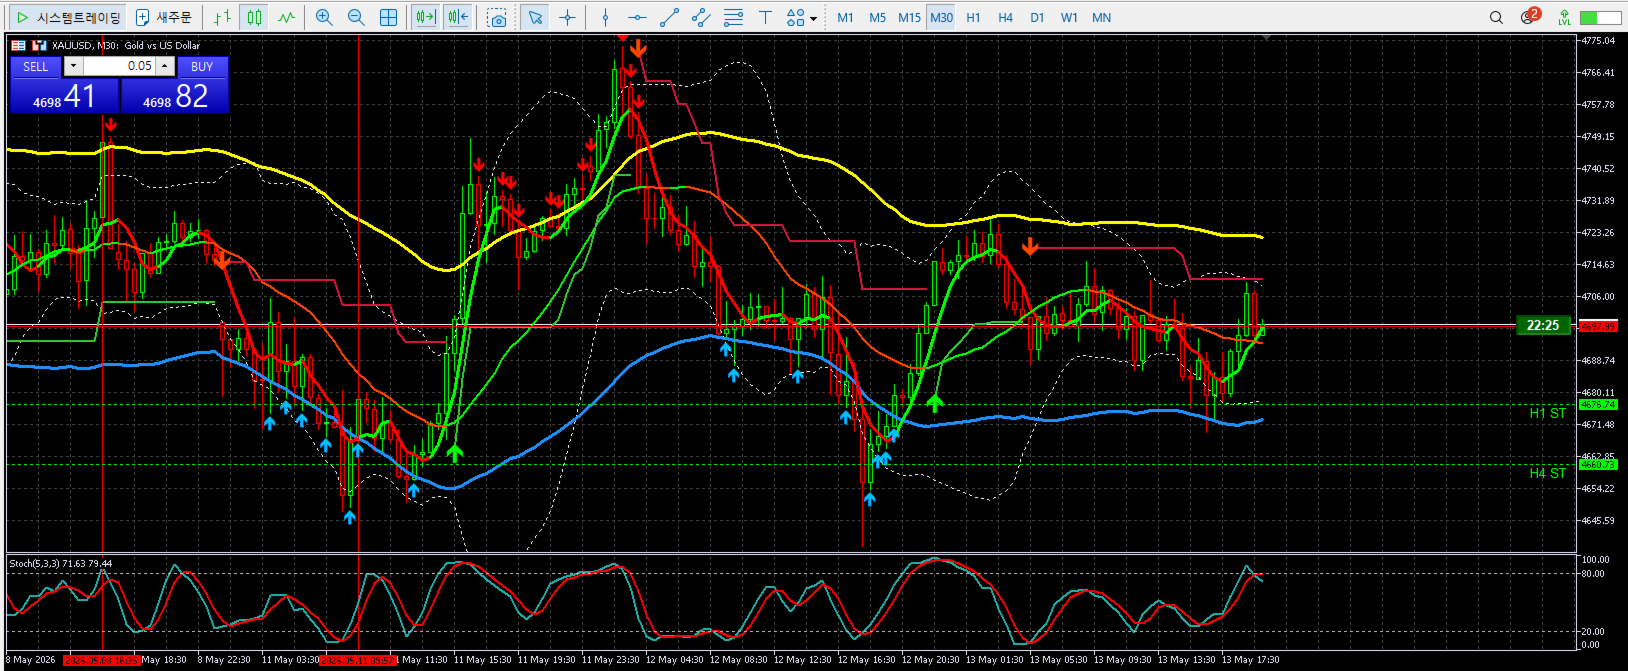
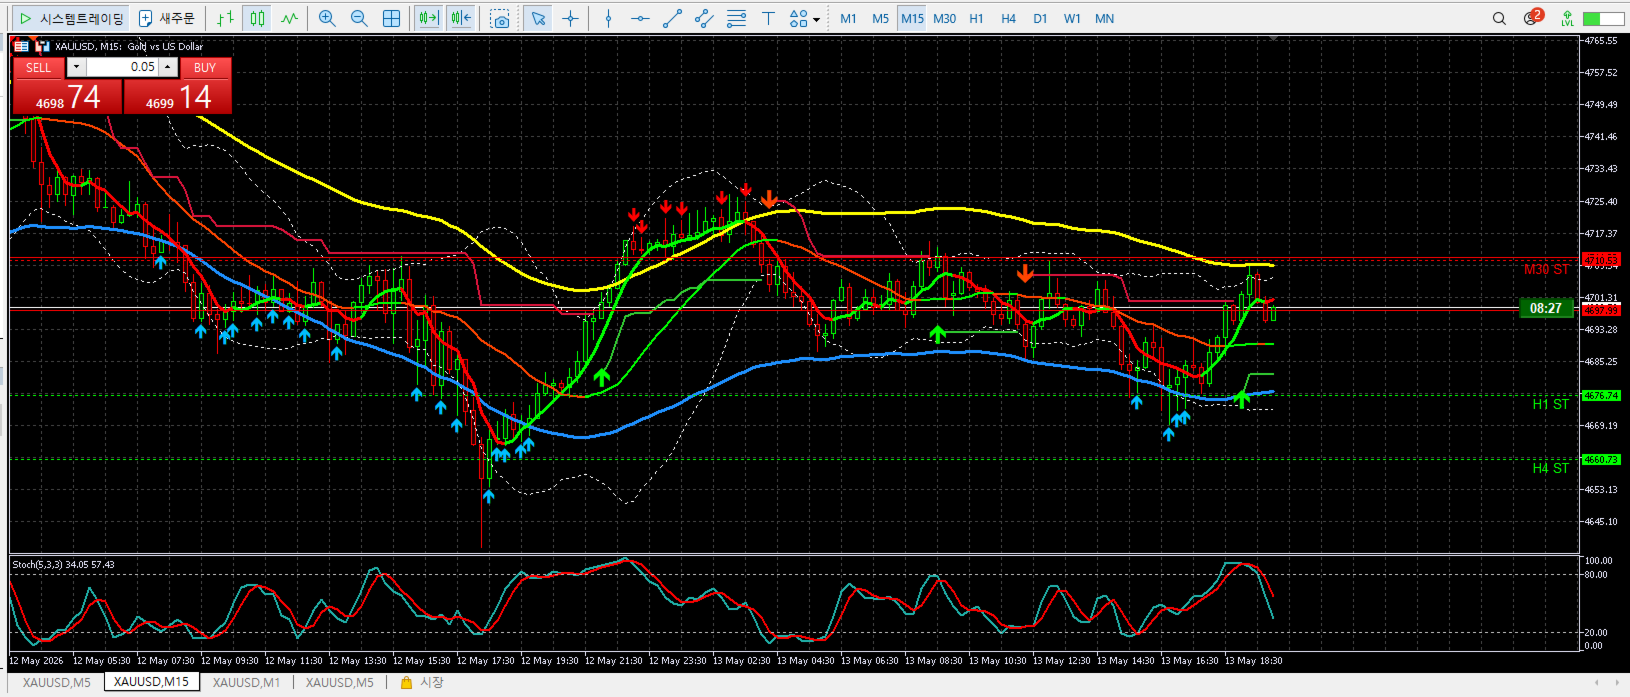
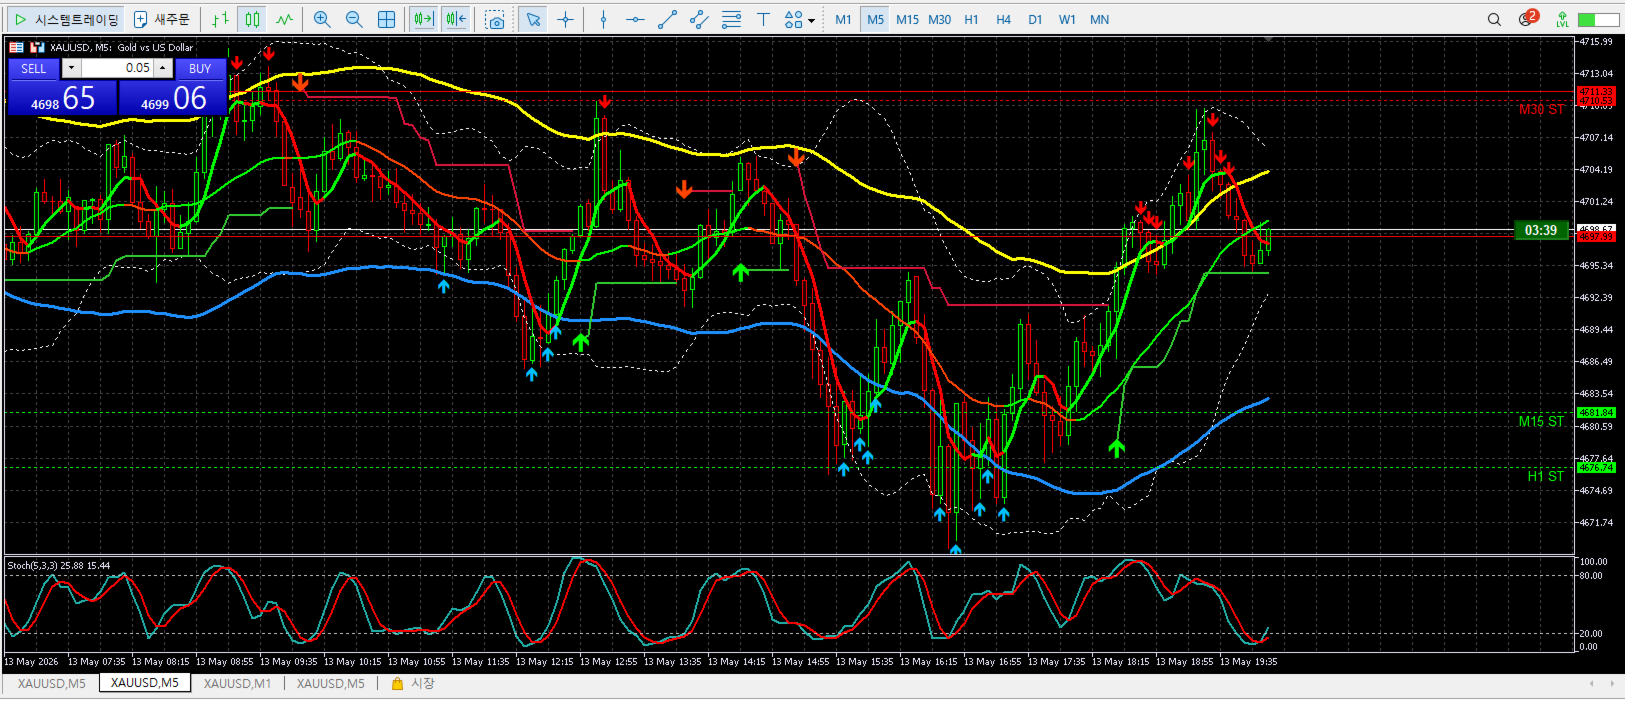
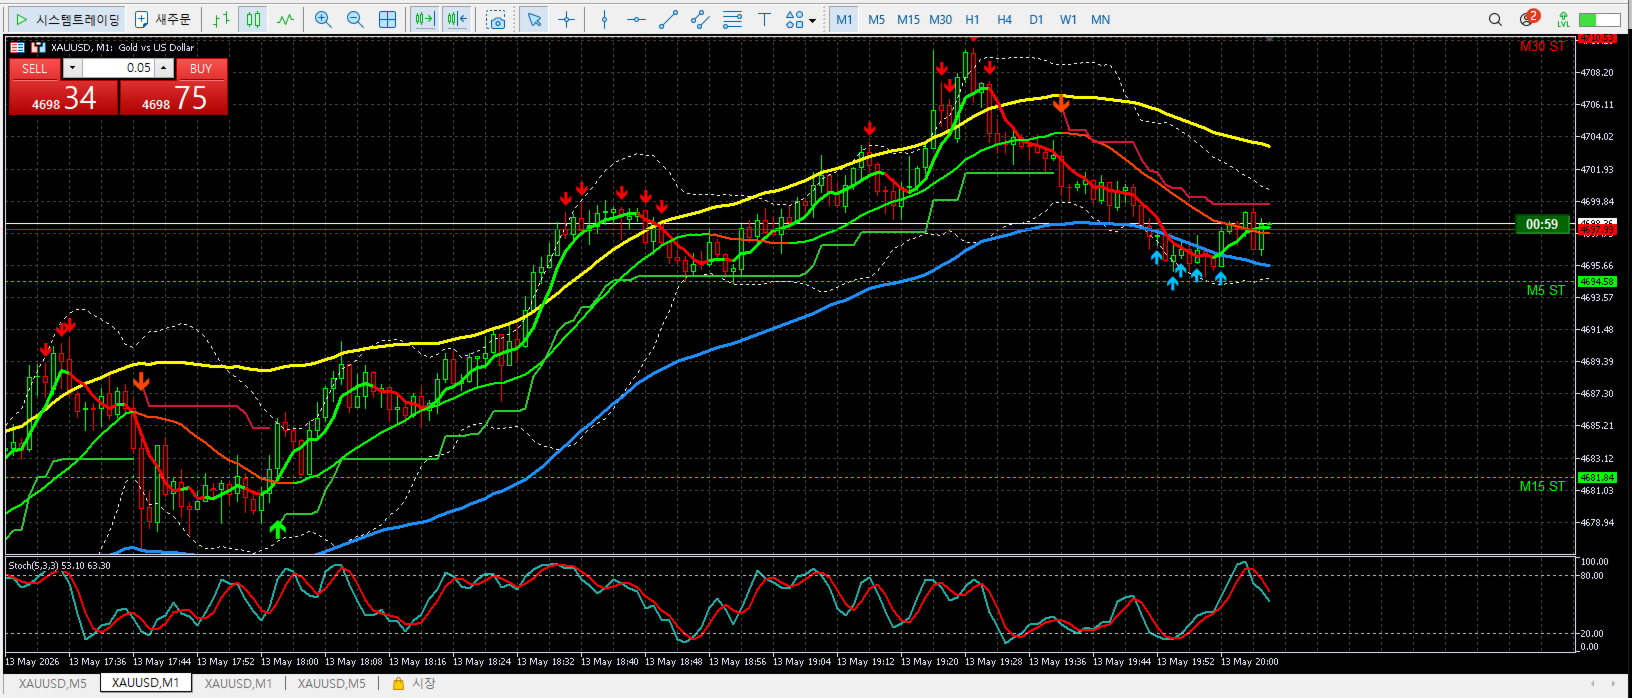
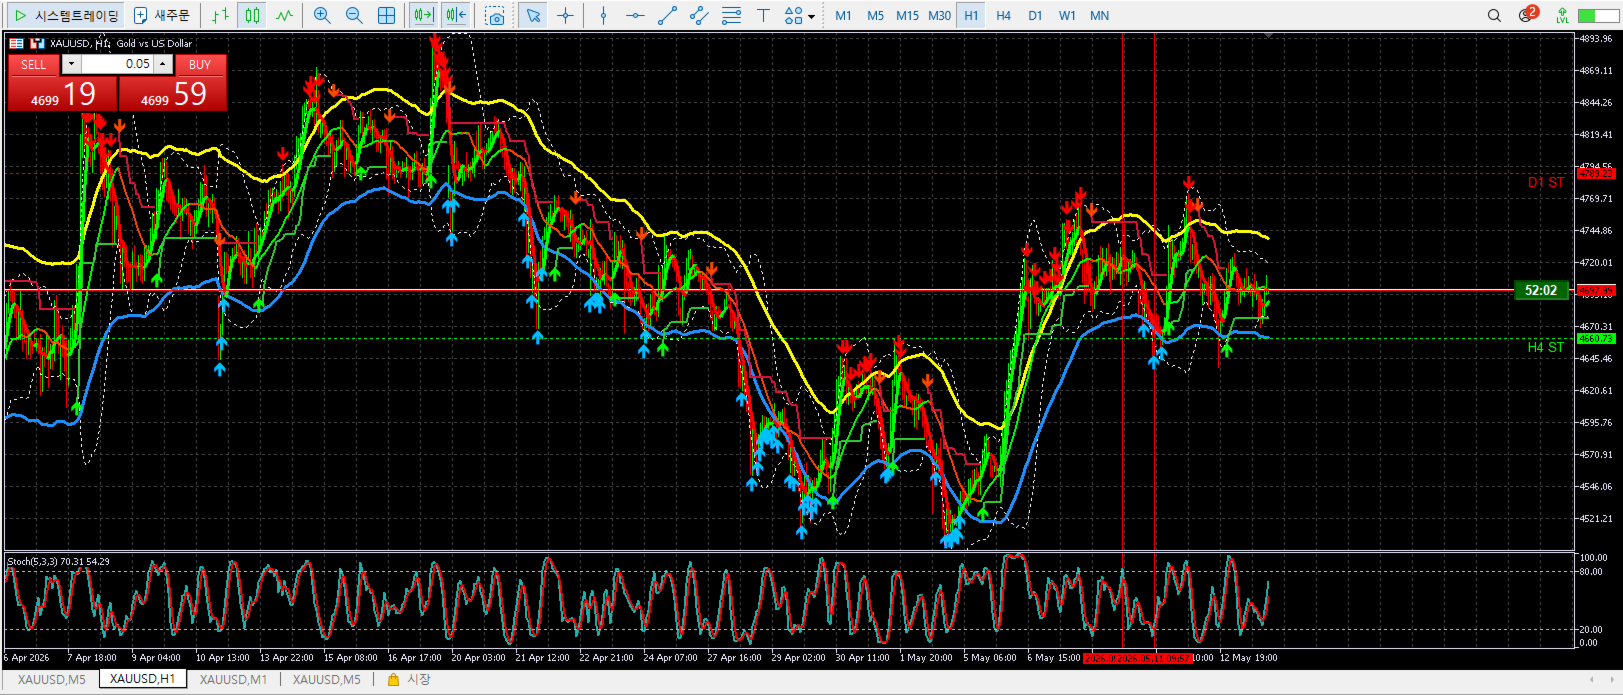
The previous product only displayed the Supertrend line shown in the current timeframe. However, the newly upgraded product displays not only the Supertrend of the current timeframe but also the Supertrend lines and times of higher timeframes. By showing detailed direction and limits—such as which direction the candles and trends are heading, or whether current support or resistance is strong—on a single page, it helps facilitate more intuitive and reliable trading.

Your reviews and comment scores are the driving force behind our continued development of this program. Thank you.

Multi_TF_SuperTrend_Map

1. Core Concept of the Indicator

This indicator calculates the current price volatility based on ATR (Average True Range). Through this, it identifies the direction of the trend (upward/downward) and the critical point (horizontal dotted line) where the trend reverses. In particular, by displaying the threshold of the upper timeframe on the current chart, it enables trading that "sees the forest, not the trees."

2. Key Components and Functions

Current TF Supertrend Line & Signal: These are the main lines drawn in real-time on the chart and arrow signals generated when a trend reversal occurs.

MTF Dynamic H-Lines: Displays the Supertrend values ​​of upper timeframes, such as M5, M15, M30, H1, H4, and D1, in the form of horizontal dotted lines.

Right-Fixed Labels (Price-Tracking Labels): Displays the timeframe name (e.g., D1 ST) at the end of each horizontal line and moves up and down in real-time according to price fluctuations.

Color Readability: If the current price is above the Supertrend of the corresponding timeframe, the line and text colors automatically change to Lime (Rising); if it is below, they change to Red (Falling).

3. Technical Logic (Internal Logic)

The indicator undergoes the following calculation process internally.

Median Price Calculation: The reference price is determined by calculating (High + Low + Close) / 3.

Volatility Offset: Calculate the ATR (10) * Multiplier (2.5–3.0) value to spread the line upwards and downwards from the reference price.

Trailing Stop: The line is kept horizontal until the price breaks through the previous upper and lower limits to eliminate unnecessary noise.

MTF Data Synchronization: Data from the upper TF is called using functions such as iClose and iATR to match it with the pixel coordinates of the current chart.

4. Practical Trading Strategies

① Trend Alignment Strategy

Strong Buy: When all timeframe labels (M5–D1) are green and located below the price.

Strong Sell: When all labels are red and located above the price.

② Strong Support and Resistance Lines

The Super Trend line of the upper timeframe (H4, D1) acts as a very strong final line of defense.

Even if the short-term trend reverses, if it rebounds from the upper TF line, it is highly likely to be a simple pullback.

③ Signal Filtering

Even if a buy arrow appears on the current chart (M5), you should exercise caution if the lines on the upper charts (H1, H4) are above the price (in red), as this is likely a short rebound.

5. Settings Guide (Inputs)

InpATRPeriod (10): This is the period for measuring volatility. The shorter the value, the more sensitive it is; the longer the value, the less sensitive it is.

InpMultiplier (2.5~3.0): This determines the width of the trend line. As the value increases, the trend is maintained for a longer period, but entry signals may be delayed. In my experience, setting it to 2.5 was the most appropriate.
Recommended products
Visual Vortex Indicator MT4
AL MOOSAWI ABDULLAH JAFFER BAQER
Unleash the Power of Market Dynamics with the Vortex Indicator! The Visual Vortex Indicator is your advanced tool for decoding market trends, reversals, and momentum shifts. Priced at $65, this indicator provides a comprehensive view of market behavior, but it’s designed for you to fine-tune and optimize it according to your unique trading strategy. What Makes It Unique? The Vortex Indicator is based on a strategy that identifies directional movements and trend strength by analyzing key price d
Market Structure Zig Zag
Lesedi Oliver Seilane
4.66 (29)
Free Market structure zig zag to assist in price action trading the screenshots describe how to use and how to spot patterns new version comes with alerts, email alert and  push notification alert can be used on all pairs  can be used on all timeframes  you can add additional confirmation indicators the indicator shows you your higher high and low highs as well as your lower lows and lower highs  the indication makes price action analysis easier to spot.
FREE
This indicator softens the value of the RSI (Relative Strength Index) and reduces its volatility. You can use this indicator in your expert advisors, indicators and strategies. With this indicator, you don't need to have two indicators on the chart at the same time. For example, an RSI indicator and a Moving Average indicator If you have any questions or concerns, contact me.
FREE
Daily Index EA
Prasetyo Gunawan
The Daily Index EA is built on a straightforward yet effective strategy. While many traders constantly search for overly complex algorithms, fundamental market principles often yield the best results. One of these core concepts is continuous economic expansion. Historically, the global economy maintains an upward trajectory, directly benefiting key financial assets such as stock and index CFDs. Simply buying and holding these assets long-term sounds ideal, but high overnight financing fees (swap
The Magic MA Moving Average Indicator is a market analysis tool that has more than 30 types of moving averages that the trader can use to gauge the market trend. Among the types of moving averages that the trader can visualize are the most common MAs (SMA, EMA and SMMA), adaptive moving averages such as FRAMA and KAMA and other MAs based on innovative calculation and analysis methods such as LSMA, ZLEMA and others. The indicator is designed to display all these moving averages on a single cha
Supertrend Professional is an Expert Advisor for MetaTrader 4 based on the Supertrend indicator. It is designed for trend-following trading on German indices (GER30/GER40/DAX). FTMO Compliance The EA implements drawdown calculation according to prop firm rules (FTMO, The Funded Trader, etc.): - Daily Drawdown uses MAX(Balance, Equity) as calculation base, exactly as required by FTMO - Reference balance is automatically updated every day at midnight - Automatic closure of all positions when l
Powered by SVX Strategies Quant Team This indicator is a Smart Trend Regime Filter that changes its state based on internal market strength. Automated Trading Options: Stop guessing the trend. Use our official algorithms for automated execution: Copy "Friday Pulse" (Conservative) Copy "SVX AI Systems" (High Growth) HOW IT WORKS It fuses the smoothness of an EMA with the sensitivity of the RSI to filter out noise. Color Logic: Green Line: Bullish (RSI > 55). Buyers are in control. Red Line: Bea
FREE
Intel Trend
Tatiana Savkevych
Intel Trend is a forex trend indicator based on all the usual SAR, using differential calculus to generate a signal not directly from the price but from the derivative of the function. Also, when using the SAR indicator, the first point often changes, which is why the default parameter ShiftBar = 1. To skip the first baoa and read information directly from the second bar. If you set ShiftBar = 0, there will be perfect signals, but they are false. real signals for each timeframe and for each cur
GTAS FibTdi
Riviera Systems
GTAS FidTdi is a trend indicator using combination of volatility and potential retracement levels. This indicator was created by Bernard Prats Desclaux, proprietary trader and ex-hedge fund manager, founder of E-Winvest. Description The indicator is represented as a red or green envelope above or under prices. How to use Trend detecting When the envelope is green, the trend is bullish. When it is red, the trend is bearish. Trading Once a trade is opened, GTAS FibTdi shows retracement zones wh
FREE
The most effective signals generated by Ichimoku strategies. Ichimoku Trade Alarm is a supplement for Ichimoku Trade Panel and it shows the signals that Expert Advisor reacts to. Visualization of signals:  Price / Kijun sen cross - the candle body must be between Min_Candlestick_Body and Max_Candlestick_Body. The candle must close above / below Kijun sen, minimum in 1/3 of its body. Open candle must be located above / below Kijun sen. Chinkou span must be under the price of 26 periods in advanc
Interactive BB Matrix
Tsvetan Tsvetanov
2 (1)
This indicator displays Bollinger Bands signals for multiple symbols and multiple time frames. The signals are created as a simple ratios which represent the distance between the current price and the moving average measured in standard deviations. This way we create a very versatile and easy to use indicator which helps us to identify not only the strongest trends but also the most overbought and oversold conditions. Features Accurate signals in real time for multiple time frames and multiple
The Two Moving Averages indicator concurrently displays two Moving Averages with default settings in the main chart window: Green and Red lines that represent a short-term trend. You can change the moving average settings and colors. However, these parameters have been configured so that to allow trading on all timeframes. Take a look at how the Moving Averages lines can be used in a profitable multi-currency Trading Strategy on all time frames, that is also suitable for trading in your mobile t
RSI Currency Strength Meter uses RSI (Relative Strength Index) to monitor how strong a currency is, or in other words, if it's being bought or sold by the majority compared to the other currencies. It displays the strength-lines of the currencies of the pair (base and counter currency of the chart) with changeable solid lines. Also, you can add up to five additional currencies to the "comparison pool". If you want to look and compare, for example, EUR, USD and JPY, it will only look at the EURUS
Balanced Costing
Tatiana Savkevych
Balanced Costing - shows signals - can be used with an optimal risk factor. The indicator can be used both for pipsing on small periods and for long-term trading. The Balanced Costing trend indicator uses reliable algorithms in its calculations. Shows favorable moments for entering the market with arrows, that is, using the indicator is quite simple. Works on all currency pairs and on all timeframes. Of course, the approach to trading should be complex and in order to make a decision, you shou
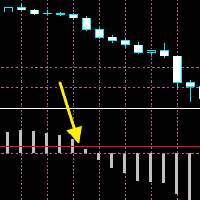
The moment when the MACD line crosses the signal line often leads to a significant price movement and trend changes. MACD Cross Prediction is an indicator that uses OSMA(MACD oscillator) and a red line. You can change the level of the red line on the indicator setting popup(and the red line moves up and down). The alerts(email, mobile push, sound, MT5 alert) will be sent when the MACD histogram touches the red line, which means the alerts can be sent just before/around the time when the MACD lin
ST Rsi2
Curtis Daniel Jr -
5 (1)
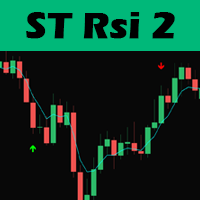
Hello traders, this trading strategy is based on the the Larry Connors RSI-2 strategy, We begin with a 200 periods EMA to find the direction of the market. This is important because we only trade in the main trend direction. We then look for pull backs using the RSI with a period of 2 to get entry signals. Trades are then exited using the 5 EMA. Lot size should be calculated using 1% of 1 the ATR value and positions can be added as long as the entry criterion is met. TRADING IS RISKY AND I D
FREE
Introduction To Turning Point Indicator The trajectories of Financial Market movement are very much like the polynomial curvatures with the presence of random fluctuations. It is quite common to read that scientist can decompose the financial data into many different cyclic components. If or any if the financial market possess at least one cycle, then the turning point must be present for that financial market data. With this assumption, most of financial market data should possesses the multipl
Introduction to GARCH Indicator GARCH is the short initial for Generalized Autoregressive Conditional Heteroskedasticity and it is the volatility prediction model commonly used in financial industry. GARCH model was first appeared in the work by Danish Economist, Tim Peter Bollerslev in 1986. The 2003 Nobel Prize winner, Robert F Engle also added much contribution for the refinement of GARCH model with Tim’s work. Our GARCH INM predictor took the original method of Nelder Mead for GARCH model bu
FREE
Divergence Matrix Pro for MetaTrader 4 Divergence Matrix Pro is a confirmed multi-oscillator divergence indicator for MetaTrader 4. It detects regular and hidden divergence between price and selected oscillators, then presents the confirmed structure through divergence lines, pivot labels, action markers, an optional current-timeframe Matrix Panel and optional alerts. The indicator is an analysis and confirmation tool. It does not open or close trades, and the signal score is not a win rate or a
RaysFX DMI Presentiamo l’Oscillatore RaysFX DMI, un indicatore personalizzato per la piattaforma di trading MetaTrader 4. Questo indicatore unico è progettato per fornire segnali di trading chiari e precisi basati sull’Indice di Movimento Direzionale (DMI). Caratteristiche principali: Oscillatore DMI:   Calcola un oscillatore DMI basato su un periodo DMI specificato e un metodo di media mobile. Smoothing:   L’oscillatore DMI viene ulteriormente lisciato in base a un periodo di lisciatura e a un
Elliott Wave Trend was designed for the scientific wave counting. This tool focuses to get rid of the vagueness of the classic Elliott Wave Counting using the guideline from the template and pattern approach. In doing so, firstly Elliott Wave Trend offers the template for your wave counting. Secondly, it offers Wave Structural Score to assist to identify accurate wave formation. It offers both impulse wave Structural Score and corrective wave Structure Score. Structural Score is the rating to sh
The indicator of a Professional Trader is an arrow indicator for predicting the direction of price movement. I have been working on this indicator since 2014. You can use this indicator as your main indicator, use its entry signals, and use it as your only indicator to find entry points. About the product: Recommended TF [H4-D1-W1]   . The indicator predicts the direction of the next candle. Fits a variety of tools; Flexibility in settings for different instruments and intervals through the MO
FREE
Pip Titan
Maydilu Isidra Hart
PipTitan is a state-of-the-art Expert Advisor (EA) designed for MetaTrader 4, meticulously crafted to enhance your trading performance with precision and reliability. Harnessing the power of advanced technical analysis and automated trading strategies, PipTitan takes your trading to the next level with its robust features and unparalleled accuracy. Key Features: Automated Price Monitoring: Continuously monitors market prices to trigger subsequent trades at optimal levels. User-Friendly Customiz
Trendiness Index
Libertas LLC
5 (3)
"The trend is your friend" is one of the best known sayings in investing, because capturing large trendy price movements can be extremely profitable. However, trading with the trend is often easier said than done, because many indicators are based on price reversals not trends. These aren't very effective at identifying trendy periods, or predicting whether trends will continue. We developed the Trendiness Index to help address this problem by indicating the strength and direction of price trend
Tin
Maryna Shulzhenko
The Tin indicator is designed to visually display the current trend in the market. One of the key aspects of foreign exchange market analysis is to determine the trend, which is the sustainable direction of price movement. To do this, the Tin indicator uses algorithms that smooth out sharp fluctuations that do not have a significant impact on the overall trend. A trend can be either upward (bullish) or downward (bearish). Typically, a trend persists for a long time before abruptly changing dir
Nice Trade Point
Muhammed Emin Ugur
This    Nice Trade Point     indicator is designed for signal trading. This indicator generates trend signals. It uses many algorithms and indicators to generate this signal. It tries to generate a signal from the points with the highest trend potential. This indicator is a complete trading product. This indicator does not need any additional indicators. The indicator certainly does not repaint. The point at which the signal is given does not change.     Features and Suggestions Time Frame
FC Panel Cruce de MA
Francisco Juan Cardenes Gil
Moving Average Crossover (v1.00) is a technical analysis and dynamic control tool for MetaTrader 4 designed to monitor market trends through the interaction of two moving averages, allowing you to modify all operational parameters directly on the chart without opening indicator settings windows. General Description of Panel Options Moving Average Controls (Rows 1 & 2) Period Selectors (-10, -1, +1, +10): Quickly increase or decrease the calculation period in individual steps or tens. Period Valu
FREE
The Range Directional Force Indicator is designed to help traders analyze market trends, reversals, and directional strength. It focuses on price movements within defined ranges, identifying key moments when the market is gaining momentum or preparing for a shift. By dividing the chart into dynamic price ranges, the indicator detects critical support and resistance levels. It calculates the directional force of price movements, highlighting potential entry and exit points based on market sentim
Backtest with good trend detection results from January 2023 EURUSD Time frame: m15, m30, H1 AUDUSD Time frame: m15, m30 NASDAQ Time frame: m15 S&P 500 Time frame: m15, m30 XAUUSD Time frame: m30 BTCUSD Time frame: H4 These are just some of the assets tested (Please note that past results are no guarantee of future results). Note that this is not a complete strategy, you can use this indicator as an entry trigger after your analysis by setting stop loss and take profit values ​​that you deem
FREE
Pirate
Anatoliy Lukanin
3.9 (20)
Deposit :   from 100 deposit units Trading pairs: I recommend currency pairs: EURAUD, CHFJPY, EURCHF, EURGBP, AUDCHF, CADCHF, USDCHF. Trading period :  Any Account: You should use ECN-ECN.Pro accounts with five-digit quotes with a moderate size (spread). Parameters: USING - Choice, trading risk or fixed lot RISK/LOT - Lot Risk Value RESTORING_THE_BALANCE - Restoring balance* HOW_THE_RESET_WINDOW - Reset the Global Variable TAKE_PROFIT - Set profit STOP_LOSS - Set loss COUNT_BUY - The number of s
Buyers of this product also purchase
Trend SniperX MT4
Sarvarbek Abduvoxobov
5 (5)
Trend Sniper X is a multi-timeframe trend-following indicator for MetaTrader 5 that helps traders identify trend direction and potential reversal points with clarity and precision. For MT5: https://www.mql5.com/en/market/product/181101 Price Information: The current price is promotional and is subject to change as upcoming updates and new features are released. Code2Profit Channel Master the Market with Multi-Timeframe Analysis! How to Maximize Your Win Rate with Trend Sniper X: Key Rules & Sess
AW Prime Oscillator
AW Trading Software Limited
5 (1)
A combination of two oscillators. The first one displays the entry points, the second shows the current trend . The indicator can display oscillator signals by arrows in two modes, all fast oscillator signals or signals only in the direction of the current trend. It has a multi-timeframe panel and three types of signal notifications. Benefits: Suitable for day and scalping trading Trend filtering Simple and sensitive setup Multi-timeframe panel Suitable for integration into an advisor. Works on
SR Liquidity
Oleg Rodin
5 (2)
SR Liquidity is a trading indicator designed to reveal the hidden zones where market liquidity concentrates and price reacts most strongly. These special liquidity areas act as powerful support and resistance levels, giving you a clear map of where the market is most likely to reverse. Instead of drawing ordinary Support/Resistance lines, SR Liquidity analyzes real price behavior to detect the zones where buying and selling pressure accumulate. These are actually the pools of liquidity that driv

Trend Lines PRO
Roman Podpora
5 (1)
TREND LINES PRO    helps understand where the market is truly changing direction. The indicator shows real trend reversals and points where major players re-enter. You see   BOS lines   Trend changes and key levels on higher timeframes — without complex settings or unnecessary noise. Signals don't repaint and remain on the chart after the bar closes. VERSION MT 5     -     Reveals its maximum potential when paired with the   RFI LEVELS PRO  indicator What the indicator shows: Real shifts   tren
Atomic Analyst
Issam Kassas
5 (14)
Atomic Analyst — MetaTrader 4 For product questions, setup guidance, or technical support, message me directly here on MQL5. The indicator turns complex market calculations into simple visual signals, color-coded candles, trend readings, stop-loss levels, and multiple take-profit zones that traders can understand quickly and use in real market conditions. Main Trading Uses: Scalping and intraday trading: Designed for fast decision-making, clear arrows, alerts, candle colors, and structured entry
M1 Sniper
Oleg Rodin
4.97 (30)
M1 SNIPER  is an easy to use trading indicator system. It is an arrow indicator which is designed for M1 time frame. The indicator can be used as a standalone system for scalping on M1 time frame and it can be used as a part of your existing trading system. Though this trading system was designed specifically for short-term trading, it still can be helpful for all traders. This trading system can be used with any forex pair and time frame, though lower time frames are recommended from M1 up to M
Smart Trend Trading System is a chart indicator for MetaTrader 4 that brings trend information, entry and exit signals, and price levels into one workspace. It combines 10+ trading tools into one system, including trend detection, reversal zones, smart cloud, trailing stop logic, support and resistance, candle coloring, alerts, and multi-timeframe analysis. The system is designed to help you trade different market conditions: Trending markets: Identify the main trend, detect pullbacks, follow mo
PRO Renko System
Oleg Rodin
5 (31)
PRO Renko System is a highly accurate trading system specially designed for trading RENKO charts. The ARROWS and Trend Indicators DO NOT REPAINT! The system effectively neutralizes so called market noise giving you access to accurate reversal signals. The indicator is very easy to use and has only one parameter responsible for signal generation. You can easily adapt the tool to any trading instrument of your choice and the size of the renko bar. I am always ready to provide extra support to help
Currency Strength Wizard is a very powerful indicator that provides you with all-in-one solution for successful trading. The indicator calculates the power of this or that forex pair using the data of all currencies on multiple time frames. This data is represented in a form of easy to use currency index and currency power lines which you can use to see the power of this or that currency. All you need is attach the indicator to the chart you want to trade and the indicator will show you real str
Trading Special –40% OFF Best Solution for any Newbie or Expert Trader! This Indicator is a unique, high quality and affordable trading tool because we have incorporated a number of proprietary features and a new formula. With only ONE chart you can read Currency Strength for 28 Forex pairs! Imagine how your trading will improve because you are able to pinpoint the exact trigger point of a new trend or scalping opportunity? User manual: click here That's the first one, the original! Don't buy a
Scalper Vault
Oleg Rodin
5 (40)
Scalper Vault is a powerful, fully-equipped trading system designed for traders who want to achieve consistency in intraday trading . This high-precision indicator serves as a complete, standalone trading system that delivers institutional-grade analysis for both Forex and Binary Options traders. PLEASE CONTACT ME AFTER PURCHASE TO GET MY TRADING TIPS PLUS A GREAT BONUS! By eliminating the guesswork and complex manual analysis, Scalper Vault allows you to focus purely on execution using easy t
This is a professional chart indicator designed for traders focused on stability and clear price action. It helps filter market noise and provides clear visual entry and exit zones for your trading decisions. Core Features: Strictly Non-Repainting: The system is built with strict non-repaint logic. What you see on the chart is the true historical performance. Confirmed Signals: Signals are triggered and confirmed only after the candle closes . Once a trading arrow appears on a closed candle, it
Currency Strength Exotics
Bernhard Schweigert
4.88 (33)
CURRENTLY 20% OFF ! Best Solution for any Newbie or Expert Trader! This Indicator is specialized to show currency strength for any symbols like Exotic Pairs Commodities, Indexes or Futures. Is first of its kind, any symbol can be added to the 9th line to show true currency strength of Gold, Silver, Oil, DAX, US30, MXN, TRY, CNH etc. This is a unique, high quality and affordable trading tool because we have incorporated a number of proprietary features and a new formula. Imagine how your trading
Liquidity Scalper System: a liquidity-based trading system in indicator form. Most indicators only show an arrow, and the trader then has to decide where the stop goes, where the target is and whether the signal can be trusted at all. Liquidity Scalper System covers the full trade cycle: it finds liquidity pools, gives a signal when they are broken, immediately calculates Entry, Stop Loss and three targets, and shows statistics and out-of-sample test results on the panel. The system picks its o
Scalper Inside PRO
Alexey Minkov
4.74 (69)
Scalper Inside PRO helps you read the intraday trend and plan a trade before you enter the market. It is built around three exclusive strategies for a sharper read of the market. The moment a signal appears, the indicator evaluates market direction and calculates the key levels, so you see the potential entry, the expected stop-loss and several profit-taking levels in advance. Detailed performance statistics show how different instruments and strategies performed in history and help you pick ass
Miraculous Indicator Binary & Forex v3 StrategySafe Miraculous Indicator Binary & Forex v3 StrategySafe is a professional trading indicator designed for traders who want clear signals, powerful confirmation tools, and a structured way to analyze both Binary and Forex markets. This version brings a stronger trading experience with advanced dashboards, GANN Law analysis, Square of 9 levels, angle confirmation, and a clean StrategySafe approach that helps traders filter stronger setups instead of e
Trend Catcher ind
Ramil Minniakhmetov
5 (11)
TREND CATCHER INDICATOR Trend Catcher Indicator analyzes market price movements, using a combination of the author’s proprietary and customized adaptive trend-analysis indicators.  It identifies the true market direction by filtering out short-term noise and focusing on underlying momentum strength, volatility expansion, and price structure behavior.  It also uses a combination of smoothing and trend-filtering customized indicators such as moving averages, RSI, and volatility filters.   Real ope
ICT Pro 4
Robby Suhendrawan
Ultimate AIO ICT Concept Indicator for MT4 Master Smart Money Concepts Automatically Are you tired of spending hours manually charting your screens every single day? The AIO ICT Concept indicator is your complete all-in-one solution for mastering Smart Money Concepts. Designed to eliminate the guesswork and emotional fatigue of manual technical analysis, this powerful algorithmic tool automatically maps out the most critical price action elements right on your chart. Master Market Direction and
Volume Orderflow Profile
Suvashish Halder
5 (2)
Introducing Volume Orderflow Profile , a versatile tool designed to help traders visualize and understand the dynamics of buying and selling pressure within a specified lookback period. Perfect for those looking to gain deeper insights into volume-based market behavior! MT5 Version -  https://www.mql5.com/en/market/product/122657 The indicator gathers data on high and low prices, along with buy and sell volumes, over a user-defined period. It calculates the maximum and minimum prices during this
"The Squeeze indicator attempts to identify periods of consolidation in a market. In general the market is either in a period of quiet consolidation or vertical price discovery. By identifying these calm periods, we have a better opportunity of getting into trades with the potential for larger moves. Once a market enters into a "squeeze," we watch the overall market momentum to help forecast the market direction and await a release of market energy." Modified TTM Squeeze Indicator is a modifica
Day Trader Master is a complete trading system for traders who prefer intraday trading. The system consists of two indicators. The main indicator is the one which is represented by arrows of two colors for BUY and SELL signals. This is the indicator which you actually pay for. I provide the second indicator to my clients absolutely for free. This second indicator is actually a good trend filter indicator which works with any time frame. THE INDICATORS DO NOT REPAINT AND DO NOT LAG! The system is
Gann Made Easy
Oleg Rodin
4.84 (172)
Gann Made Easy is a professional and easy to use Forex trading system which is based on the best principles of trading using the theory of W.D. Gann. The indicator provides accurate BUY and SELL signals including Stop Loss and Take Profit levels. You can trade even on the go using PUSH notifications. PLEASE CONTACT ME AFTER PURCHASE TO GET TRADING  INSTRUCTIONS   AND GREAT EXTRA INDICATORS  FOR FREE! Probably you already heard about the Gann trading methods before. Usually the Gann theory is a
ZoneFusion Pro Institutional Cluster System ZoneFusion Pro is a professional grade trading indicator built for serious forex traders, prop firm challenge traders, and Smart Money Concepts traders who want structured, high probability market entries based on institutional logic. This system combines SMC, multi timeframe market structure, demand and supply zones, and moving average confluence into one clean execution framework designed to remove guesswork from trading. CORE FEATURES Multi Timefram
Pips Generator
Oleg Rodin
4.6 (10)
Apollo Pips Generator  is a channel based indicator which provides entry signals in the direction of the trend. The indicator provides multiple entry points so you can always find a trading opportunity to profit on. The tool also provides you with clear exit signals in a form of stars. ALL SIGNALS DO NOT REPAINT! The indicator can be used with any forex pair and time frame. The indicator provides all types of alerts including PUSH notifications. PLEASE CONTACT ME AFTER PURCHASE TO GET TRADING IN
All in One package includes the  Oscillator Predictor ,  MACD Predictor ,  Thrust Scanner  and  Advanced Fibonacci  indicators which are mandatory for applying  Dinapoli  trade plans.  Please visit below links for detailed explanations of indicators. Advanced Fibonacci Indicator =>  https://www.mql5.com/en/market/product/52834 Thrust Scanner Indicator => https://www.mql5.com/en/market/product/52830 Overbought /Oversold Predictor indicator => https://www.mql5.com/en/market/product/52621 Macd P
Indicator plots price cycle blocks and sends signals with smart volume confirmation. Price cycles and fractals are combined to determine the demand/supply blocks. The indicator can be used alone or combined with other Cycle Indicators Inputs: Period: Recommended value is between 35 and 55( Which are Set 1 and Set 2 periods of cycle sniper ) Engulfing: If true, you will be able to see the engulfing bar confirmation. Volume Filter: True (The  arrow comes with volume confirmation ) Videos with dif
GoldRush Trend Arrow Signal V1.6 The GoldRush Trend Arrow Signal indicator V1.6 continues to provide precise, real-time trend analysis tailored for high-speed, short-term scalpers in XAU/USD , but it now has additional features and improved efficiency and reliability. Built specifically for the 1-minute time frame, this tool displays directional arrows for clear entry points, allowing scalpers to navigate volatile market conditions with confidence. The indicator consists of PRIMARY and SECONDARY
Alright. This indicator works on MT4 and is very easy to use. When you receive a signal from it, you wait for that candle with the signal to close and you enter your trade at the beginning of the next new candle. A red arrow means sell and a green arrow means buy. All arrows comes with a long dotted like for easy identification of trade signal. Are you okay with that?   100% non repaint Work All Major currency  Pair,  1 minute time frame 1 minute expire
Neuro Poseidon MT4
Daria Rezueva
4.74 (46)
Neuro Poseidon is a new indicator by Daria Rezueva. It combines precise trading signals with adaptive TP/SL levels - creating best possible trades as a result! Message me and get  Neuro Poseidon Assistant  as a gift to automize your trading process! What makes it stand out? 1. Proven profitability on all assets and timeframes 2. Only confirmed BUY and SELL signals present on the chart 3. Adaptive TP & SL levels generated by the software for each trade 4. Easy to understand - suitable for all
Extreme Value Sniper is a detrended price indicator  Indicator finds the potential reversal levels by checking value ranges and price cycles. MT5 Version of the product :  https://www.mql5.com/en/market/product/114550 It shows the overbought and oversold levels using the average range. Overbought Levels are between 4 and 10 Oversold levels are bewtween -4 and -10 Those levels can be used as a reversal levels. Extreme Value Sniper look for some special divergence and convergence patterns to c
More from author
MT5 Supertrend Pure
Dae Shik Kim
4.83 (6)
Supertrend Pure MT5 - High-Precision Trend Follower Your reviews, comments, and scores are a great source of encouragement for me as I work on the program. Thank you. [Product Description] Supertrend Pure is the cleanest and most powerful trend indicator focused on the essence of trading. By eliminating complex settings and utilizing mathematically optimized Average True Range (ATR) calculations, it removes market noise and captures only the true trend. Key Features: Pure Algorithm: Provid
FREE
Supertrend Pure MT5 - High-Precision Trend Follower Your reviews, comments, and scores are a great source of encouragement for me as I work on the program. Thank you. [Product Description] Supertrend Pure is the cleanest and most powerful trend indicator focused on the essence of trading. By eliminating complex settings and utilizing mathematically optimized Average True Range (ATR) calculations, it removes market noise and captures only the true trend. Key Features: Pure Algorithm: Provide
FREE
Global Session Timeline Dashboard MT5 The Global Session Timeline Dashboard is a utility indicator that displays the operating hours of major forex markets (Sydney, Tokyo, London, New York) directly on your chart. Through a draggable dashboard, users can monitor the current status of each session in real-time and individually control the visibility of session vertical lines on the chart. [Key Features] Interactive Dashboard: Provides a movable (draggable) panel within the chart that visualizes
FREE
"Reading the Essence of Trends Amidst Rough Waves: TMA Channel (Triangular Moving Average)" Have you ever suffered losses from chasing rising prices due to the countless noises and fake-outs flooding the market? The TMA Channel is an authentic trend indicator that goes beyond simple moving averages to visualize the 'true flow' of prices in the smoothest and clearest way. ※ Your reviews and comment scores are a great help in developing this program. Thank you. 1. TMA: Why Are Experts Enthusia
FREE
Aura Specialist V34: Sideways Market Precision Expert ※ Your reviews and comment scores are a great help in continuing to develop this program. Thank you. ※ This program is designed exclusively for highly volatile Gold (XAUUSD). While it enables stable operation even in volatile markets, it was specifically developed for those who struggle with managing sideways markets. Aura Specialist V34 is a high-performance algorithmic trading system designed to maximize profits by capturing subtle fluc
FREE
"Reading the Essence of Trends Amidst Rough Waves: TMA Channel (Triangular Moving Average)" Have you ever suffered losses from chasing rising prices due to the countless noises and fake-outs flooding the market? The TMA Channel is an authentic trend indicator that goes beyond simple moving averages to visualize the 'true flow' of prices in the smoothest and clearest way. ※ Your reviews and comment scores are a great help in developing this program. Thank you. 1. TMA: Why Are Experts Enthusia
FREE
[Product Name: Aura TMA Compound Master] The Pinnacle of Hybrid Trading: TMA Trend Following & Smart Grid Scaling System ※ Your reviews and comments provide great encouragement for the development of this program. Thank you. ※ This program is designed exclusively for the highly volatile Gold (XAUUSD). Do not use this bot for other currency pairs. ※ If you refer to the variable settings attached as an image, I believe you will experience stable trading results. Please do not invest more than 1
FREE
Master Manual: Complete Edition Aura HHLL   Platinum  V2.00 Integrated Manual This program is a tool that helps traders determine "what state the market is in right now?" most quickly amidst the complex movements of charts. It is the culmination of technical analysis combining the precision of price action with the intuitiveness of range trading. SECTION 01 Indicator   Key Components   Elements It provides the ability to read the structure of the market. 1. The System's 3 Core Axes HHLL Label
1. Product Name: Smart Multi-Timeframe MA (MTF MA) One-line Summary: An all-in-one trading solution that allows you to view moving average lines for 7 major timeframes in real-time on a single chart. 2. Product Description Traders must analyze multiple timeframes simultaneously to read the overall flow of trends. Smart MTF MA visually projects moving average lines from M1 to D1 onto the current chart without the hassle of switching charts, enabling you to grasp market trends across multiple
FREE
[English] Product Description CM Ultimate MA MTF V2 is a highly optimized, dual moving average technical indicator developed natively for MetaTrader 5. It displays two independent moving averages (Short-term and Long-term) on a single chart, featuring adaptive 3-color trend visualization to instantly track market momentum shifts. By utilizing high-performance Multi-Timeframe (MTF) technology, this indicator provides traders with clean, noise-filtered trend direction without introducing terminal
FREE
Aura Mini Candle Timer - Smart Interactive Edition Aura Mini Candle Timer is a lightweight indicator that intuitively displays the remaining candle time and current candle direction for multiple timeframes (MTF) while taking up minimal chart space. The core feature of this indicator is its interactivity. Without the need to open the indicator settings window, you can simply click the timer panel on the chart to cycle through 7 major timeframes in real-time. [Key Features] One-Click Timeframe Cy
FREE
Title: Global Session Timeline Dashboard Description: Global Session Timeline is a highly intuitive and interactive indicator designed to display the world's major Forex trading sessions (Sydney, Tokyo, London, New York) directly on your chart. It tracks your broker's server time to provide a real-time visual representation of active markets through an interactive dashboard and chart vertical lines. This tool is essential for traders who rely on session overlap strategies, volatility timing, an
FREE
Product Description CM Ultimate MA MTF V2 is a highly optimized, dual moving average technical indicator developed natively for MetaTrader 4. It displays two independent moving averages (Short-term and Long-term) on a single chart, featuring adaptive 3-color trend visualization to instantly track market momentum shifts. By utilizing high-performance Multi-Timeframe (MTF) technology, this indicator provides traders with clean, noise-filtered trend direction without introducing terminal lag. Ke
FREE
1. Product Name: Multi TF MA Overlay MT4 One-line summary: An all-in-one trading solution that allows you to view moving average lines for 7 major timeframes in real-time on a single chart. 2. Product Introduction (Description) Traders must analyze multiple timeframes simultaneously to read the major flow of the trend. Smart MTF MA visually projects moving average lines from M1 to D1 onto the current chart without the hassle of switching charts, allowing you to grasp the market's multi-timefr
FREE
Title: Global Session Timeline Dashboard MT4 Description: Global Session Timeline Dashboard is a highly intuitive and interactive indicator designed for MetaTrader 4. It visibly displays the world's major Forex trading sessions (Sydney, Tokyo, London, New York) directly on your chart. By tracking your broker's server time, it provides a real-time visual representation of active markets through a movable dashboard and vertical chart lines. This tool is essential for traders who rely on session o
FREE
Multi Candle Timer (MT4/MT5) — Premium Dashboard [Ultimate UI Edition] Multi Candle Timer   is a high-end digital signal dashboard indicator designed to allow intuitive and complete control of complex multi-timeframe (MTF) analysis within a single chart. Going beyond simply listing indicators, it organically combines real-time candle directionality from minute to daily charts with remaining time before market close to capture key market momentum. In particular, this major update introduces
[English] Product Description CM Ultimate MA MTF V4 Triple is a highly advanced, multi-timeframe (MTF) triple moving average indicator specifically re-engineered for the MetaTrader 4 (MT4) platform. It simultaneously tracks Short, Mid, and Long-term market trends on a single chart using an adaptive 3-color momentum-shading architecture. While MT4 traditionally limits indicators to a maximum of 8 buffers, this premium tool utilizes a proprietary virtual rendering engine to deliver a full triple-l
Multi_TF_SuperTrend_Map Detailed Description This product is an upgraded version of the previously developed Supertrend Pure MT5 - High-Precision Trend Follower. The previous product only displayed the Supertrend line shown in the current timeframe. However, the newly upgraded product displays not only the Supertrend of the current timeframe but also the Supertrend lines and times of higher timeframes. By showing detailed direction and limits—such as which direction the candles and trends
Multi Candle Timer (MT4/MT5) — Premium Dashboard [Ultimate UI Edition] Multi Candle Timer   is a high-end digital signal dashboard indicator designed to allow intuitive and complete control of complex multi-timeframe (MTF) analysis within a single chart. Going beyond simply listing indicators, it organically combines real-time candle directionality from minute to daily charts with remaining time before market close to capture key market momentum. In particular, this major update introduces
CM Ultimate MA MTF V2 Triple is a high-performance multi-timeframe (MTF) moving average indicator designed for MetaTrader 5. It plots three independent moving averages (Short, Mid, Long) on a single chart, each featuring dynamic 3-color trend visualization based on momentum changes. By calculating upper and lower slope shifts, this indicator helps traders identify trend alignments and filtering market noise without delayed execution. Key Technical Advantages 6-Buffer Dynamic Color Logic: Built
Master Manual: Complete Edition Aura HHLL   Platinum  V2.00 Integrated Manual This program is a tool that helps traders determine "what state the market is in right now?" most quickly amidst the complex movements of charts. It is the culmination of technical analysis combining the precision of price action with the intuitiveness of range trading. SECTION 01 Indicator   Key Components   Elements It provides the ability to read the structure of the market. 1. The System's 3 Core Axes HHLL Label
Filter:
No reviews
Reply to review