
META5 AlamTMA
- Indicators
- Version: 2.0
- Updated: 22 September 2026

"Reading the Essence of Trends Amidst Rough Waves: TMA Channel (Triangular Moving Average)"
Have you ever suffered losses from chasing rising prices due to the countless noises and fake-outs flooding the market? The TMA Channel is an authentic trend indicator that goes beyond simple moving averages to visualize the 'true flow' of prices in the smoothest and clearest way.
※ Your reviews and comment scores are a great help in developing this program. Thank you.
1. TMA: Why Are Experts Enthusiastic About 'Smooth Curves'?
Typical moving averages (SMA, EMA) give us false signals as they sharply decline at the slightest price spike. However, TMA utilizes a Double Smoothing technique to calculate the 'average of averages.'
Core Principle: By placing the greatest weight on the central value of the data, it ignores temporary sharp fluctuations (noise) and traces the 'average trajectory' of the price.
User Experience: Since the charts look much more organized, it helps traders reduce emotional trading and engage in 'patient trading' that conforms to the trend.
2. Powerful Strategic Advantages Unique to TMA Channels
If Bollinger Bands react overly sensitively and cause frequent stop-losses, TMA Channels offer the following solutions:
Fake-out Filtering: By filtering out fakes that appear to temporarily break out of the bands, it increases the probability of capturing signals only at true trend reversal points.
Clear Support and Resistance: Simply observing how the price reacts near the TMA centerline allows you to intuitively determine whether the current market is in a state of 'strong upside energy' or 'selling dominance.'
Psychological Stability: Because the curve is gentle, it prevents the mistake of selling impulsively while the trend is alive, or conversely, chasing the price too late.
3. How to Utilize TMA 100%: A Trading Guide to Boosting Profits
TMA is not simply an indicator to buy and sell when it is touched. Please check the following 3-step guide.
[Step 1. Confirming Trend Direction]
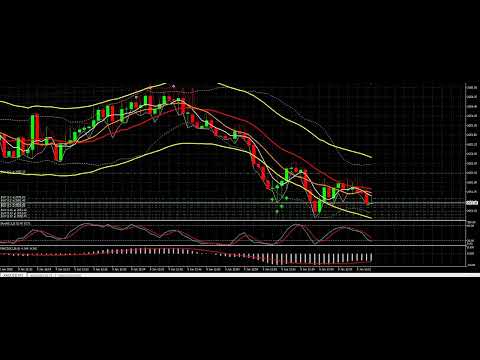
Is the TMA line trending upward? If so, look only for Buy opportunities near the lower band.
Is the TMA line trending downward? If so, look only for Sell opportunities near the upper band.
[Step 2. Multi-Timeframe Filter (Important!)]
When a signal occurs on a short timeframe (M5), check if the TMA direction of the upper timeframe (M30–H1) matches. This alone can filter out 70% of false signals.
[Step 3. Utilizing Overbought/Oversold]
The moment the price strongly breaks through the upper or lower band and then re-enters is the most powerful inflection point. Check the alarm signal that occurs at this moment and enter a trade.
4. Strongly recommended for these types of people! For those whose eyes get tired from charts with sharp fluctuations and who find it difficult to make trading decisions
For those who are stressed due to frequent stop-losses
For those who adhere to trend trading principles but struggle to pinpoint entry timing
※ A word from the developer
"Indicators are not a panacea. However, the TMA channel acts like a reliable lighthouse that protects your trading standards amidst the turbulent movements of the market. In the next update, we plan to include a powerful EA strategy that combines with TMA to maximize win rates, so please look forward to it!"
User Recommendation: "I recommend the default settings (Period 30, Atr 2.0, etc.), so beginners should use them as is."














































User didn't leave any comment to the rating