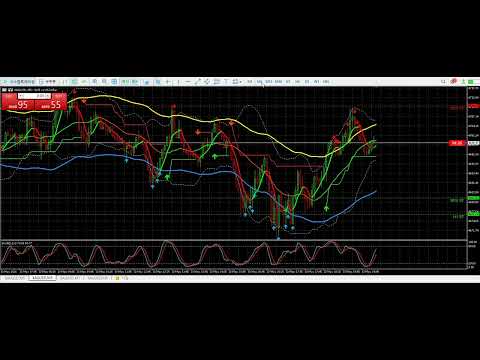
Multi TF SuperTrend Map MT5
- Indicators
- Version: 1.0
- Activations: 10

📈 Multi_TF_SuperTrend_Map Detailed Description
This product is an upgraded version of the previously developed Supertrend Pure MT5 - High-Precision Trend Follower.
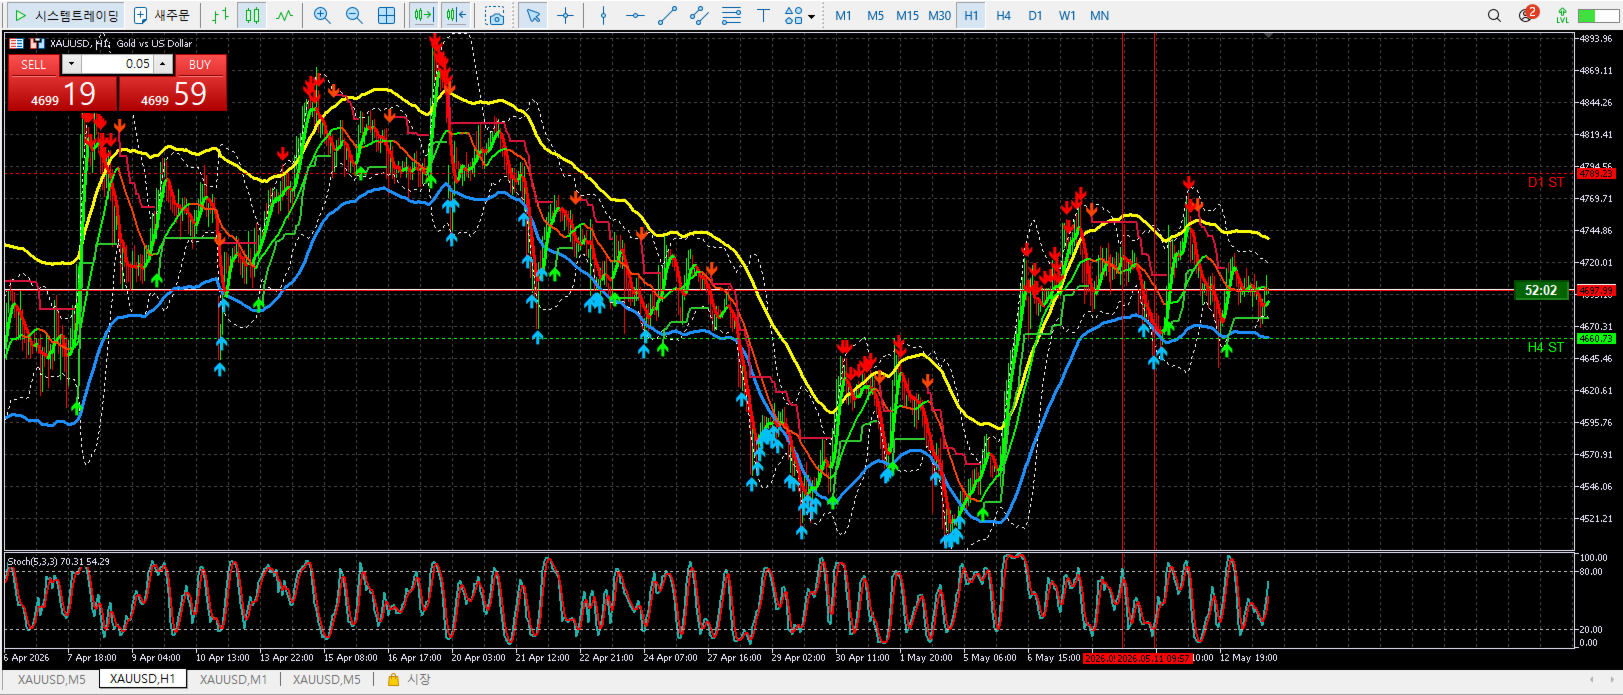
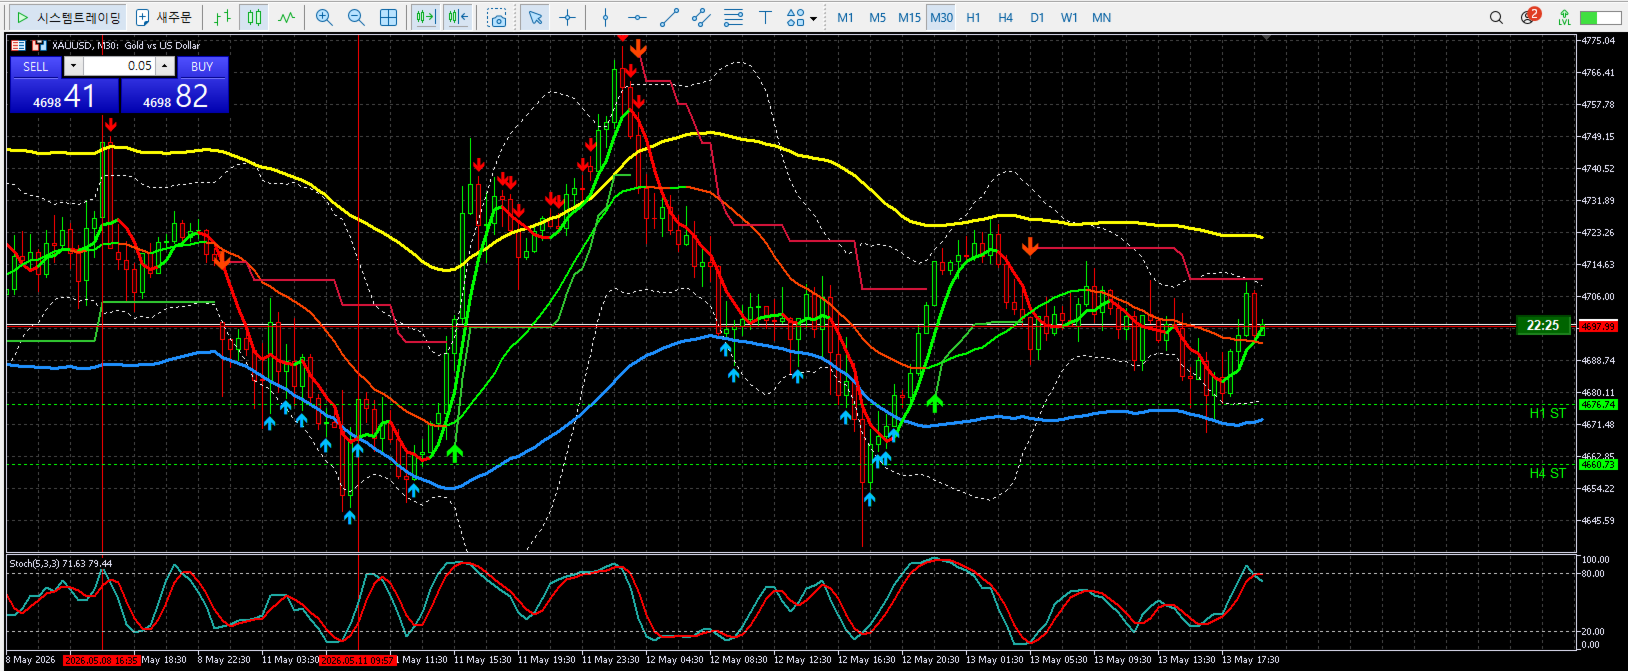
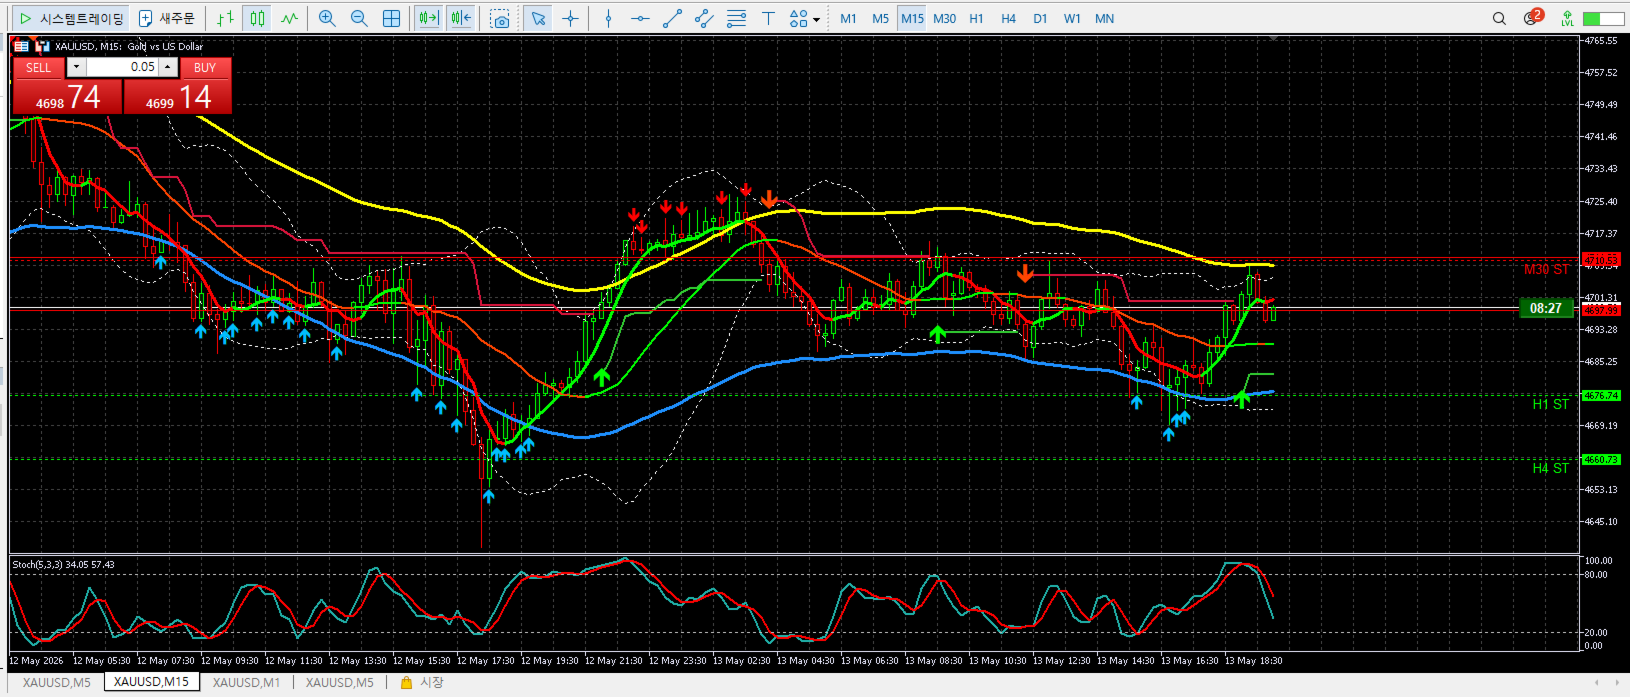
The previous product only displayed the Supertrend line shown in the current timeframe. However, the newly upgraded product displays not only the Supertrend of the current timeframe but also the Supertrend lines and times of higher timeframes. By showing detailed direction and limits—such as which direction the candles and trends are heading, or whether current support or resistance is strong—on a single page, it helps facilitate more intuitive and reliable trading.
Your reviews and comment scores are the driving force behind our continued development of this program. Thank you.
Multi_TF_SuperTrend_Map
1. Core Concept of the Indicator
This indicator calculates the current price volatility based on ATR (Average True Range). Through this, it identifies the direction of the trend (upward/downward) and the critical point (horizontal dotted line) where the trend reverses. In particular, by displaying the threshold of the upper timeframe on the current chart, it enables trading that "sees the forest, not the trees."
2. Key Components and Functions
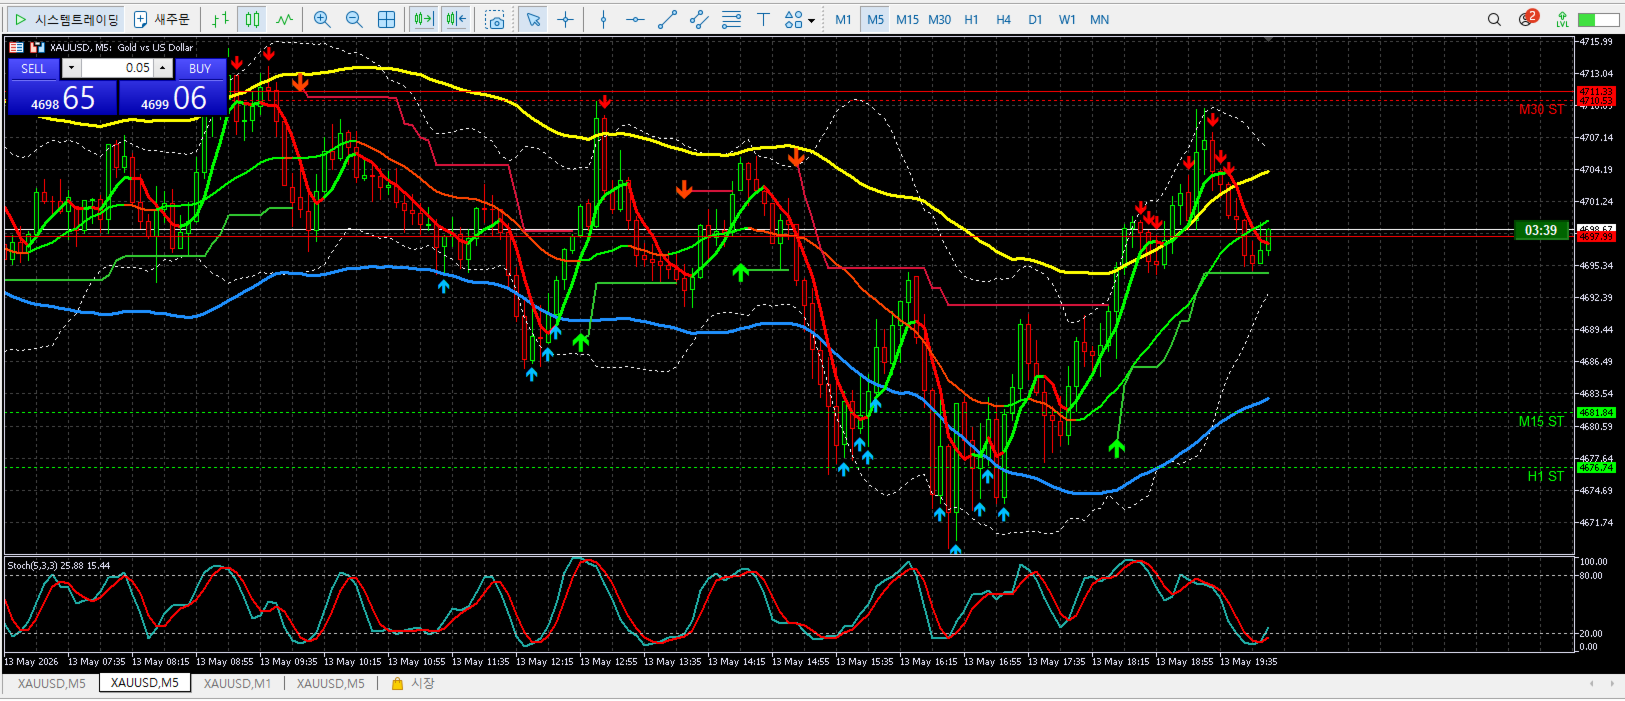
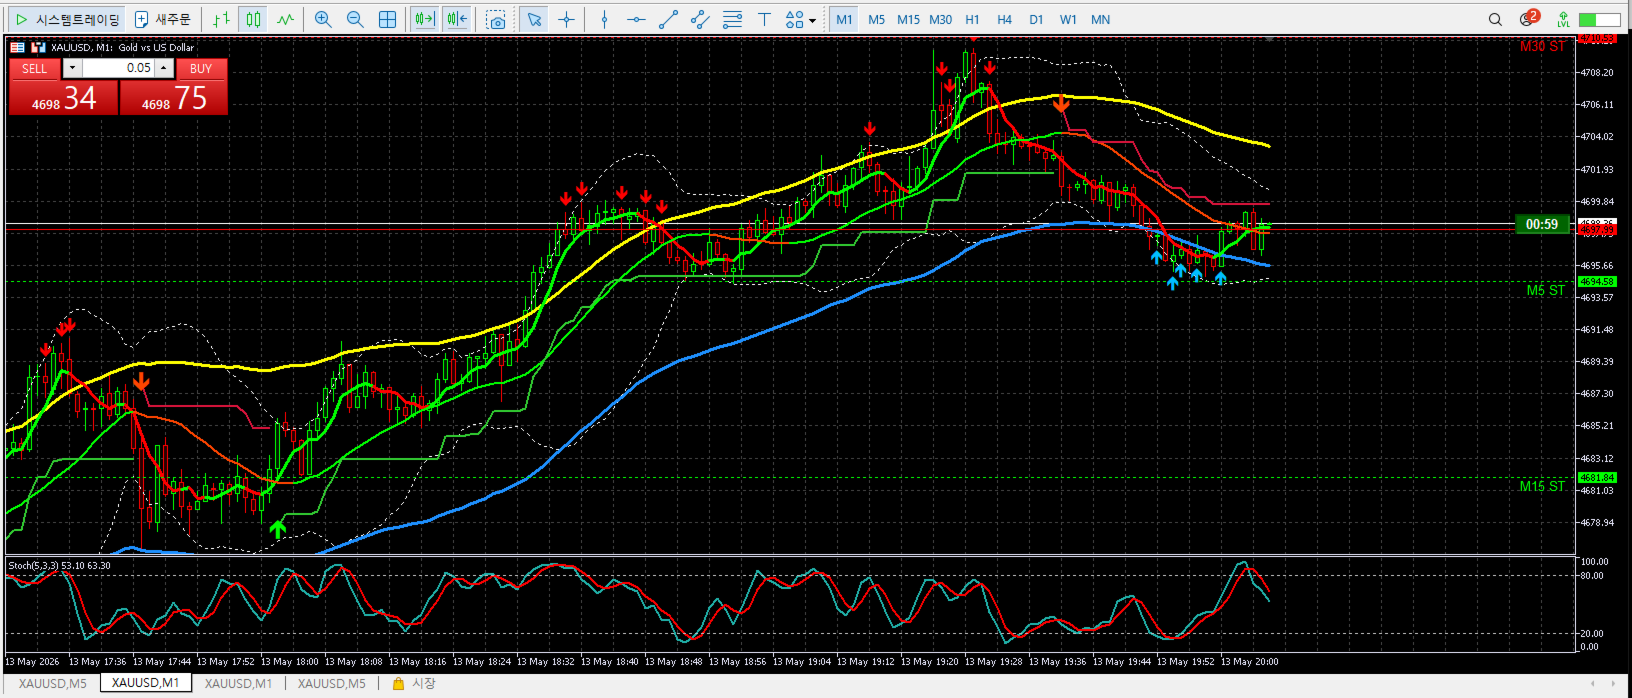
Current TF Supertrend Line & Signal: These are the main lines drawn in real-time on the chart and arrow signals generated when a trend reversal occurs.
MTF Dynamic H-Lines: Displays the Supertrend values of upper timeframes, such as M5, M15, M30, H1, H4, and D1, in the form of horizontal dotted lines.
Right-Fixed Labels (Price-Tracking Labels): Displays the timeframe name (e.g., D1 ST) at the end of each horizontal line and moves up and down in real-time according to price fluctuations.
Color Readability: If the current price is above the Supertrend of the corresponding timeframe, the line and text colors automatically change to Lime (Rising); if it is below, they change to Red (Falling).
3. Technical Logic (Internal Logic)
The indicator undergoes the following calculation process internally.
Median Price Calculation: The reference price is determined by calculating (High + Low + Close) / 3.
Volatility Offset: Calculate the ATR (10) * Multiplier (2.5–3.0) value to spread the line upwards and downwards from the reference price.
Trailing Stop: The line is kept horizontal until the price breaks through the previous upper and lower limits to eliminate unnecessary noise.
MTF Data Synchronization: Data from the upper TF is called using functions such as iClose and iATR to match it with the pixel coordinates of the current chart.
4. Practical Trading Strategies
① Trend Alignment Strategy
Strong Buy: When all timeframe labels (M5–D1) are green and located below the price.
Strong Sell: When all labels are red and located above the price.
② Strong Support and Resistance Lines
The Super Trend line of the upper timeframe (H4, D1) acts as a very strong final line of defense.
Even if the short-term trend reverses, if it rebounds from the upper TF line, it is highly likely to be a simple pullback.
③ Signal Filtering
Even if a buy arrow appears on the current chart (M5), you should exercise caution if the lines on the upper charts (H1, H4) are above the price (in red), as this is likely a short rebound.
5. Settings Guide (Inputs)
InpATRPeriod (10): This is the period for measuring volatility. The shorter the value, the more sensitive it is; the longer the value, the less sensitive it is.
InpMultiplier (2.5~3.0): This determines the width of the trend line. As the value increases, the trend is maintained for a longer period, but entry signals may be delayed. In my experience, setting it to 2.5 was the most appropriate.