Visual Quantum Flux Oscillator Pro
- Indicators
- AL MOOSAWI ABDULLAH JAFFER BAQER
- Version: 1.0
- Activations: 5
Visual Quantum Flux Oscillator Pro
Unlock Market Rhythms with Precision and Clarity
Are you tired of indicators that lag, produce false signals, and clutter your charts with confusing information? The Visual Quantum Flux Oscillator Pro is a professionally engineered trading tool designed to cut through the market noise and provide you with clear, actionable insights into trend direction and momentum shifts.
For just $30, you can equip yourself with an advanced indicator that helps you identify significant market turning points with a new level of confidence.
The Logic Behind the Oscillator
The core of the Visual Quantum Flux Oscillator Pro is a sophisticated algorithm that analyzes price action in a unique way. Unlike standard zigzag or trend indicators that simply follow price, our oscillator operates on the principle of "quantum flux"—the idea that a true trend reversal is only confirmed after a significant price rejection from a recent high or low.
Here is how it works in detail:
-
Identifying Extremes: The indicator first scans the recent price history to establish the most significant high and low points, which act as initial anchors for the trend.
-
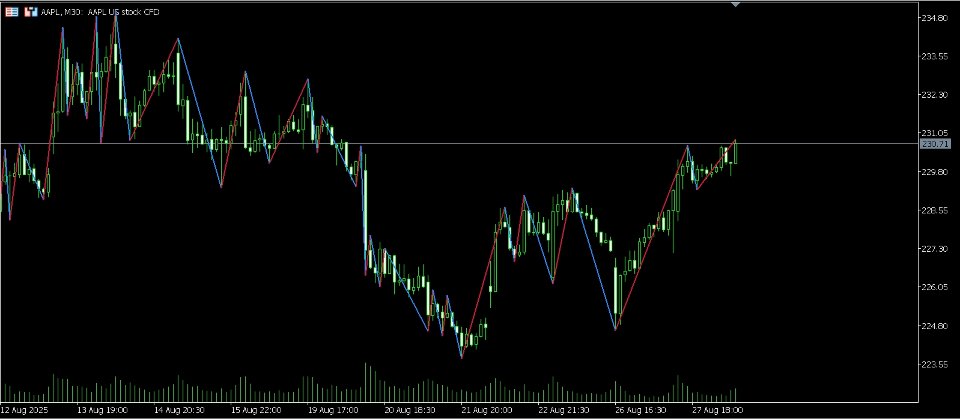
Tracking the Trend: As the trend continues, the oscillator follows the price. For example, in an uptrend, it will continuously mark new highs. The line on your chart will remain blue, indicating bullish momentum.
-
Measuring the Reversal: The true power of the indicator is revealed when the market begins to turn. Instead of immediately flagging a reversal on a small pullback, the oscillator measures the percentage of the reversal from the last established peak.
-
The Flux Threshold: This is where you have full control. Using the "Flux Reversal Threshold" input, you define how significant a reversal must be to be considered a genuine change in trend. For instance, if you set a threshold of 0.5%, the indicator will only confirm a new downtrend (changing the line to crimson) if the price drops by at least 0.5% from the most recent high.
This method of confirming signals based on a user-defined reversal percentage is designed to filter out minor market noise and volatility, allowing you to focus only on high-probability trend changes.
Key Features and Benefits
-
High-Clarity Visual Signals: The indicator plots a single, clean zigzag line that changes color to reflect the market trend—Dodger Blue for bullish momentum and Crimson for bearish momentum. This makes identifying the current trend effortless.
-
Adjustable Sensitivity (Flux Threshold): Tailor the indicator to any market and timeframe. A lower threshold will make it more sensitive to small reversals, ideal for scalping, while a higher threshold will focus on major, long-term trend shifts, perfect for swing and position trading.
-
Built-in Signal Filter: To help prevent over-trading, the indicator includes an optional "Bars Delay" feature. This allows you to specify a minimum number of bars that must pass before a new signal can be generated, ensuring you only act on well-established momentum.
-
Fully Customizable Appearance: Adjust the line width and colors to perfectly match your existing chart templates and visual preferences.
-
Advanced Logging for Analysis: For advanced traders who backtest and analyze performance, the indicator includes a robust logging system. You can monitor every signal and decision the indicator makes, either in the terminal or directly to a file.
How to Use the Visual Quantum Flux Oscillator Pro
Trading with the oscillator is intuitive:
-
Potential Buy Signal: When the line changes from Crimson to Dodger Blue, it signifies that a downward trend has been rejected and a new potential uptrend is beginning. This is a signal to look for buying opportunities.
-
Potential Sell Signal: When the line changes from Dodger Blue to Crimson, it indicates that an upward trend has exhausted itself and a new potential downtrend is forming. This is a signal to look for selling opportunities.
Combine these clear signals with your own analysis of market structure, support and resistance, or other confirmation tools to build a powerful and complete trading strategy.
Elevate your trading analysis and start making more informed decisions. Add the Visual Quantum Flux Oscillator Pro to your toolkit today.

