Visual Neptune Storm Surge indicator
- Indicators
- AL MOOSAWI ABDULLAH JAFFER BAQER
- Version: 1.0
- Activations: 5
Visual Neptune Storm Surge: Ride the Tides of Market Momentum
Unleash the power of the ocean's force on your charts with the Visual Neptune Storm Surge indicator. Designed for traders who demand precision and clarity, this tool captures the raw energy of market volatility and translates it into clear, actionable trading signals. Stop guessing the trend and start trading with the confidence of a tidal wave at your back.
For just $30, you can equip your trading arsenal with a sophisticated, yet intuitive, indicator that visually represents market momentum and breakout potential.
The Logic: How Neptune Predicts the Surge
The Visual Neptune Storm Surge indicator is built on a powerful multi-layered algorithm that analyzes the market in three distinct phases, just like a developing ocean storm:
-
Measuring the Storm Intensity: The core of the indicator is its ability to measure market volatility. It uses a specialized Average True Range (ATR) calculation to determine the "storm intensity." When volatility is high, the storm is strong, and when it's low, the market is calm. This gives you an immediate understanding of the current trading environment.
-
Identifying the Tidal Waves: Price action is often choppy and misleading. The indicator smooths out this noise by calculating the underlying momentum of price highs and lows using your choice of four different moving average algorithms (Simple, Exponential, Smoothed, or Linear Weighted). These smoothed values represent the true "tidal waves" of market direction, filtering out insignificant fluctuations.
-
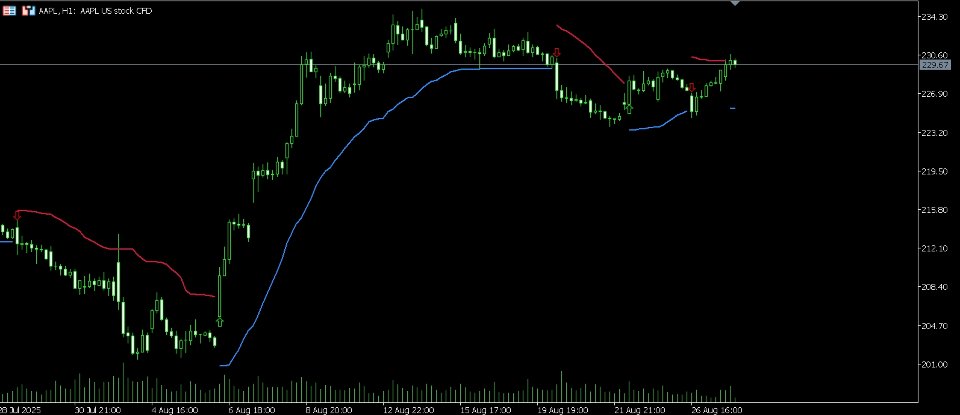
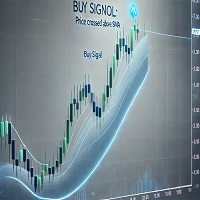
Calculating the Storm Surge: The magic happens when storm intensity is combined with the tidal waves. The indicator projects dynamic upper and lower boundaries on your chart, creating a "storm surge" channel. This channel is not static; it expands and contracts based on real-time market volatility.
-
In a strong uptrend, the lower boundary acts as a dynamic support line.
-
In a strong downtrend, the upper boundary acts as a dynamic resistance line.
-
Trade signals are generated when the price closes decisively outside of the previous surge boundary, signaling that a powerful new trend is forming and providing you with a high-probability entry point.
Key Features
-
Dynamic Surge Channels: The visual upper and lower boundaries adapt to market volatility, providing realistic and reliable support and resistance levels.
-
High-Clarity Buy & Sell Arrows: Non-repainting arrows appear on your chart the moment a new trend is confirmed, giving you clear entry signals.
-
Advanced Momentum Detection: By smoothing price action, the indicator focuses only on significant market movements, helping you avoid false breakouts.
-
Fully Customizable: Take complete control over your trading. Adjust the storm intensity period, the surge multiplier, the wave smoothing period, and the calculation method to perfectly match your trading style and any market condition.
-
Built-in Signal Filter: Avoid over-trading with an optional bar delay filter. Set the minimum number of bars to wait between signals, ensuring you only take the highest quality setups.
Full Parameter Control
-
Storm Surge Configuration:
-
Storm Intensity Period: Sets the lookback period for calculating market volatility.
-
Surge Amplitude Multiplier: Adjusts the width of the surge channels. Higher values create wider channels for less frequent, but stronger, signals.
-
Wave Smoothing Period: Defines the period for smoothing price highs and lows to detect underlying momentum.
-
Wave Smoothing Algorithm: Choose between SMA, EMA, SMMA, and LWMA for your preferred momentum calculation.
-
-
Signal Controls:
-
Enable Bars Between Signals: Turn the signal filter on or off.
-
Bars to Wait Between Signals: Specify the number of bars to wait before a new signal can appear.
-
Arrow Offset: Adjust how far the signal arrows appear from the price bars for perfect visibility.
-
The Visual Neptune Storm Surge indicator is more than just a tool; it's a new way to see the market. It allows you to visualize momentum, anticipate breakouts, and trade with the powerful forces that drive price. Harness the storm and elevate your trading today.
