RSI Extreme Zones indicator MT4
- Indicators
- Eda Kaya
- Version: 1.3
RSI Extreme Zones indicator for MetaTrader 4
The RSI Extreme Zones indicator for MetaTrader 4 is a refined momentum oscillator built on the traditional 14-period Relative Strength Index.
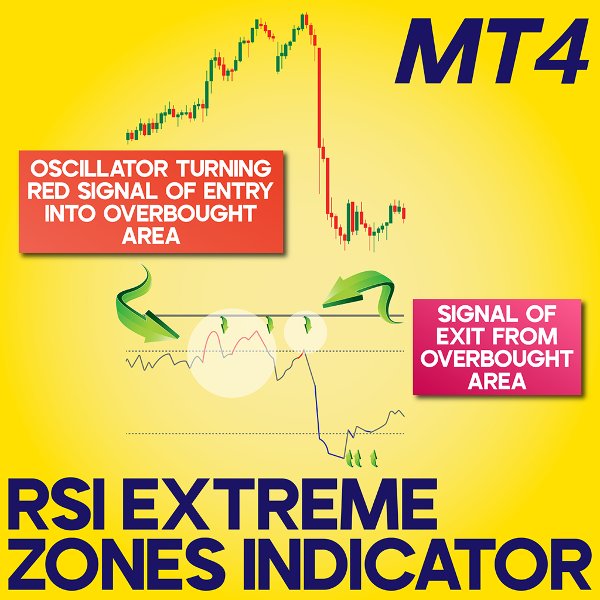
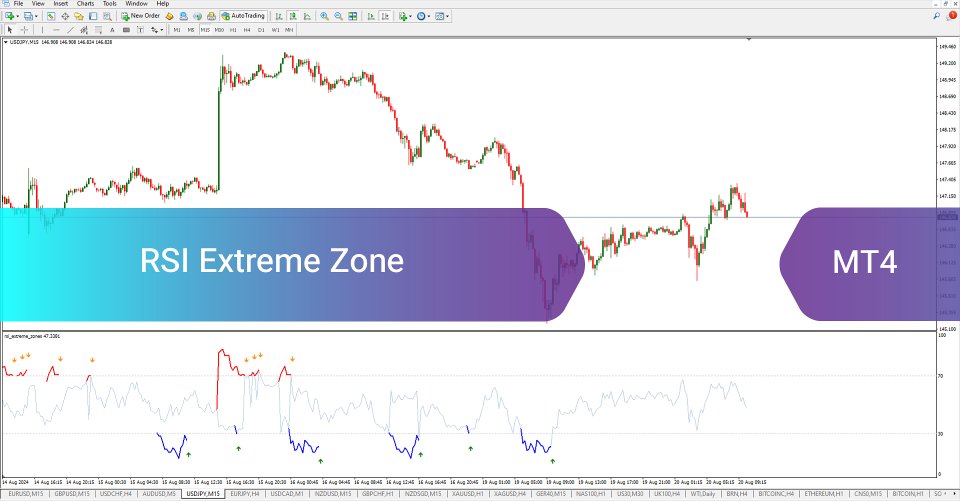
This tool, compatible with the MT4 platform, enhances visual clarity by changing colors when price reaches critical thresholds: it turns red when the RSI crosses into the overbought region (above 70), and blue when it dips into the oversold region (below 30).
This dynamic coloring helps traders swiftly recognize extreme market conditions, supporting more precise decision-making in various trading scenarios.
«Indicator Installation & User Guide»
MT4 Indicator Installation | RSI Extreme Zones indicator MT5 | ALL Products By TradingFinderLab | Best MT4 Indicator: Refined Order Block Indicator for MT4 | Best MT4 Utility: Trade Assistant Expert TF MT4 | TP & SL Tool: Risk Reward Ratio Calculator RRR MT4 | Money Management: Easy Trade Manager MT4 | Trade Copier: Free Fast Local Trade Copier MT4
Indicator Table
| Category | Oscillator – Signal Generator – Analysis Tool |
| Platform | MetaTrader 4 |
| Skill Level | Novice |
| Indicator Type | Early Signal – Reversal Detector |
| Time Frame | Supports Multiple Time Frames |
| Trading Style | Scalping – Swing Trading – Mid-Term Strategies |
| Trading Markets | Forex – Equity Markets – Binary Options |
Buy Signal (Uptrend Indications)
On the 4-hour chart of Bitcoin Cash (BCH), the RSI line changes to blue once the price enters the oversold zone (under 30). As the RSI rebounds above this threshold, the RSI EZ tool marks a buy opportunity on the chart. This indication is valuable for traders seeking high-probability long entries.
Sell Signal (Downtrend Indications)
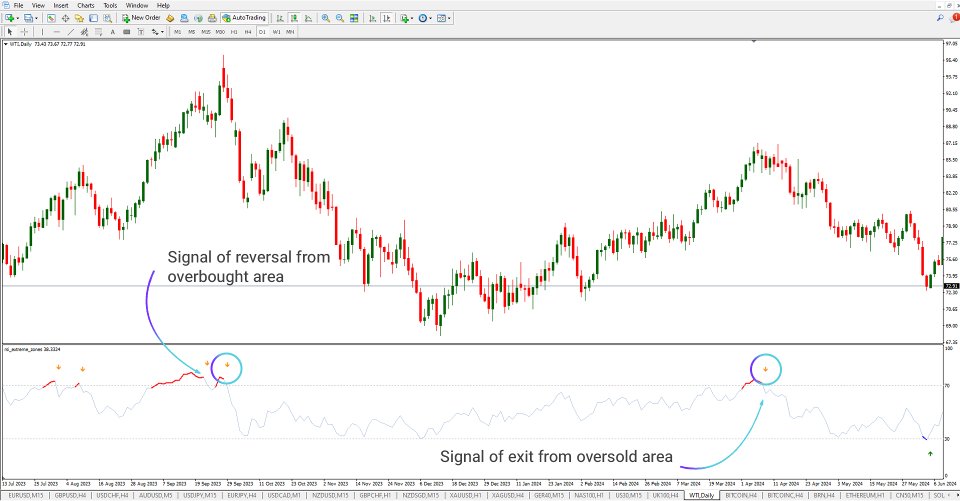
For the daily chart of WTI Crude Oil, the RSI line turns red when price activity reaches the overbought zone (above 70). Once it retreats from this level, the RSI EZ indicator provides a sell notification, guiding traders toward possible short positions.
Indicator Settings
- RSI period: 14
- Upper threshold: 70 (Overbought)
- Lower threshold: 30 (Oversold)
- Arrow Up Symbol: Code 233
- Arrow Down Symbol: Code 234
- Arrow offset: 10 units
- Use alert system: Set to False
Summary
The RSI Extreme Zones indicator for MetaTrader 4 is a practical tool for spotting potential market reversals. Designed with simplicity and visual cues, it's especially suitable for newer traders. By highlighting overbought and oversold exits, this indicator enhances trade timing and confidence in trend reversals.
