RSI Extreme Zones indicator MT5
- Indicators
- Eda Kaya
- Version: 1.3
RSI Extreme Zones indicator for MetaTrader 5
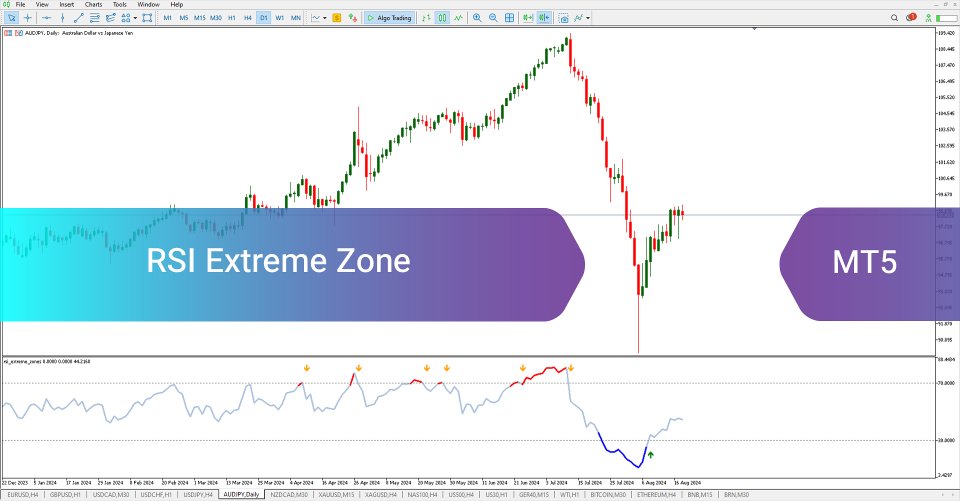
The RSI Extreme Zones indicator for MetaTrader 5 (RSI EZ) is a modified version of the traditional Relative Strength Index, tailored to highlight high-probability turning points in the market. Operating on the MT5 platform, this indicator marks critical overbought (above 70) and oversold (below 30) thresholds.
When price action exits these zones, the indicator generates buy or sell alerts, suggesting a potential trend change or correction.
«Indicator Installation & User Guide»
MT5 Indicator Installation | RSI Extreme Zones indicator MT4 | ALL Products By TradingFinderLab | Best MT5 Indicator: Refined Order Block Indicator for MT5 | Best MT5 Utility: Trade Assistant Expert TF MT5 | TP & SL Tool: Risk Reward Ratio Calculator RRR MT5 | Money Management: Easy Trade Manager MT5 | Trade Copier: Free Fast Local Trade Copier MT5
RSI Indicator Table
| Category | Oscillator – Signal Generator – Forecasting Tool |
| Platform | MetaTrader 5 |
| Skill Level | Entry-Level |
| Indicator Type | Anticipatory – Reversal |
| Time Frame | Multi-Timeframe Compatible |
| Trading Style | Intraday – Swing Trading – Positional |
| Trading Markets | Forex – Equities – Binary Trading |
Oversold Zone
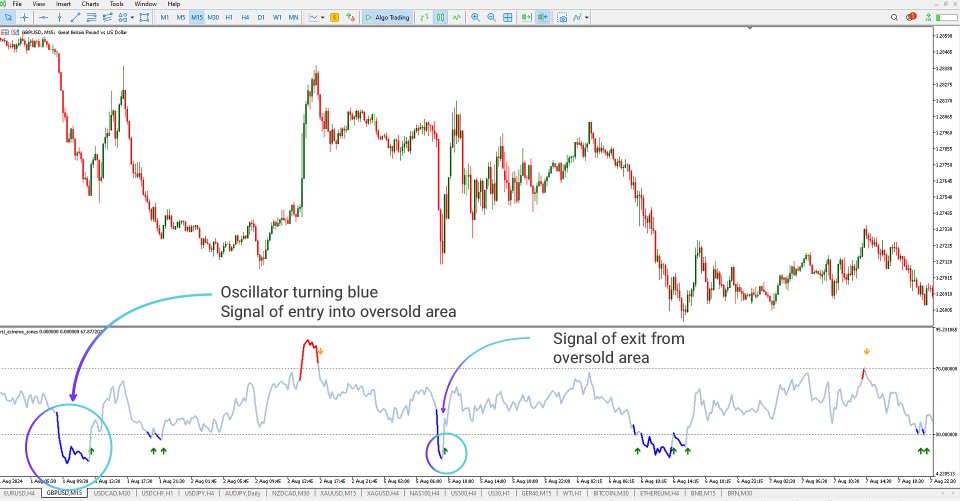
On a 15-minute GBP/USD chart, the RSI Extreme Zones indicator for MetaTrader 5 detects entries into the oversold region when RSI drops below 30. The oscillator turns blue to highlight this status. As price recovers and RSI moves above the 30 marks, the indicator suggests a possible bullish setup, aiding traders in identifying key buy opportunities.
Overbought Zone
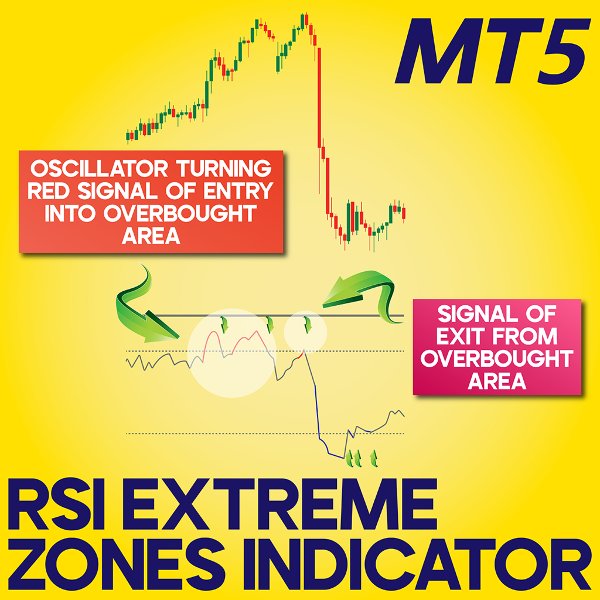
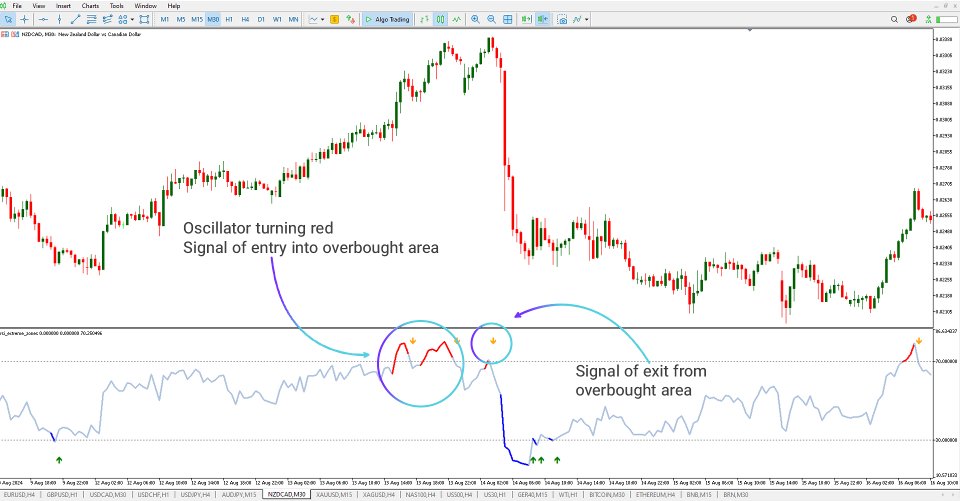
In the 30-minute NZD/CAD chart example, the RSI EZ indicator tracks when RSI surpasses the 70 level. The oscillator changes to red, flagging a potential price top. When RSI retreats below the overbought boundary, a reversal signal is triggered, guiding traders toward potential short setups or exit points for long positions.
RSI Indicator Settings
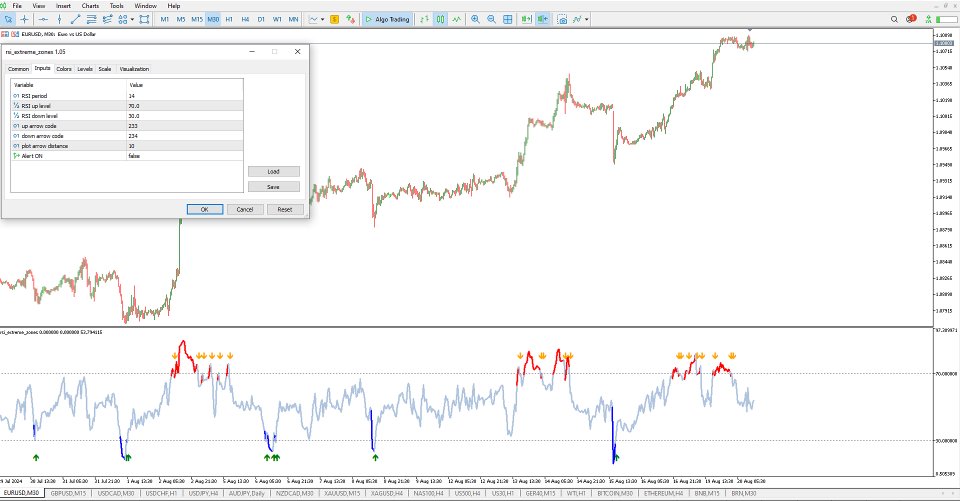
- RSI Period: Defines the RSI calculation range (default: 14)
- RSI Up Level: Sets the overbought level (default: 70)
- RSI Down Level: Sets the oversold level (default: 30)
- Up Arrow Code: Customizes the graphical alert for buy signals (e.g., 233)
- Down Arrow Code: Customizes the graphical alert for sell signals (e.g., 234)
- Arrow Distance: Adjusts vertical spacing of signal arrows (value: 10)
- Alert On: Enables or disables visual/audio alerts (default: false)
Summary
The RSI Extreme Zones indicator for MetaTrader 5 provides traders with a responsive tool for detecting momentum extremes.
Its dynamic color-coded alerts and clearly defined thresholds allow users to anticipate potential price reversals. Whether trading currencies, stocks, or binary options, this indicator helps identify optimal market entries and exits by focusing on RSI breakouts from critical zones.
How to use RSI EZ signals in trading?
When RSI enters an extreme zone (above 70 or below 30), the indicator signals potential exhaustion of the current trend. Traders can use these alerts to plan entries in the opposite direction or tighten risk parameters around existing positions.






Thanks, a really good and helpful indicator, especially in combination with the Extreme Spike indicator. Highly recommended.