Spread Statistics
- Utilities
- Artem Khakalo
- Version: 1.9
Spread Statistics (v1.9): In-depth spread analysis for MT5. This indicator displays on your chart:
-
Current Spread: (changes color when approaching Max).
-
Max / Min / Avg Spread: key metrics since launch.
-
Spread Volatility (StdDev): stability assessment.
Hover over the metrics for detailed statistics in tooltips (Min/Max time, % time near values, StdDev range).
New in v1.9: Option to select the font for better readability.
Customize update interval, colors, and position. Understand trading conditions better and control your costs!
Quick User Guide: Spread Statistics (v1.9)
This indicator helps you quickly assess the spread dynamics on your MT5 chart.
What You See on the Chart:
-
Current:: The current spread in points. Changes color (orange by default) when approaching the session's maximum value – this is your quick alert for potentially high spread!
-
Max:: The maximum spread since the indicator was launched.
-
Min:: The minimum spread since launch.
-
Avg:: The average spread since launch.
-
StdDev:: The standard deviation (volatility) of the spread. Shows how stable the spread is.
How to Get More Details:
-
Hover your mouse cursor over the Max:, Min:, Avg:, or StdDev: lines.
-
In the tooltip that appears, you'll see additional information:
-
The exact time when Min/Max was reached.
-
The percentage of time the spread was near Min/Max/Avg (calculation period selectable in settings: Daily / Total).
-
The calculated range for the average spread (Avg ± StdDev).
-
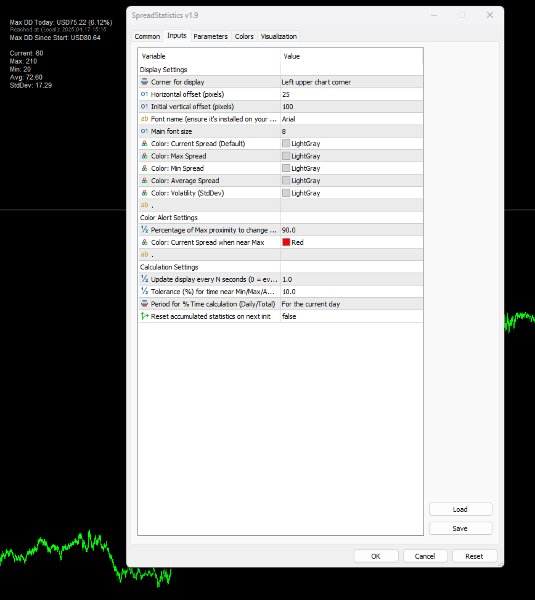
Key Settings (Inputs):
-
Font (Font Name - New in v1.9!): Choose any font installed on your system for better readability.
-
Colors: Customize the colors for each metric, including the alert color for Current.
-
Position: Select the corner (Corner for display) and offsets (offset) to position the indicator block.
-
Update Interval (Update display every N seconds): Set how often the on-screen information updates (for optimization).
-
Tolerance for % Time Calculation: Define how close the spread needs to be to Min/Max/Avg to be counted in the time percentage.
Installation:
-
Copy the SpreadStatistics.ex5 file into your MQL5\Indicators folder.
-
Refresh the indicator list in the MT5 "Navigator" or restart the terminal.
-
Drag the "Spread Statistics" indicator from the Navigator onto the desired chart.
Why Use It?
Use the indicator's information to:
-
Better understand current trading conditions.
-
Assess spread stability and associated costs.
-
Identify periods of abnormally high spread.
We hope this indicator becomes a useful tool in your trading!

