Precision Swing Point PSP Indicator ICT MT5
- Indicators
- Eda Kaya
- Version: 1.11
Precision Swing Point Indicator PSP ICT Quarterly Theory MT5
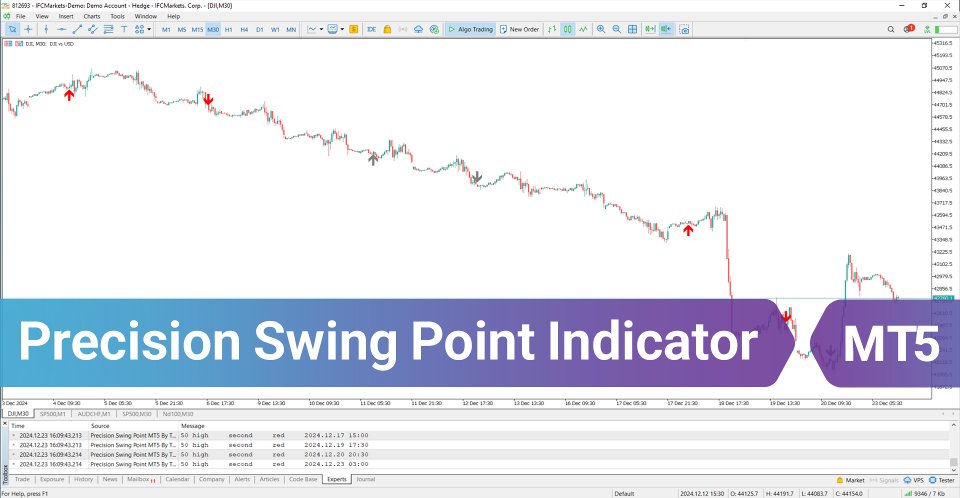
The Precision Swing Point Indicator PSP ICT Quarterly Theory MT5 is designed to detect key market turning points by analyzing price swings in MetaTrader 5. By filtering market fluctuations, this tool helps traders gain clearer insights and more precise trading signals. As a specialized Pivot Point and Fractal indicator, it enhances market analysis with high accuracy.
«Indicator Installation & User Guide»
MT5 Indicator Installation | Precision Swing Point PSP Indicator ICT MT4 | ALL Products By TradingFinderLab | Best MT5 Indicator: Refined Order Block Indicator for MT5 | Best MT5 Utility: Trade Assistant Expert TF MT5 | TP & SL Tool: Risk Reward Ratio Calculator RRR MT5 | Money Management: Easy Trade Manager MT5 | Trade Copier: Free Fast Local Trade Copier MT5
Precision Swing Point Specifications Table
The following table outlines the key attributes of the Precision Swing Point Indicator PSP ICT Quarterly Theory MT5:
| Category | Pivot Point and Fractal - Price Action - Candlestick Patterns |
| Platform | MetaTrader 5 |
| Skill Level | Intermediate |
| Indicator Type | Range - Continuation |
| Timeframe | Multi-timeframe |
| Trading Style | Day Trading |
| Market | All Markets |
Indicator Overview
The Precision Swing Point Indicator PSP ICT Quarterly Theory MT5 helps traders recognize market reversals by employing sophisticated swing point analysis. It utilizes Pivot Points and integrates three significant candlestick patterns across correlated symbols to strengthen decision-making. Signals generated by formations such as the Doji, 50% Body Candle, and Shooting Star confirm potential trend shifts.
Buy and Sell opportunities are identified when the price breaks a major reversal level and initiates a directional move.
Uptrend Conditions
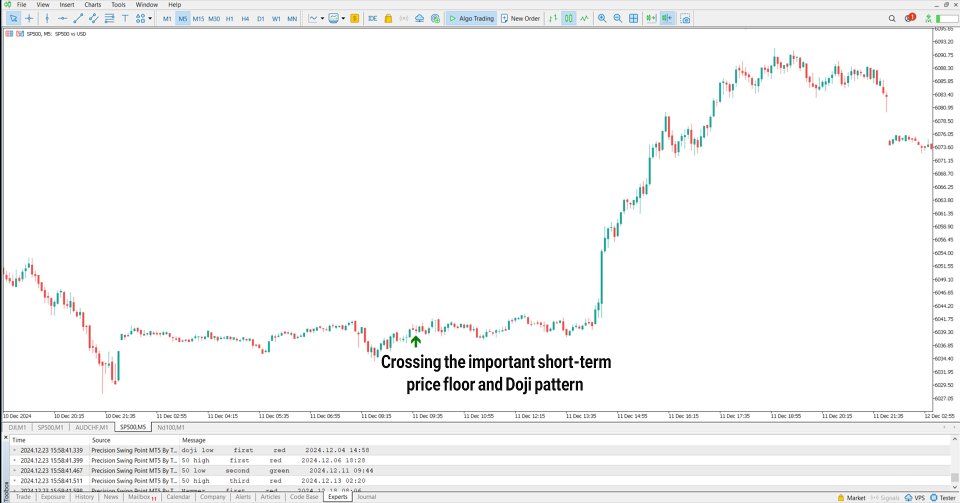
On a 5-minute S&P 500 chart, the Precision Swing Point Indicator PSP ICT Quarterly Theory MT5 detects a Buy Signal when the price surpasses a Swing Low. A Doji pattern emerges, signaling the start of bullish momentum.
Downtrend Conditions
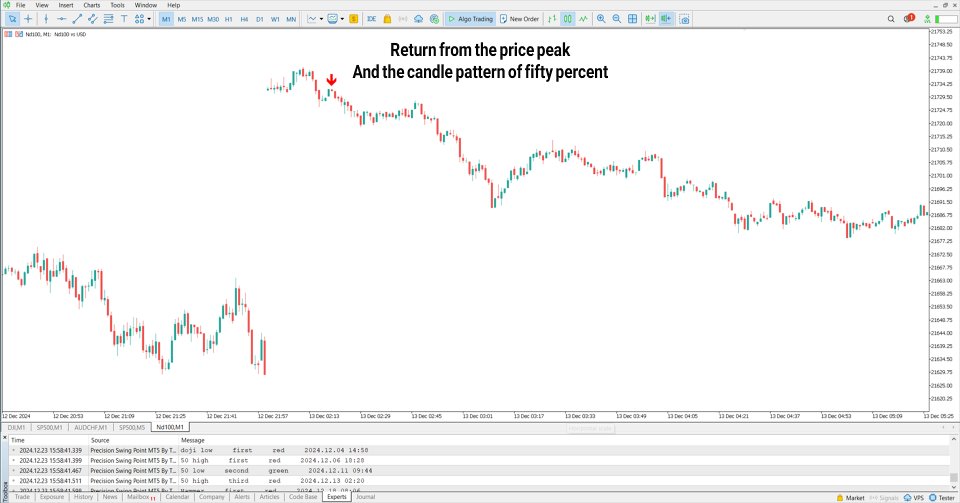
A 1-minute NASDAQ 100 chart showcases a downtrend, with a Sell Signal triggered as the price surpasses a Swing High. The confirmation comes through a 50% Body Candle, indicating rising selling pressure and the continuation of bearish momentum.
Indicator Settings
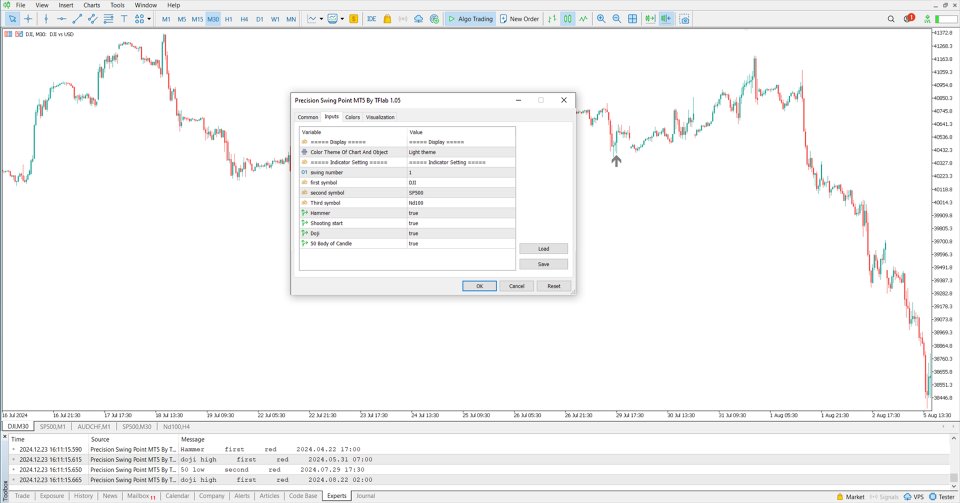
Below are the adjustable settings for the Precision Swing Point Indicator PSP ICT Quarterly Theory MT5 in MetaTrader 5:
- Color Theme of Chart and Object – Modify the chart’s appearance
- Swing Number – Define the number of swings for analysis
- First Symbol – Set the main trading asset
- Second Symbol – Add a secondary comparison asset
- Third Symbol – Include another reference asset
- Hammer – Enable Hammer pattern detection
- Shooting Star – Activate Shooting Star pattern identification
- Doji – Detect Doji formations
- 50% Body Candle – Highlight half-body candlestick patterns
Conclusion
The Precision Swing Point Indicator PSP ICT Quarterly Theory MT5 accurately marks swing points on price charts, generating Buy and Sell signals using green and red arrows. By identifying price breakouts at crucial highs and lows, this tool enhances traders' ability to make well-informed trade entries and exits.
