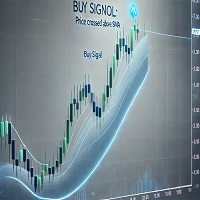
Visual Mass Reversal Indicator
- Indicators
-
AL MOOSAWI ABDULLAH JAFFER BAQER
 To trade successfully we need to go through the proven path that others had gone and reached!
Here are 17 quotes from such successful investors:
1- Limit your size in any position so that fear does not become the prevailing instinct guiding your judgment.
Joe Vidich - Version: 1.21
- Updated: 10 March 2025
- Activations: 5
| • Please test the product in the Strategy Tester before purchasing to understand how it works. • If you face any issues, contact me via private message—I’m always available to help. • After purchase, send me a screenshot of your order to receive a FREE EA as a gift. |
|---|
The Visual Mass Reversal Indicator is an advanced analytical tool designed for traders seeking to identify potential market reversals. This indicator brings powerful visual clarity to reversal opportunities, enabling traders to spot entry points effectively. Please note, the indicator is not optimized—it is intentionally crafted for you to optimize and tailor it to your unique trading strategies.
The Strategy Behind the Indicator
The Mass Reversal Indicator uses a sophisticated algorithm to detect price action patterns and market dynamics that often signal significant reversals. It combines critical price levels with underlying trend strength to highlight zones of potential reversal. Here’s how it works:
Pattern Recognition: It identifies candlestick formations and key price movements that align with historical reversal patterns. These patterns are a combination of overbought/oversold conditions and trend exhaustion.
Dynamic Zone Detection: The indicator pinpoints price levels where reversals are likely to occur, using a dynamic grid that adapts to market conditions.
Trend Context: It incorporates a trend-analysis module, ensuring that the reversals are highlighted within the broader market context. This avoids false signals in volatile or trendless markets.
Entry and Exit Clarity: The indicator draws visual signals directly on the chart, allowing you to act decisively on potential trade setups.
Entry Logic
Reversal Zones: When the price reaches highlighted reversal zones, a signal is generated. These zones are adaptive and based on historical market behavior.
Trend Confirmation: The signal is stronger when aligned with broader trend data. For instance, in an uptrend, it might identify bullish reversals at retracement levels.
Candlestick Interaction: It tracks how current candlesticks interact with the reversal zone, providing an additional layer of confirmation for entries.
Why This Indicator?
It simplifies market analysis by visually emphasizing critical zones.
It’s designed to work across all timeframes and asset classes.
You have the freedom to customize and optimize it for your trading style. This flexibility makes it a powerful tool in your trading arsenal.
How to Use It
Experiment with the indicator on a demo account to understand how it aligns with your trading approach.
Integrate it into a broader trading strategy, combining it with other tools like moving averages or oscillators for enhanced precision.
Use the visual cues to set tight stop-losses and well-defined profit targets, minimizing risk while maximizing opportunity.
Need support? Contact me via direct message! I’m happy to assist you.