Wave Mark And Quick Drawing
- Indicators
- Version: 10.2
- Updated: 3 August 2024
- Activations: 5

About Line Drawing:
( 1) Select Line Type
- Zigzag Line
- Fibo
- Horizontal Trend Line
- Range Line
- Price-Time Net
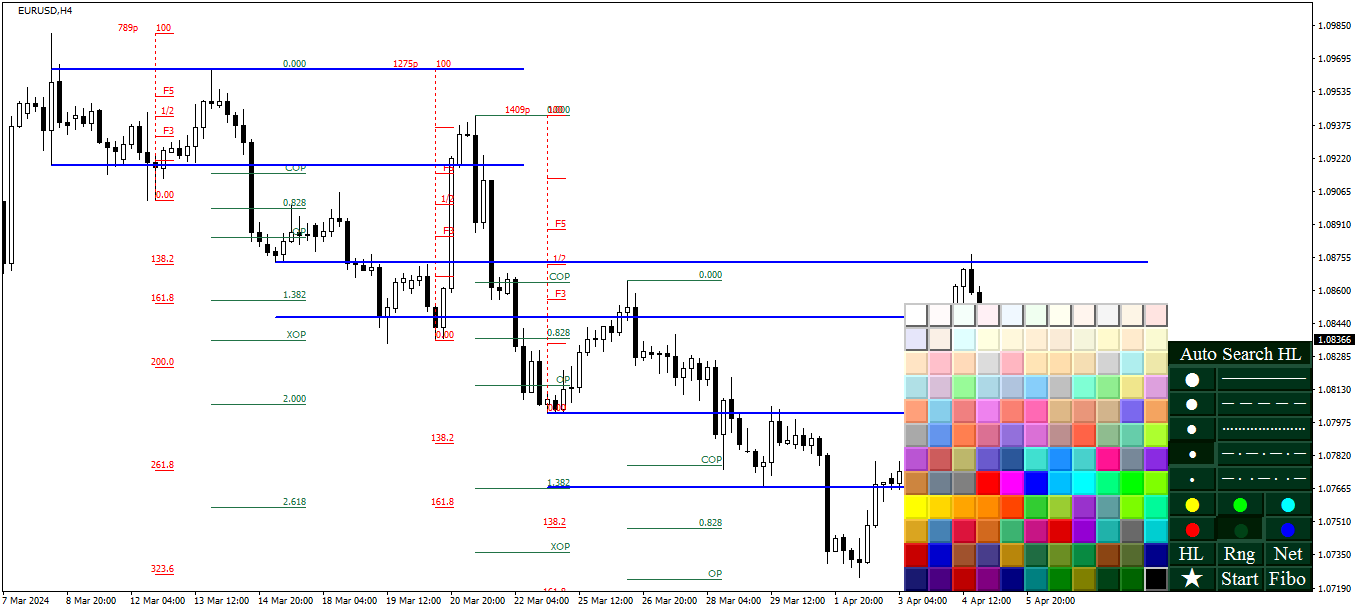
( 2) Set Line Style
- To set line color built-in or style and width just by clicking certain button
- To set line color to user color by clicking the second color button of second line when it is pressed
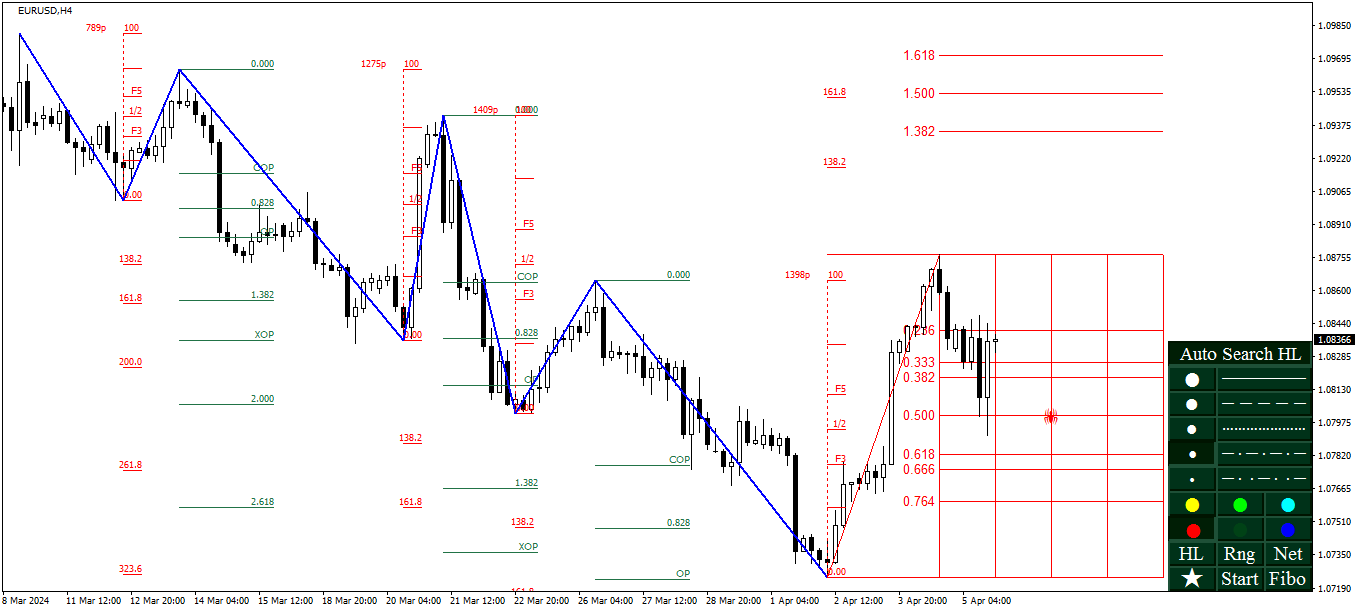
( 3) Start Drawing
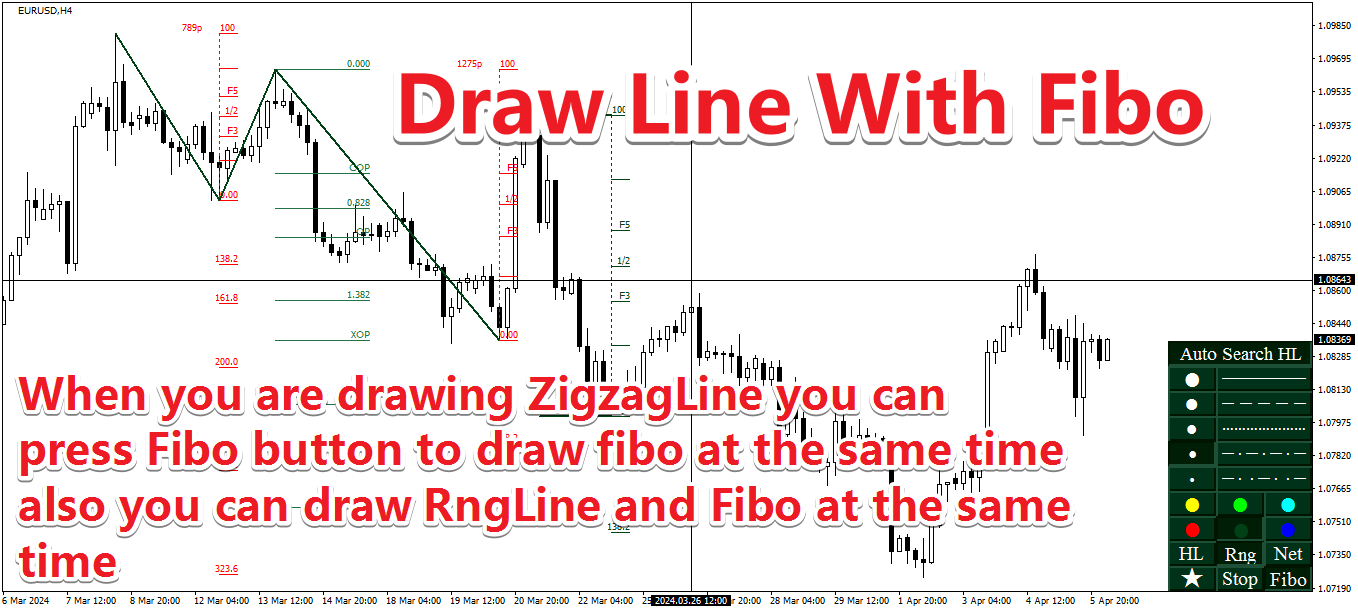
- If you have not pressed any of those Drawing-Type-Button(HL/Rng/Net/Fibo),when you select the Line-Color-Button or Line-Style-Button or Line-Width-Button it will draw Zigzag by default
- When you are drawing Zigzag Line or Range Line you can press the Fibo-Button and it will draw Fibo/Expansion at the same time
- If you want to draw adsorption Lines which can precisely locate at the high and low price points,you can press the AutoSearchHL-Button during drawing
( 4) End Drawing
- Click the same zone( error range is 20 pixels ) twice when drawing to stop
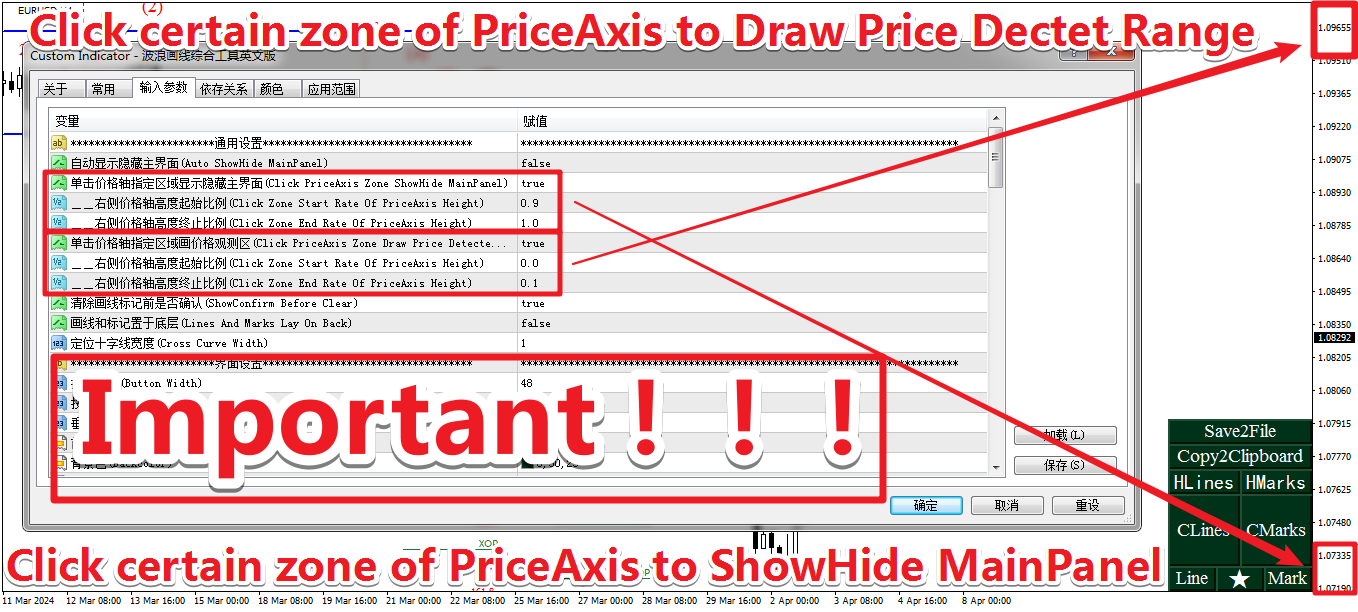
- Click the PriceAxis to stop
- Click the Stop-Button to stop
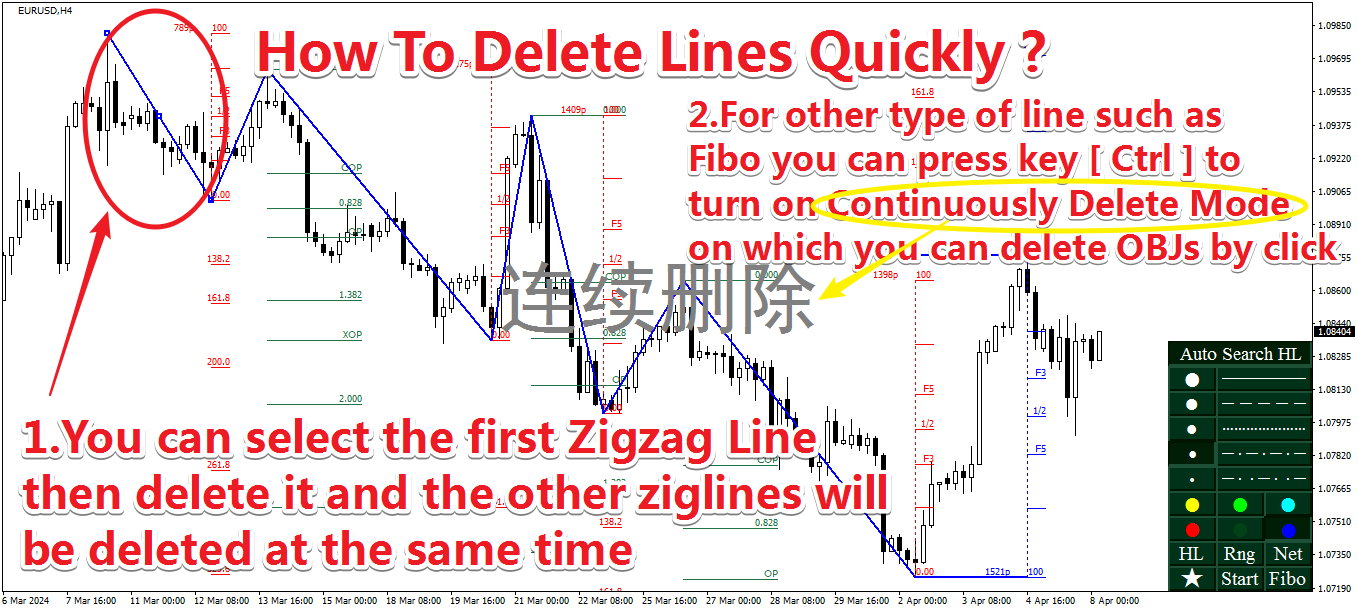
( 5) Delete Line
- Select the first line of zigzag-Lines and then delete it the zigzag-Lines will be deleted all
- Press hotkey Ctrl turn on Continuously-Delete-Mode and then delete objects by click
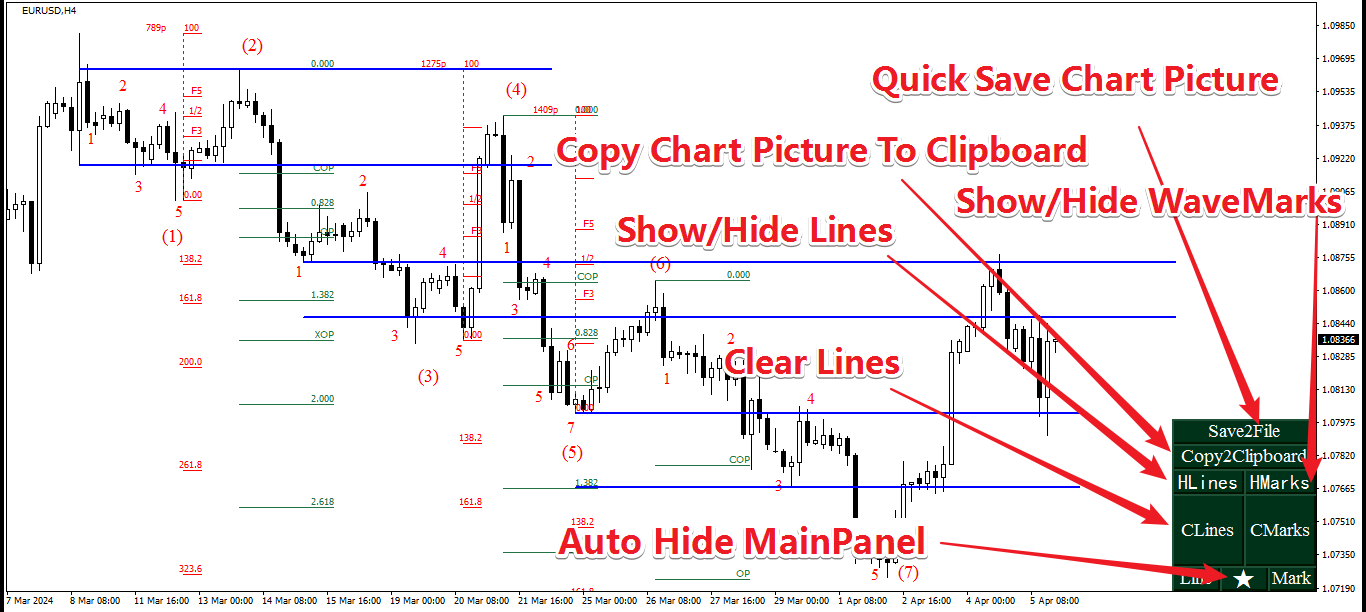
- Click the CLines-Button to clear all drawings
- Click the CMarks-Button to clear all Wave-Marks
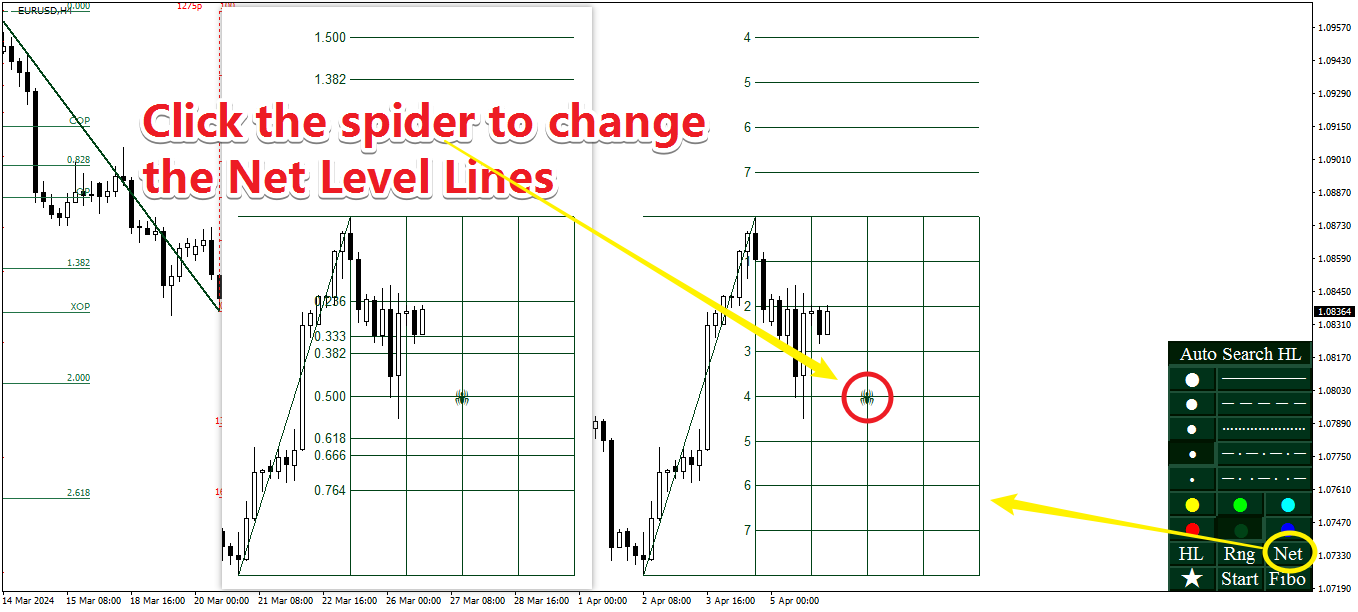
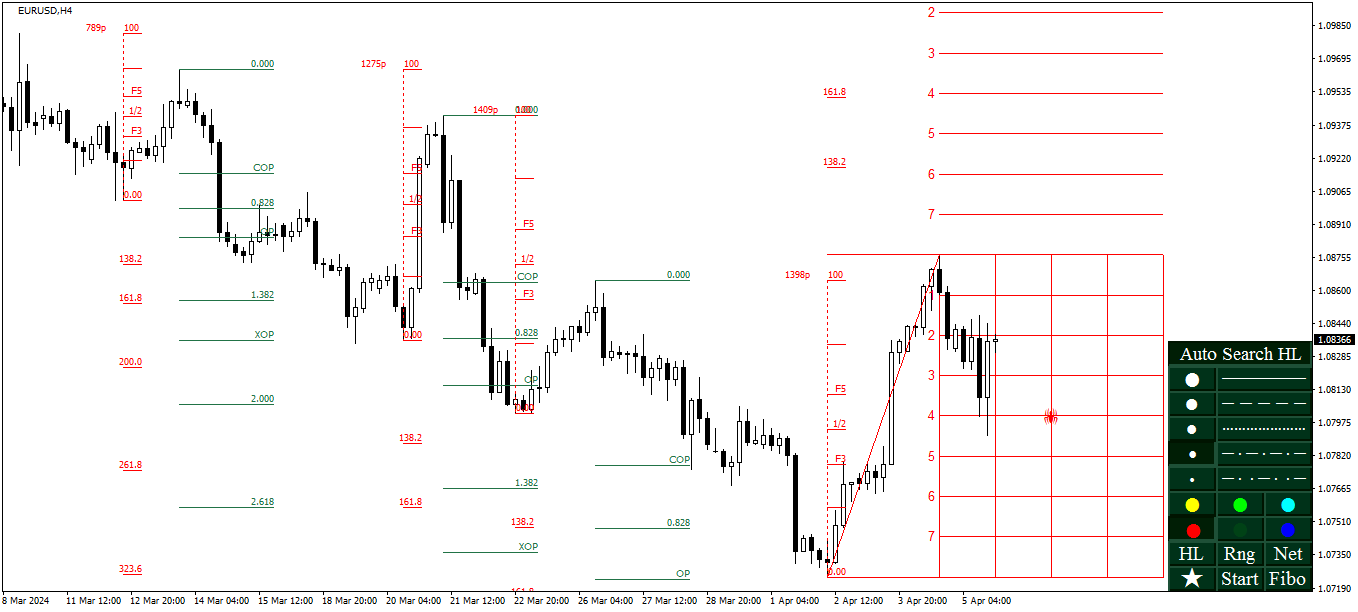
( 6) Change Price-Time-Net Level
- Click the center spider icon of the Price-Time-Net to switch level rate
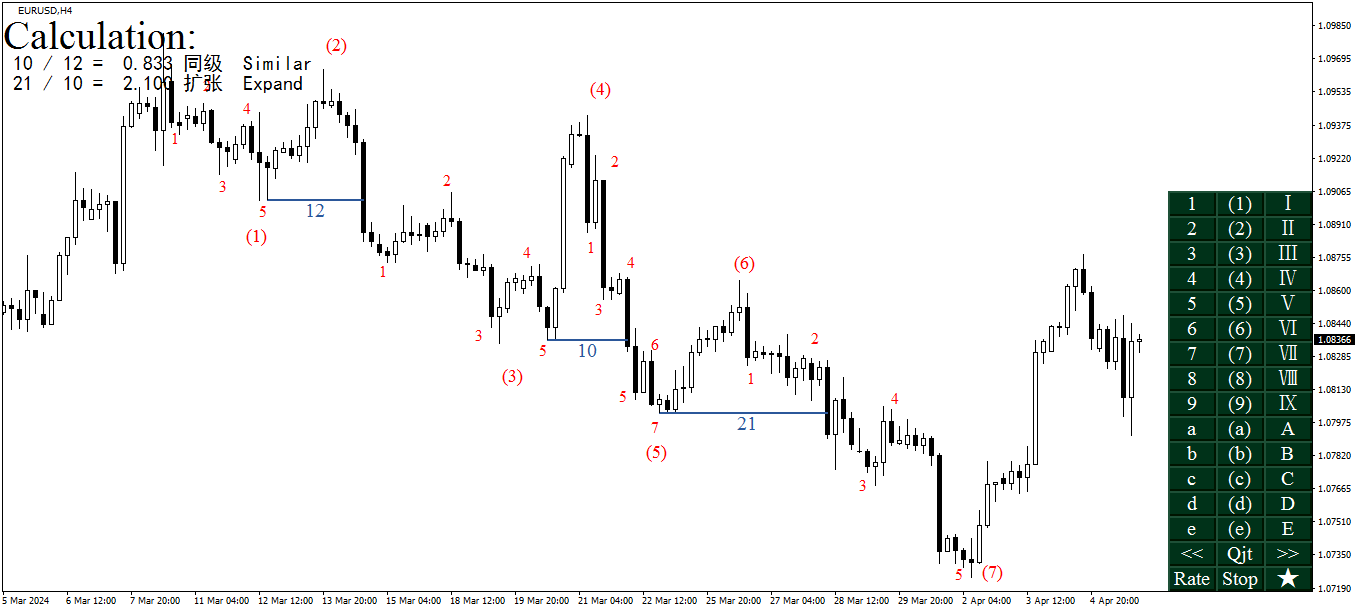
About Wave Marking:
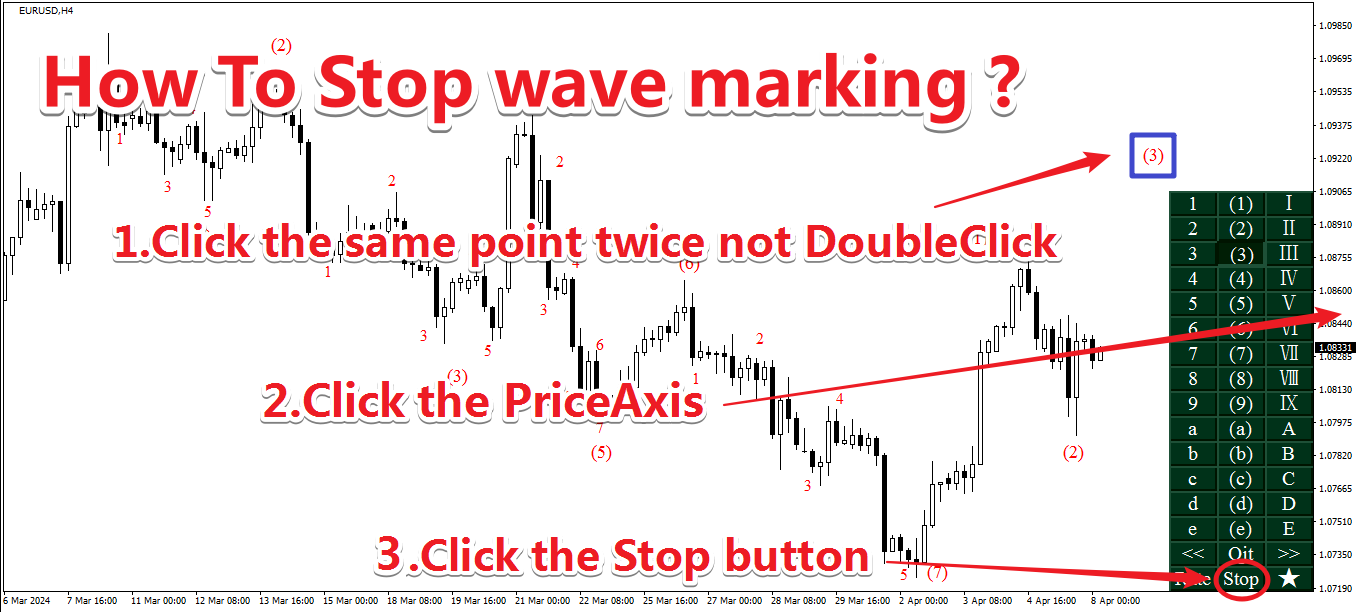
(1) Stop wave marking or Qjt marking
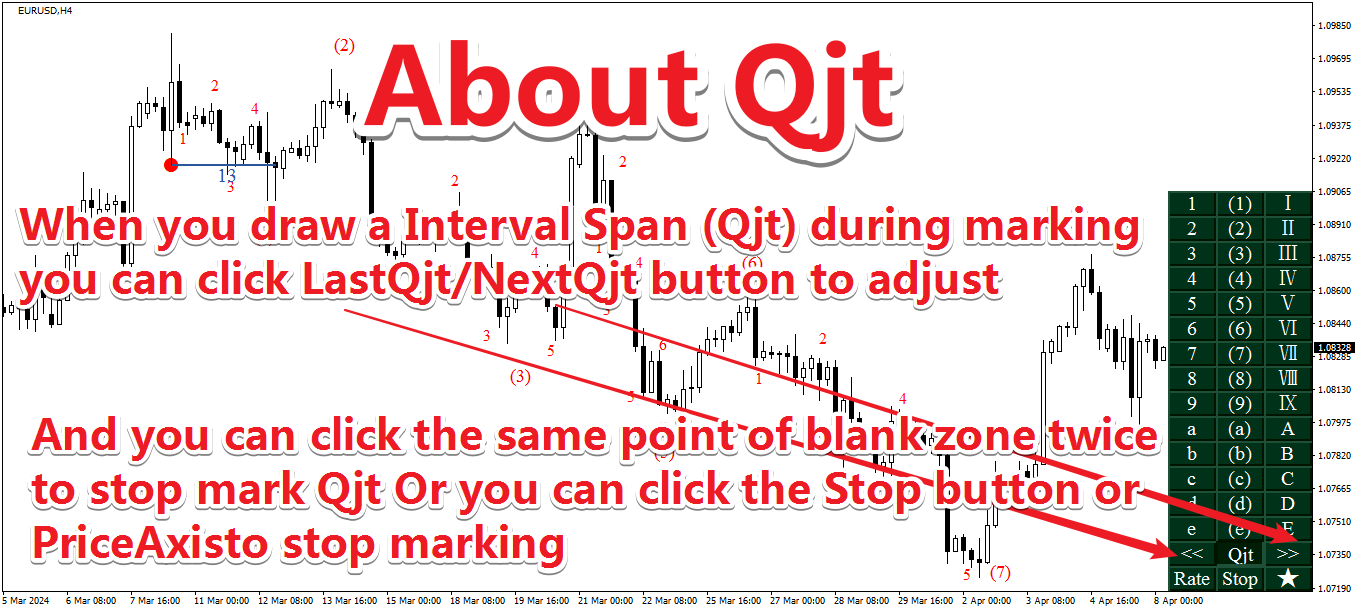
- Click the same zone( error range is 20 pixels ) twice when marking to stop (when marking Qjt the zone should located in the blank area )
- Click the PriceAxis to stop
- Click the Stop-Button to stop
( 2) Start Qjt marking
- Press the Qjt-Button
- Click the previous price high or price low before a BMS(Break of Market Structure)
- When there exist multy-scale break click <</>> Button to adjust Qjt
( 3) Calculate the scale rate of Qjts
- Click the Rate_Button
- Select the Qjts you need to Calculate