LogVar
- Indicators
- Version: 1.3

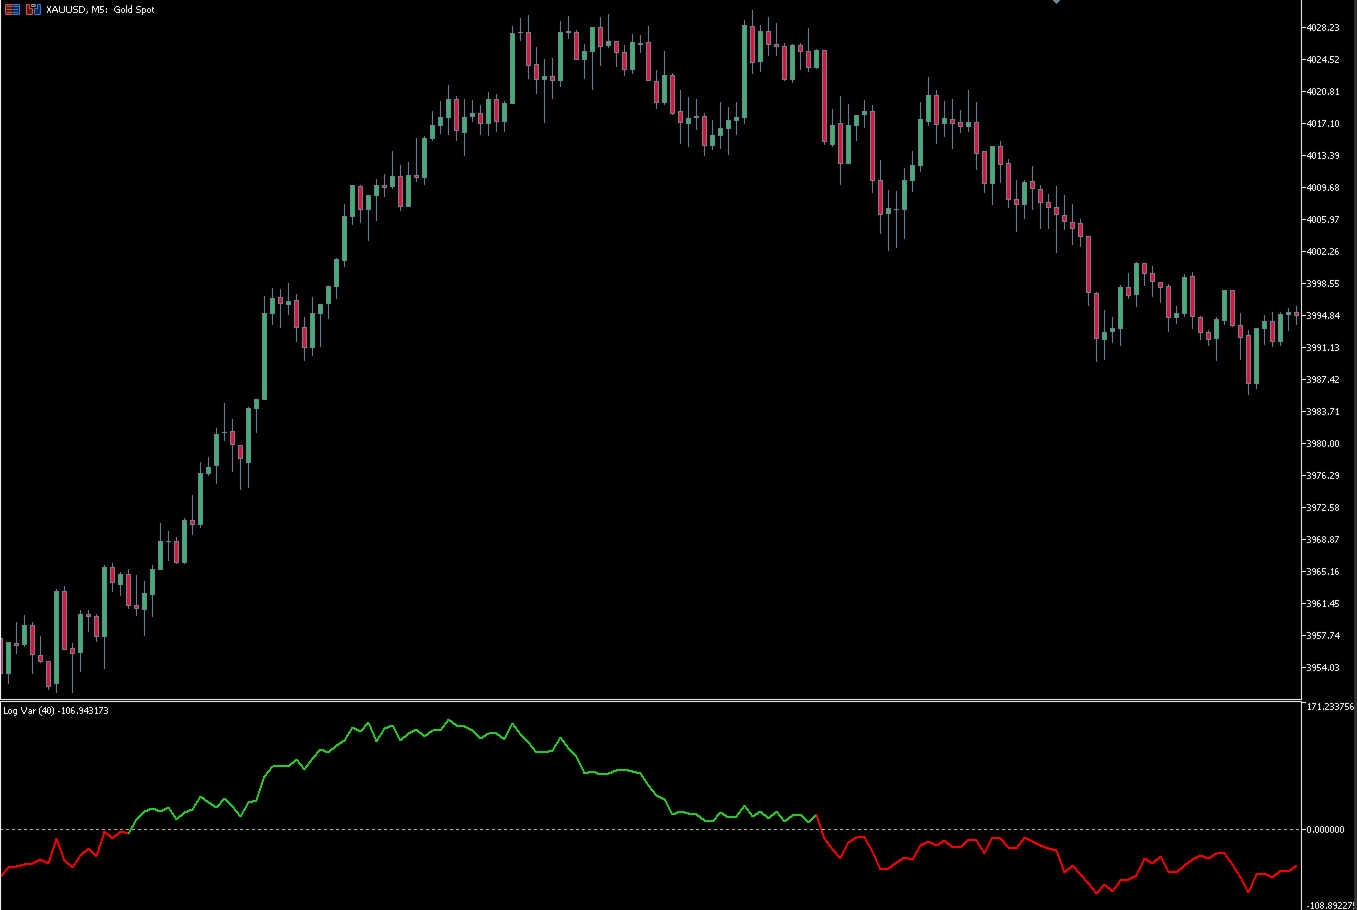
LogVar is an indicator that calculates and displays the logarithmic price variation, a more accurate way to measure percentage changes between periods.
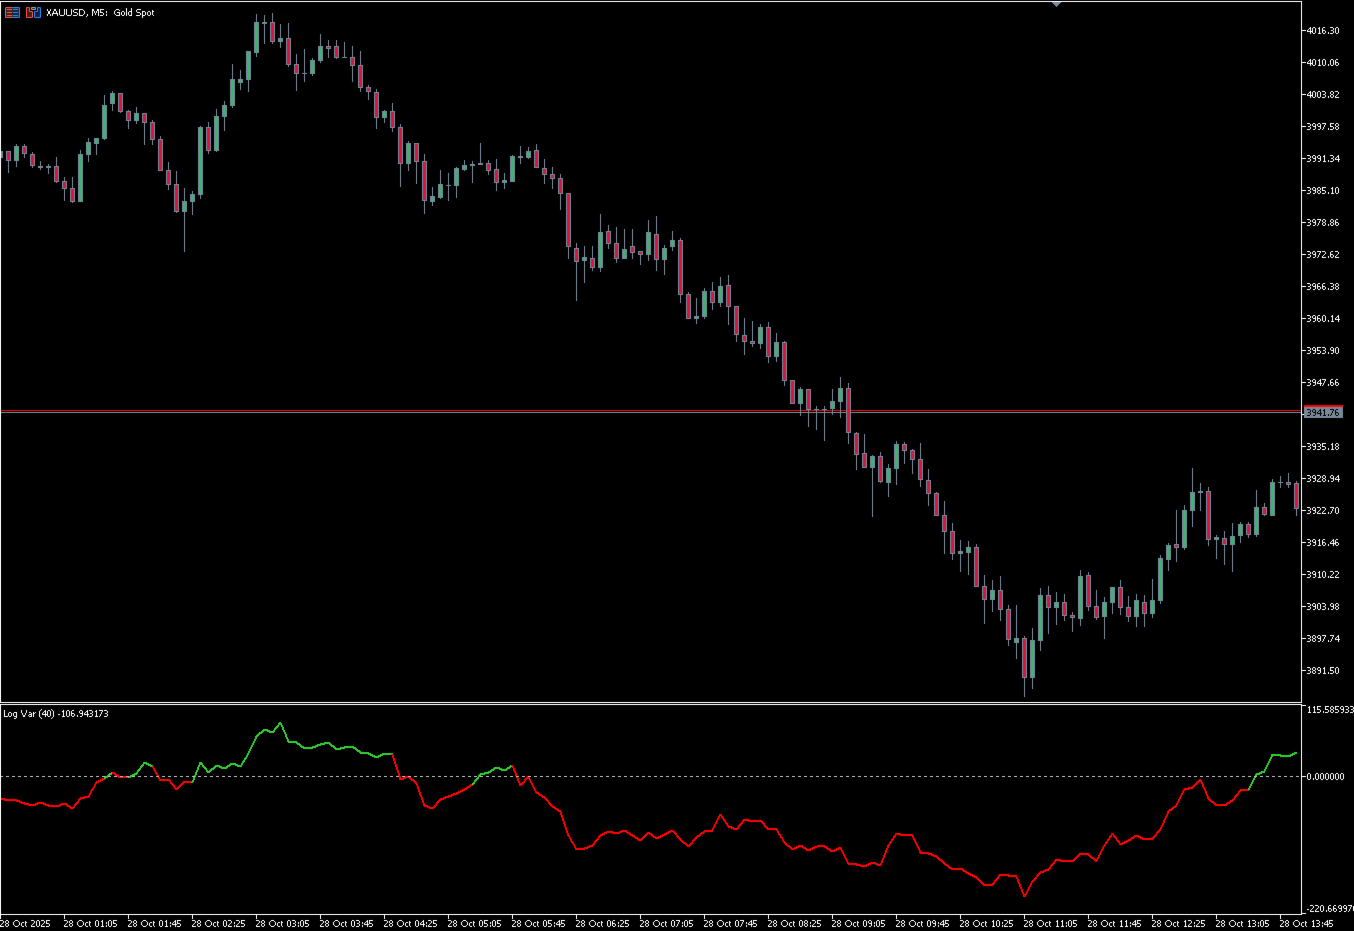
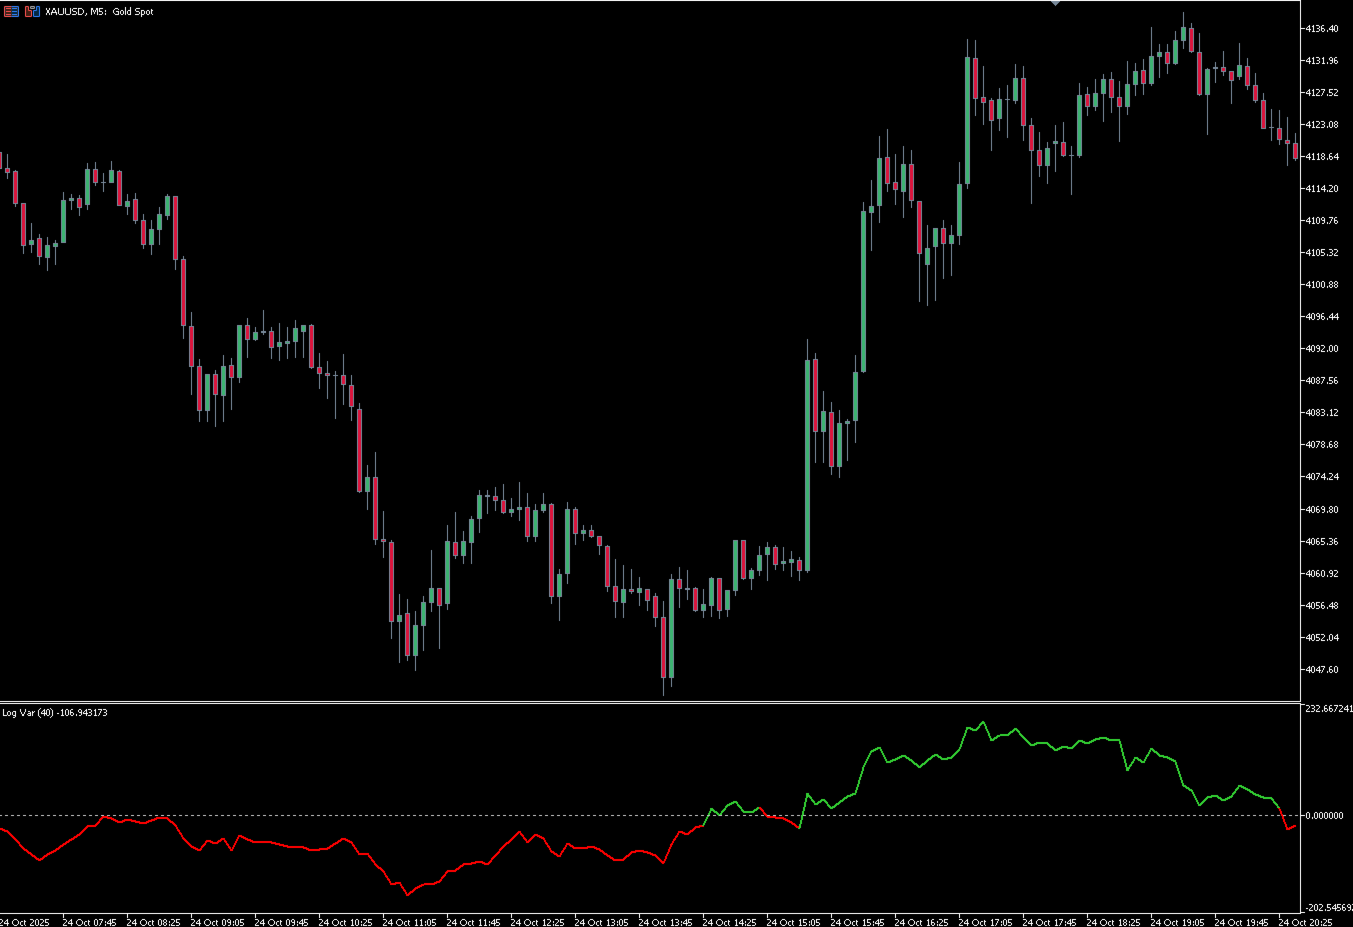
It compares the current closing price with the closing price n periods ago (defined by iPeriod) and presents the result on an amplified logarithmic scale, making it easier to visualize the strength and direction of movement.
The line is automatically colored according to the variation sign:
-
Green: current price above the reference (uptrend).
-
Red: current price below the reference (downtrend).
The 0 level is the neutral line — it visually separates positive and negative variations.
📈 Main features:
-
Measures true logarithmic variation (not a simple percentage).
-
Automatically adjusted visual scale.
-
Dynamic colors (green/red).
-
Central zero line.
-
Lightweight, fast, and compatible with any timeframe or asset.
💡 Suggested use:
Ideal for identifying trend shifts, measuring real movement intensity, and eliminating distortions from linear percentage changes.
Can be used as a trend filter or foundation for quantitative and trading bots.