YouTubeにあるマーケットチュートリアルビデオをご覧ください
ロボットや指標を購入する
仮想ホスティングで
EAを実行
EAを実行
ロボットや指標を購入前にテストする
マーケットで収入を得る
販売のためにプロダクトをプレゼンテーションする方法
MetaTrader 5のためのテクニカル指標 - 31
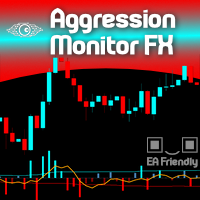
Would you like to monitor the aggression between Buyers and Sellers, minute by minute? Now you can! Welcome to the Aggression Monitor FX ! The Aggression Monitor FX indicator was developed for those markets that do not provide REAL data Volume, i.e. like the Forex market. We developed a way to use 1-minute Tick Volume data generated by Forex (and other) Brokers and manipulate it into "aggression" information in a very visual histogram with additional analysis lines. And it worked! (but hey! you

Looks for strong price movements and draws levels upon their completion.
You determine the strength of the movement yourself by specifying in the settings the number of points and the number of candles of the same color in a row in one direction.
There are 2 types of building in the settings: extrenum - high / low close - close price You can also adjust the number of displayed levels and the number of candles for calculations.
By default, the settings indicate 5 levels for 360 candles.
That
FREE
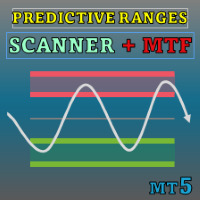
Special offer : ALL TOOLS , just $35 each! New tools will be $30 for the first week or the first 3 purchases ! Trading Tools Channel on MQL5 : Join my MQL5 channel to update the latest news from me 近年のボラティリティの高い金融取引市場では、サポートとレジスタンスを正確に見極めることが、トレーダーが的確な判断を下すために非常に重要です。 Predictive Ranges Scanner Multi-TF は、高度なツールであり、複数の通貨ペアと複数時間足にわたって将来のトレードレンジをスキャン・予測することで、市場トレンドを効果的かつ正確に把握できるようサポートします。 See more MT4 version at: Predictive Ranges MT4 Scanner Multi TF See more products at: All P ro

This MetaTrader 5 indicator plots ICT Killzone session markers on the chart using vertical lines . It draws the start and end times for three institutional trading sessions— Asian , London , and New York —for a user-defined number of recent historical days. No buffers or plots are used; instead, the indicator relies entirely on chart objects (OBJ_VLINE) .
1. Inputs and Parameters The indicator allows full customization of each killzone segment: General DaysToDisplay : number of past days to dra
FREE

This trading strategy is built around Open-Close Crossovers , a method of analyzing price movement based on the relationship between a bar's open and close prices. The system is designed to identify potential entry and exit points when these values cross over each other. Setup and Customization The strategy's performance can be customized by adjusting the resolution. A higher resolution, typically 3-4 times that of the chart , may be used to identify crossover signals earlier. However, this can
FREE

Indicator Name: Auto Trend Line Description: Automatically draws trend lines with optimized and enhanced trend direction detection. Main Features: 1. Automatic Trend Line Drawing: Two main lines are plotted: Support Line – color: Magenta Resistance Line – color: Cyan Lines are calculated based on: Two extremums (highs/lows) or an extremum and a delta (custom offset) 2. Trend Direction Detection: The indicator determines the current trend as: TREND_UP (Uptrend value = 1) TREND_DOWN (Downtrend val

!!!This Free Version just works on EURUSD!!! Wa Previous Candle Levels MT5 shows the previous candle levels, it shows the previous candle Open High Low Close levels (OHLC Levels) in different time frame. It's designed to help the trader to analyse the market and pay attention to the previous candle levels in different time frame. We all know that the OHLC Levels in Monthly, Weekly and Daily are really strong and must of the time, the price strongly reacts at those levels. In the technical anal
FREE

Account and Trading Dashboard Indicator
The **Account and Trading Dashboard** is a custom MetaTrader 5 (MT5) indicator designed to provide traders with a comprehensive, real-time overview of their account metrics, trading statistics, and technical indicators directly on the chart. It displays essential financial and performance data in a draggable, minimizable, and closable panel, enhancing usability without cluttering the workspace. The indicator supports optional features like ADX and RSI for
FREE

1. Overview The ATR Dynamic Stop (CE) is a powerful technical indicator designed to help traders identify and follow market trends. Its core function is to provide a dynamic trailing stop-loss based on price volatility, as measured by the Average True Range (ATR) indicator. The main objectives of the ATR Dynamic Stop are: Profit Optimization: It helps you ride a strong trend by setting a reasonable stop-loss, preventing premature exits due to minor market noise and fluctuations. Risk Management:
FREE

TrendScanner ALMA — トレンド変化を静かに見張る、軽量スキャナー TrendScanner ALMA は、指定した通貨ペアと時間足のトレンド状態を定期的にスキャンし、 変化の兆しを静かに検知・通知する軽量スキャナー です。 特徴 ALMA(Arnaud Legoux Moving Average)ベースのトレンド検出 なめらかで反応の良い ALMA を用いて、ノイズを抑えたトレンド判定を実現。 トレンド変化を静かに監視 上昇・下降・レンジに加え、 反転直後や変化中の状態も検出 。 通知モードを切り替えることで、 確定足ベース or リアルタイム検出 を選択可能。 複数通貨・複数時間足を一括スキャン 任意の通貨ペア・時間足を自由に組み合わせて監視対象に設定可能。 例:EURUSD H1, USDJPY M15, GBPUSD H4 など、 戦略に応じた柔軟な構成が可能 。 アラート通知に特化 トレンドの変化を検出した際に、 アラート・通知・ログ出力 を実行。 無駄な描画は一切なく、チャートを汚さずに情報だけを届けます。 軽量&静音設計 描画ゼロ、アラートも必
FREE

Ever feel lost in a trade, unsure of your true risk exposure? Have emotional decisions and a lack of discipline cost you dearly? The line between consistent profit and a blown account is drawn by one thing: professional risk management. But calculating and monitoring that risk in real-time is stressful and complex. Introducing Risk Matrix, the definitive visual command center for MetaTrader 5, engineered to bring military-grade discipline and crystal-clear clarity to your trading. Risk Matrix is
FREE

ZumikoFX Trading Stats - Professional Account Dashboard Overview ZumikoFX Trading Stats is a comprehensive, real-time account monitoring dashboard designed for serious traders who need complete visibility of their trading performance. This indicator displays all crucial trading statistics in an elegant, easy-to-read panel positioned in the top-right corner of your chart. Key Features Complete Account Monitoring Balance & Equity - Real-time account status with current balance and equity includ
FREE

If you like this product, please give it a 5 star rating as a token of appreciation.
This indicator draws vertical lines marking key Forex trading sessions (Asian, London, New York) for a configurable number of past days. These “Silver Bullet” lines help traders quickly visualize session start and end times on the chart.
DaysToDisplay: How many previous days’ session lines to show. Session colors: Customizable line colors for each session. Session start hours: Local server hours for each sessi
FREE

The WaveTrend Oscillator indicator is an enhanced version of the classic WaveTrend Oscillator, a momentum indicator. It is designed to identify overbought/oversold conditions and provide potential trend reversal signals. The core difference in this version is the application of a data "normalization" algorithm. This ensures the indicator's oscillation lines remain balanced around the zero line, causing the indicator window to always stay naturally centered. This is especially useful when trading
FREE
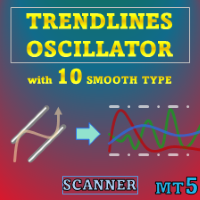
特別オファー : ALL TOOLS 、各 $35 ! 新ツール は 最初の1週間 または 最初の3回の購入 まで $30 ! MQL5 の Trading Tools チャンネル :最新情報を受け取るため、私の MQL5 チャンネルに参加してください Trendlines Oscillator は、現在価格と直近に検出された強気(サポート)および弱気(レジスタンス)のトレンドライン間の正規化距離を用いて、トレンドとモメンタムを識別します。
MT5 版はこちら: Trendlines Oscillator MT5 Scanner MT4 版はこちら: Trendlines Oscillator MT4 Scanner その他の製品はこちら: All P roducts 主な機能 強気・弱気それぞれのモメンタム線を個別に表示 交差マーカー付きのシグナル線を1本表示 データおよびシグナル線の任意の平滑化 使い方 本インジケーターは3本のライン(強気・弱気の2本のモメンタム線と、1本のシグナル線)を描画します。いずれかのモメンタム線がシグナル線を交差すると、
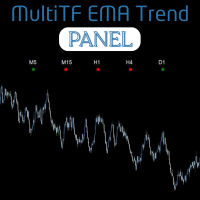
The MultiTF EMA Trend Panel is a clean, lightweight, and visually intuitive indicator designed to help traders quickly assess trend direction across multiple timeframes — all in one glance. It compares the relationship between two exponential moving averages (EMAs), typically the 50 EMA vs 200 EMA , across popular timeframes such as M5, M15, H1, H4, and D1 . You can customize the EMA settings and colors to match your own strategy or visual preferences. Key Features Multi-timeframe trend comparis
FREE
Spike Signal v1.2 — MT5インジケーター、Boom/Crashの急激なスパイクを検出し、スキャルピングシグナルを生成。 TF:
すべての時間足で動作(推奨:M1〜M15)。 ペア:
DerivのBoom/Crash合成指数向けに設計、他のボラティリティ資産にも対応。 設定: SpikeSensitivity / MinSize – スパイク検出感度と最小サイズ EMA (8/21) – エントリークロス信号 RSI (14) – トレンドフィルター TP/SL Points – 利確・損切ポイント Trailing Exit / Alerts – 追尾ロジックとアラート 簡潔な結論:
Spike Signal v1.2 は強い上昇・下降スパイクを自動検出し、Buy/Sell矢印を表示、TP/SLまたはトレーリングで出口を管理します。Boom/Crashスキャルピングに最適です。

The Custom Alert Lines.mq5 Indicator is designed to create two horizontal lines on the chart that serve as levels for alerts when the price crosses them. Key Functions and Features Two Customizable Lines (L1 and L2): The indicator allows the user to set the color, style, and thickness for each of the two lines via input parameters. Crossing Alerts: The indicator monitors when the closing price of the current bar crosses the level of one of the lines. Upon crossing, a pop-up alert is generated a
FREE

If you are (or were) a fan of the RSI indicator will love Tushar Chande's Dynamic Momentum Index indicator, that simply put is a dynamic variable lenght RSI, so it is more powerful. The DMI indicator internally uses a variable number of bars in its calculations, taking into consideration the volatility levels of the current market you are analyzing. This way, the DMI indicator will use more bars as volatility decreases and less bars when volatility increases, giving you a more powerfull analysis
FREE
Alpha Edge Pro – The Manual Trader’s Edge - If you prefer trading manually without stress, this indicator is for you. Get your copy now. Tired of missing the big moves or holding on to losing trades too long? Alpha Edge Pro is your new secret weapon. This high-performance, plug-and-play MT5 indicator gives you crystal-clear BUY and SELL signals — so you can trade with confidence, precision, and speed. If you prefer manual trading profitably , this indicator is made for you. Alpha Edge Pro does
FREE
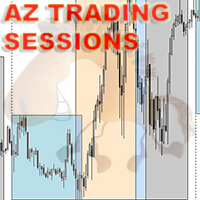
Attention - the indicator was initially developed for trading futures and the nuances of the Sunday session. This modification does not take into account the Sunday premarket, but is strictly tied to the time on the chart for correct operation on the spot market. Standard ATR indicator, you can enable ignoring abnormally large candles. It is possible to change the location of the displayed text in 4 corners of the chart. You can change the calculation period (days ago). Bonus - the indicator ha
FREE
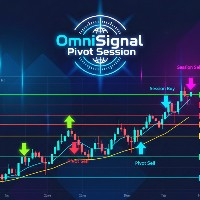
OmniSignal Pivot Session combines two powerful trading concepts— Daily Pivots and (NY, London and COMEX) Session Opening Levels —into one clean, intelligent signal indicator. It's designed to identify key market levels and provide clear, non-repainting entry signals based on a robust 3-candle confirmation pattern , helping you filter out market noise and trade with more confidence.
Suggested Symbols: XAUUSD, US30, DE40
(might have some bugs if you are using it with any Forex Pair!)
Core Fea
FREE

Free version of the TickScalper indicator. The Tick Scalp indicator is a trading assistant for a scalping trader. Works in a separate window. Tracks the momentary activity of the market, shows the graph of the movement of ticks and the strength of bulls or bears. Sometimes it can anticipate the beginning of a strong movement before any other indicators. Helps the trader to make a decision to open the desired order. Designed to work on any instrument. Used timeframes from M1 to M15. Has simple a
FREE

The purpose of using Smart money index (SMI) or smart money flow index is to find out investors sentiment. The index was constructed by Don Hays and measures the market action. The indicator is based on intra-day price patterns. The beginning of the trading day is supposed to represent the trading by retail traders. The majority of retail traders overreact at the beginning of the trading day because of the overnight news and economic data. There is also a lot of buying on market orders and shor
FREE

Indicator introduction:
The indicator is calculated by volumes and prices, It is a single side indicator, only has up arrow signals. It is better to use it in conjunction with other trend indicators, and you need to find the most efficient time to use it in order to acquire a high winning probability. The indicator can send emails, alerts and notifications to you when the indicator before k line has an up arrow. The indicator's parameters can be changed, including the computation period of the
FREE

Индикатор собирает данные из биржевого стакана, суммируя отложенные ордера на покупку или продажу. Далее, по сумме ордеров определяется общее направление, куда смотрят участники рынка. Если суммарные покупки/продажи превышают определенный коэффициент, то производится сигнал. Настройки: Timer=5 // указывается как часто обновлять данные по рынку в секундах. Чаще чем раз в 10 секунд ставить не рекомендуется. X-size =700 // размер окна по оси Х. Y-size=650// размер окна по оси Y. Only "Market Watch"
FREE

Hidden Edge – High-Low PreUS High-Low PreUS is a clean and lightweight indicator that marks key reference levels before the US session begins.
It draws a session box from 00:01 to 09:00 CET, identifying the high and low of the Asian session, and includes additional reference elements to support structured intraday trading decisions. Features Draws a rectangular range from 00:01 to 09:00 CET Marks the high and low of the session clearly Plots a horizontal yellow line as a suggested stop level bas
FREE

CustomRSI50 - レベル50のカスタムRSIインジケーター 説明 CustomRSI50は、人気のある相対力指数(RSI)に基づくカスタム技術指標です。このインジケーターは、多くのトレーダーがモメンタム分析で重要視するレベル50に特に焦点を当て、RSIの明確でカスタマイズ可能な視覚化を提供します。 主な特徴 設定可能なRSI期間 強調表示された50レベルの参照ライン カスタマイズ可能な適用価格タイプ 別ウィンドウでの表示 解釈が容易な0から100までの固定スケール カスタマイズ可能なパラメータ RSI_Period: RSI計算の期間を設定できます(デフォルト:14) applied_price: 計算に使用する価格タイプを選択できます(デフォルト:終値) CustomRSI50の使用方法 MetaTrader 5の任意のチャートにインジケーターを適用します。 RSI期間と価格タイプを好みに応じてカスタマイズします。 50レベルに対するRSIの動きを観察します: 50を上回る値は上昇モメンタムを示します。 50を下回る値は下降モメンタムを示します。 シグナルの解釈と上位サイク
FREE
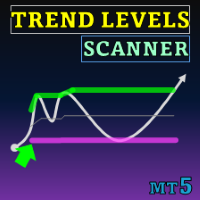
Special offer : ALL TOOLS , just $35 each! New tools will be $30 for the first week or the first 3 purchases ! Trading Tools Channel on MQL5 : Join my MQL5 channel to update the latest news from me トレンドレベル (Trend Levels) インジケーターは、相場の動きにおける重要なトレンドレベル(高値、中値、安値)を特定するために綿密に作られています。カスタマイズ可能な過去期間の最高値、最安値、および中値に基づくリアルタイム計算により、トレーダーにトレンドの動向と強さについて構造化された視点を提供し、精密かつ情報に基づいた取引判断を支援します。 MT4バージョンはこちら: Trend Levels MT4 他の製品を見るには: 全製品 トレンドレベルインジケーターの主な特徴と使用方法 トレンド変化シグナル インジケーターは、選択した入力期間内の最高値と
Breakout Shift Trader – MT5 Indicator Trade Like the Market Architects — Not the Victims. Most traders are fighting blind against a rigged game. Market makers engineer false breakouts, liquidity grabs, and “stop hunts” that wipe out retail accounts in seconds. Breakout Shift Trader flips the script. This MT5 indicator decodes the footprints left by institutional manipulation and aligns your trades with the power brokers driving real price action. Proven Results – Tested, Verified, Relentless N
FREE

PipVenom - Advanced ATR Trailing Stop Signal Indicator for MT5 Professional Visual Trading System with Real-Time Dashboard OVERVIEW PipVenom is a sophisticated visual trading indicator designed for MT5 that combines ATR Trailing Stop methodology with EMA crossover signals to identify high-probability trade entries. Built with precision and clarity in mind, this indicator provides crystal-clear visual signals with automatic Stop Loss and Take Profit levels displayed directly on your chart. P
FREE

In the world of finance, correlation is a statistical measure of how two securities move in relation to each other. Correlations are used in advanced portfolio management. This indicator measures how different securities move in relation to a reference one, thus making portfolio management easier. [ Installation Guide | Update Guide | Troubleshooting | FAQ | All Products ] Avoid concurrent trades in highly correlated instruments Find trading opportunities among highly correlated instruments Cor
FREE

The indicator shows supply and demand degenerated through tick volume.
The red line is the supply line.
The blue line is the demand line.
The green line is the total volume line.
Typical situations of indicator readings:
red is higher than blue - supply is higher than demand - the price is falling. blue is higher than red - demand is higher than supply - the price is growing. the red and blue lines tend to go down, but the blue is above the red - demand prevails, the price rises, but vola
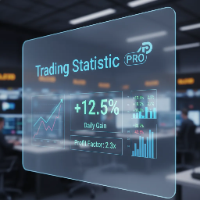
The statistical indicator for the metatrader 5 TradingStatisticPro collects statistical data on your trade, which makes it easier to assess the effectiveness of trading, the profit received and the risks. The indicator is compactly placed in the corner of the main chart of the terminal and displays the following information: 1. The profit earned. 2. Maximum drawdown. 3. The recovery factor. 4. Profit factor. 5. The ratio of profitable and unprofitable transactions (winrate). 6. Average profit a
FREE

Introduction MT5 ships with the Envelopes indicator. This indicator allows you to create equidistant bands from a moving average by specifying a “deviation.” Unfortunately, the deviation is an arbitrary number. You might determine that 0.220 works well to contain 95% of close prices for USDCHF,H1, but when you change the period to H4, most of the bars are now outside the bands. So, I created this self-tuning indicator. Instead of specifying a percent “deviation,” you specify the percent of bars
FREE

TrendScan is a visual scanner that detects bullish, bearish, or neutral trends across multiple symbols and timeframes. It analyzes market structure, EMA alignment, and price range to display clean, reliable signals. Ideal for traders seeking clarity and speed in their analysis.
Compatible with up to 25 symbols. Support for 8 timeframes. Advanced trend filters. Compact and customizable visual interface.

Non standard attitude to the standard moving average indicator. The essence of the indicator is to determine the strength and speed of the price direction by determining the tilt angle of the moving average. A point is taken on the fifteenth MA candle and a point on the last closed MA candle, a straight line is drawn between them, it is movable and on a hemisphere shows an angle of inclination from 90 degrees to -90. above 30 degrees is the buying area, below -30 degrees is the selling area. abo

This MT5 chart trend checker cuts through the noise of market volatility to provide a clearer picture of trends and price movements. It includes the following features that can provide more clarity during market assessments: 1 customizable multi-period moving average Optional Heikin-Ashi candles 3 switchable focus modes Distinct colors for easy analysis
Link to MT4 version: https://www.mql5.com/en/market/product/106708/
This indicator shows your preferred moving average from multiple time fram
FREE

The MP Andean Oscillator is used to estimate the direction and also the degree of variations of trends. It contains 3 components: Bull component, Bear component and Signal component. A rising Bull component indicates that the market is up-trending while a rising Bear component indicates the presence of down-trending market. Settings: Oscillator period: Specifies the importance of the trends degree of variations measured by the indicator. Signal line per: Moving average period of the Signal line
FREE
Multi-TF Trend Dashboard Short Description / Slogan: See the entire market trend in a single glance! A simple, clean, and powerful dashboard for every trader. Full Description: (1. For Free Distribution) Hello MQL5 Community, I am excited to share the Multi-TF Trend Dashboard , a tool I developed to simplify trend analysis. This indicator is offered completely free as a contribution to this amazing community. (2. Indicator's Functionality) Are you tired of constantly switching between timeframe
FREE

Volume Profile Order Blocks - A smarter way to visualize liquidity, volume, and key levels. Volume Profile Order Blocks is a cutting-edge indicator that enhances traditional order block strategies by embedding a detailed volume profile directly within each zone. This provides traders with a clear, data-driven view of where institutional interest may lie — not just in price, but in volume distribution. MT4 Version - https://www.mql5.com/en/market/product/146267/ Join To Learn Market Depth - h

Market Sessionsync** is a cutting-edge trading session indicator designed to enhance your trading experience by visually breaking down the market's daily rhythm. With a compact window overlaid on your chart, this indicator provides a split-second understanding of the current trading session through: Basic setup: Set Difference between your local time and your broker time , set DST(Daylight Saving Time) ON or OFF , set timescale sync you want to use (Local, Broker, CET) - A vertical time marker
FREE
Pivot Points Indicator – a fast, reliable, and fully customizable pivot detection for MetaTrader 5. This indicator uses MetaTrader’s native iHighest and iLowest functions to identify pivot highs and lows by scanning for the highest and lowest prices within a user-defined window of bars. A pivot is confirmed only when the current bar is the absolute maximum or minimum within the selected range, ensuring accurate and timely signals based on robust built-in logic.
Key Features No Repainting : Onc
FREE

The Volume Spread Analysis indicator is based on the original Volume Spread Analysis method. It was designed for quick and easy recognition of VSA patterns. Even though this indicator looks very simple, it is the most sophisticated tool we've ever made. It is a really powerful analytical tool that generates very reliable trading signals. Because it is very user-friendly and understandable, it is suitable for every type of trader, regardless of his experience.
What is VSA? VSA - Volume Spread A

The POC_Levels indicator calculates and displays the 3 most frequently occurring price levels (Points of Control – POC) based on historical candles. It is useful for identifying areas of high market interest (like support/resistance zones) across any timeframe. How It Works
The indicator analyzes the last LookbackBars candles. It counts how many times each price level (based on the selected price type) appears. Then it selects the top 3 most frequent prices and draws horizontal lines at those l
FREE

Santa Bollinger Indicator is an efficient way to detect price retracement in any market. A common approach is to identify overbought or oversold market conditions. When the price of the asset breaks below the lower band of the Bollinger Bands, prices have perhaps fallen too much and are due to bounce. On the other hand, when price breaks above the upper band, the market is perhaps overbought and due for a pullback . Advantages Generates instant buy and sell signals. Never repaints, never back
FREE

Investment Castle Support and Resistance Indicator has the following features: 1. Dictates the direction of Buy or Sell trades based on Support and Resistance Levels automatically . 2. Candles stick colors will change to Red for Sell and Blue for Buy (Default settings, user can change from the inputs). 3. This indicator is built-in the Support & Resistance based Investment Castle EA which works with Psychological Key Levels "Support & Resistance".
FREE

Ideal for scalpers, day traders and swing trades. Automatically identifies key support and resistance levels based on historical price data. It displays real-time trading zones and a precise countdown timer for each candle, helping traders make faster and more confident decisions. Fully customizable for multiple timeframes and instruments. The indicator analyzes historical price data to draw horizontal levels that represent key trading areas. It also displays, in real time, the current zone whe
FREE

This panel displays the price percentage change
Shows the percentage change in price from the last open: Daily, Weekly and Monthly timeframes. Numbers are easier to use than histogram currency meters. Line up the three timeframes strengths/weaknesses for strong trends. Compare currencies strongest against weakest. USD is the world's reserve currency to compare against.
How to use 1. Match the strongest currency with weakest currency; or 2. Match the strongest or weakest currency against USD;
FREE

Easy Scalper Every Candle
MT5 Indicator is a technical analysis tool designed for gold (XAUUSD) and major forex pairs. It generates buy and sell signals on each candle using multiple filters, volume dynamics, and market structure logic. The indicator is developed for scalpers and intraday traders who require structured, rule-based signals without unnecessary complexity. Key Features 1. Candle-Based Logic Generates buy and sell signals on every candle. Uses multi-condition filters to reduce noise

Highly configurable Volume indicator.
Features: Highly customizable alert functions (at levels, crosses, direction changes via email, push, sound, popup) Multi timeframe ability Color customization (at levels, crosses, direction changes) Linear interpolation and histogram mode options Works on strategy tester in multi timeframe mode (at weekend without ticks also) Parameters:
Volume Timeframe: You can set the lower/higher timeframes for Volume. Volume Bar Shift: you can set the offset of the l
FREE

Identification of support and resistance areas
A useful indicator for traders
completely free
Can be used in all symbols
Can be used in all time frames
It has three different trends: short term, medium term, long term
Settings:
Clr1,2: You can change the color of the lines
Type Trend: You can determine the trend
Message me for questions, criticism and suggestions
FREE
The Kalires Channel Indicator is a technical indicator used to evaluate trend direction and potential trading opportunities. This is a hybrid indicator that combines Kauffman Adaptive Moving Average (KAMA), linear regression and smoothing. The Kalires Channel Indicator consists of two lines: one central and two outer bands. The central line is a smoothed KAMA modified according to the direction of the trend. The outer bars represent two linear regression lines drawn above and below the center l
FREE

New Candle Alert is a simple indicator that notify you when a new candle is formed. Func tions : Alert type - option to choose between message with sound or only sound. Message - alert message. Push notifications - enable push notifications. Show timeframe - show the symbol timeframe. Show hour - show the alarm time. Test message - if you don't want to wait a new candle formed to see the message. MT4 version: https://www.mql5.com/pt/market/product/37988 Hope you enjoy it. Any doubt or su
FREE

MACD Histogram tracks the difference between the MACD line and the Signal line (which is the exponential moving average of the first line). For better visibility, when plotting the lines and the histogram in the same window, we scale up the histogram by a factor of 2. Furthermore, we use two separate plots for the histogram, which allows us to color-code the bars for upticks and downticks. The MACD Combo overlays MACD lines on MACD Histogram. Putting both plots in the same window enables you to

MultiFrame Volume Trend (MFVI) is a powerful VWAP-based indicator that displays volume trends across multiple timeframes in a clean, easy-to-read dashboard directly on your chart. Instantly capture the overall market direction in just seconds. Features Multi-timeframe VWAP analysis from M1 to MN1. Dashboard panel shows the trend state of each timeframe at a glance. Plots VWAP line and buy/sell arrows directly on the chart. Fully customizable: colors, line width, panel position, arrow symbols. Bu
FREE

To review our products, please click the link: LINK This Classic Pivot Point Indicator accurately calculates and displays 7 essential pivot levels , including the Pivot Point , 3 Support levels (S1–S3) , and 3 Resistance levels (R1–R3) based on the standard classic pivot formula . Designed for Forex, indices, commodities, and crypto trading , it supports multi-currency and multi-timeframe analysis in a clean, professional dashboard interface . With the built-in interactive dashboard , traders c

The MT5 platform indicator has standard settings and requires no modifications when connected to the chart. Modifying the indicator involves adding two functions: Marking the area when the indicator lines are in the correct sequence (green line above or below red and blue lines, and red above or below blue). This creates a confirmed cross marked by the closing price to avoid false signals during the Alligator lines' entanglement periods. Drawing horizontal rays from market structure break levels

Enhance your trading analysis with the Hull Suite MT5, a complete set of Hull Moving Average tools designed for smooth, low-lag trend visualization and enhanced precision. Developed from Alan Hull’s Hull Moving Average (HMA) concept introduced in 2005, this indicator integrates multiple Hull variations into a single flexible system, giving traders the ability to fine-tune responsiveness and visual style for clearer trend identification across forex, indices, commodities (like XAUUSD), and crypt

We at Minions Labs love to study, challenge and discover new facts about Price Behavior in current markets. We would NOT call it Price Action because today this is a word totally overused and means, thanks to the False Prophets out there, absolutely NOTHING.
The study hypothesis we propose is this: Some Assets, in certain Timeframes, present a behavior of Price continuity when the candlesticks close without a Wick on them... So the purpose of this indicator is to "color" those candlesticks who
FREE
Spike Detector Pro - Advanced Fast Movement Detection System Introducing Spike Detector Pro, a professional tool developed for traders seeking opportunities in fast price movements. This exclusive indicator combines sophisticated technical analysis with multiple confirmation layers to identify high-probability setups. Main Features: Specialized algorithm for detecting price spikes in advance Multi-layer filtering system (momentum, volume, volatility, and price action) Optimized configuration for

Limited Time Offer! Just $59 — valid until the end of this month! Trinity-X : The Next Generation of Trend Intelligence Imagine having a professional market analyst sitting beside you 24/7 — one who never gets tired, never misses a signal, and speaks your language.
That’s exactly what Trinity-X delivers. This AI-optimized, rule-based trend intelligence system is built on years of trading expertise, powered by a proprietary Rule-Based AI Optimization Engine .
It doesn’t just react to price movem

Ratio X Trend Watcher – Advanced Trendline Breakout Indicator
Ratio X Trend Watcher is a professional indicator designed to analyze price action, draw trendlines on the current chart timeframe, and detect meaningful breakouts. Built for traders who rely on support and resistance levels, this tool offers clear visual cues and optional automated actions to help improve your trading decisions. Developed by Mauricio Vellasquez, it is part of the Ratio X suite of trading systems. Key Features Real‑t
FREE

This indicator shows current major support and resistance, if one exists. And as a support or resistance is broken it shows the new current, if any. To identify support and resistance points it uses the high and low points identified on the current chart. Allows too you to inform the maximum number of bars used to consider a support or resistance point still valid.
FREE

For those Price Action traders who love to trade strong Price points, like yesterday's HIGH and LOW, here is an indicator to ease the identification of those values, drawn directly on your chart! MIN/MAX of the Day will automatically draw 2 lines showing you those points for you, AND, if you like any HIGH and LOW in the past, not just yesterday's prices. It can also be configured to additionally show today's HIGH and LOW prices - just configure the refresh rate of those lines at your own taste/s
FREE

このインディケーターはEAの一部です: HIPERCUBE PRO GALE BTC Darwinex Zeroの20%割引コード: DWZ2328770MGM_20
Donchianインディケーターの新バージョンを発表
私たちは、 新しいバージョンのDonchianインディケーター を発表できることを非常に嬉しく思います。最先端の改善と精度を備えた設計で、今や HiperCube Pro Gale に完全対応。このアップデートされたツールは、より効果的なトレードに向けたスムーズな体験を提供します。
このバージョンが画期的な理由:
HiperCube Pro Gale対応 : この最新アップデートは、 HiperCube Pro Gale との統合を念頭に置いて特別に設計されており、トレード戦略における最大の互換性と効率性を保証します。 比類なきパワー : Donchianインディケーターは市場動向を追跡するための人気ツールであり、新バージョンではその性能が最適化されています。 実証済みの効果 : 市場の動きを予測するその能力により、Donchianインディケーターは
FREE

Seeing and interpreting a sequence of Candlesticks is easy to spot when you are a human... Higher Highs, Higher Lows, are the panorama of a Buying trend, at least in a short period of time... Seeing a current candlestick higher high and a lower candlestick low, as a human, you can immediately spot a "divergence", an "alert", a "starting range", but in the end and based on other analysis a human trader can understand and behave accordingly to this kind of candlestick data... But what about EAs (r
FREE

MACD Scanner provides the multi symbols and multi-timeframes of MACD signals. It is useful for trader to find the trading idea quickly and easily. User-friendly, visually clean, colorful, and readable. Dynamic dashboard display that can be adjusted thru the external input settings. Total Timeframes and Total symbols as well as the desired total rows/panel, so it can maximize the efficiency of using the chart space. The Highlight Stars on the certain matrix boxes line based on the selected Scan M

Ritz Smart Trend Adaptive Finder – Auto-Detect Dynamic Trend Channels A powerful trend detection indicator that adaptively analyzes price structure using dynamic ATR and statistical filters to discover the most significant trend channels on any timeframe and symbol. This tool automatically finds the most relevant period and slope for price movement and draws upper/lower channel zones, midline (mean), and trend support/resistance. Suitable for trend-following, breakout, and mean-reversion strateg
FREE
The ATR (Average True Range) Indicator is a powerful tool designed to measure market volatility. This indicator provides accurate data on price movement ranges, helping traders manage risk more effectively and make well-informed trading decisions. Based on the widely-used ATR indicator, it’s suitable for both professional and beginner traders to analyze market volatility. The ATR Indicator allows you to track the current price movement range and use this information to set stop-losses, select en
FREE
MetaTraderマーケットはMetaTraderプラットフォームのためのアプリを購入するための便利で安全な場所を提供します。エキスパートアドバイザーとインディケータをストラテジーテスターの中でテストするためにターミナルから無料のデモバージョンをダウンロードしてください。
パフォーマンスをモニターするためにいろいろなモードでアプリをテストし、MQL5.community支払いシステムを使ってお望みのプロダクトの支払いをしてください。
取引の機会を逃しています。
- 無料取引アプリ
- 8千を超えるシグナルをコピー
- 金融ニュースで金融マーケットを探索
新規登録
ログイン