 MetaTrader 5
 Experts
 지표
 라이브러리
 유틸리티
 위젯
 규칙
MetaTrader 4용 Expert Advisor 및 지표 - 30
 트레이딩 로봇은 자동으로 시장거래를 수행하는 반면 지표는 가격을 더 잘 분석하고 가격 행동을 예측할 수 있게 해줍니다.
이러한 어플리케이션을 사용하면 MetaTrader 4에서 더 많은 기회를 포착하는 동시에 보다 정보에 입각한 방식으로 거래를 수행할 수 있습니다.

Expert Gold Printing is a fully automated Expert Advisor developed exclusively for Gold (XAUUSD), powered by advanced proprietary trading algorithms. It combines a high-precision scalping strategy with intelligent position management and risk management to capture high-probability market opportunities while maintaining disciplined control over risk. The EA continuously analyzes market momentum and changing volatility to identify favorable entry conditions. Every trade is protected with a Stop L

Gold Wick Support Resistance Map is a professional MT4 wick-reaction mapping indicator designed to help traders read hidden price reaction areas created by candle wicks, liquidity sweeps, rejection points, breakout zones, and market structure. Most support and resistance tools focus on simple highs, lows, or candle-body levels. This indicator takes a different approach. It focuses on wick structures, because wicks often show where price tested liquidity, reacted strongly, rejected, or completed

ProCalc Visualizer and ProTrader Console – Advanced Risk Calculator and Trading Panel for MetaTrader Take complete control of your risk management and maximize your trade execution speed. ProCalc Visualizer (combined with the order execution bar in the ProTrader Console) is a comprehensive, intuitive tool designed for demanding traders who value precision, clear charts, and lightning-fast execution speed. Say goodbye to manual lot size calculations – the panel automatically adjusts position siz
Multi Chart Sync MT5 is a tool that synchronizes the chart symbol it is placed on to other charts, it can also be customized to exclude/skip some pairs from being synchronized to other charts, It also supports prefixes and suffixes that can be set from the input parameters for brokers with none-standard symbol formats, Synchronisation can be done once or continuously where if a synchronized chart symbol changes it will be reverted to the original/master symbol. This tool comes in handy for multi

The Best and Worst indicator (similar to Net Change Indicator) has the peculiarity of being a dynamic indicator. It seems a very Stock Exchange Indicator. This means that it is able to draw up a list and put in order the best and worst instruments in descending order. You can choose to show the percentage of any Time Frame: 1M, 5M, 15M, 30M, H1, H4 etc ... This instrument could really give great suggestions on your trading in order to center the right time and to have a total view of the markets
The most simple and easy to use Timed Exit EA to close all trades automatically at specific time each day (hours:minutes:seconds) (by Rimantas Petrauskas) The main idea of this EA is to automatically close trades daily at your specified time. For example if you set EA to close all trades at 15:29:30, EA will do this each day when markets are open. This way you can set the EA to close all trades before the news. EA should be attached to a separate chart of any time frame on your MT4 and it will s
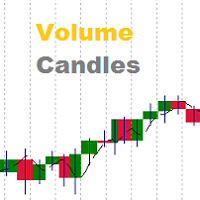
Volumes are one of the most important factors of trading, as it is the high volumes that move the market in either direction. But there are very few standard indicators for volumes in MetaTrader 4. The Volume Candles analyses the volumes of the trades and displays candles depending on these volumes. The candle appears once the required number of volumes has passed during trading (the VolumeCandle parameter). If the candles close frequently and are thin, then the volumes on the market are current
The Signal Envelopes indicator uses the robust filtering method based on: (1) the moving median Buff0 = <Median> = (Max {x} + Min {x}) / 2 and (2) the averaging algorithm developed by the author Buff1 = <(<Median> ) ^ (- 3)> * (<Median>) ^ 4 based on the moving median. The Signal Envelopes indicator allows you to most accurately and with the minimum possible delay set the beginning of a new trend. The Signal Envelopes indicator can be used both for trading according to scalpe

The indicator displays the data of the Stochastic oscillator from a higher timeframe on the chart. The main and signal lines are displayed in a separate window. The stepped response is not smoothed. The indicator is useful for practicing "manual" forex trading strategies, which use the data from several screens with different timeframes of a single symbol. The indicator uses the settings that are identical to the standard ones, and a drop-down list for selecting the timeframe.
Indicator Paramet

This simple, yet powerful indicator is very good way to determine actual S/R levels. It's main purpose is making your overview on markets much better.It has built-in arrow signal system, which should be used along with MT indicators for best results.Just try it.
Recommended MT indicators to use along:
Bollinger Bands (default) RSI (period 3, levels 10/90)
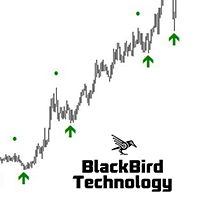
Multi Level Trend Swing is an indicator that identifies the most accurate buy/sell swing points with the highest probability, based on multi-level Zig Zag Swings. The indicator paints arrows at the Higher Highs, Higher Lows, Lower Lows and Higher Lows in the chart, but based on two level Zig Zag Swing. If the fast price swing is in line with the trend of the slow price swing, then the buy/sell arrows are biggest. If the price swing is against the trend, dots are displayed to signal a Higher High
Introduction
The Convergence Divergence Suite contains 17 indicators , built-in MT4 technical indicators and custom ones . The list will be increased in subsequent versions as per users' requests. Any selected indicator is loaded on your chart then automatic Convergence and Divergence trend lines are drawn on the chart and indicator. This tool is important if you use any of the listed indicators or convergence/divergence in your strategy. Advantages With the Convergence Divergence Suite you d

RSI Double Cross Robot is a fully automated expert advisor based on a classic yet powerful momentum concept — the crossover of two RSI indicators with different periods. The robot identifies trend changes and market momentum shifts by tracking the interaction between fast and slow RSI values. Trades are opened only when clear directional signals appear, while a built-in volatility filter helps avoid flat and low-activity market conditions. RSI Double Cross Robot applies strict risk management,

Before news release, the EA places two pending orders at a preset distance from the current price – BUYSTOP and SELLSTOP. If the published news does not immediately cause a strong price movement, and the price starts to slowly move in a certain direction, the EA moves one of the order away, and the other one is moved closer following the price, until the price starts moving fast or the orders expire. This makes it possible to place orders as close as possible to the price (20-30 points for the f
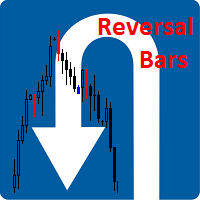
Description The indicator determines the appearance of the bars that signal of a reversal of current local moods and plays a beep. It also paints these bars in accordance with the bullish and/or bearish priority. You can select the color for bullish and bearish moods.
Inputs Sound_Play - a flag that allows the sound notification.
Use Detection of the reversal bar can be a signal to perform appropriate trading activities. The indicator can be used for manual or automated trading in an Expert A

Gold Trend Following Expert Advisor (EA) is a sophisticated, fully-automated trading algorithm designed to maximize profitability in the gold market (XAUUSD). Optimized for a 1-minute timeframe, this EA is perfect for high-frequency traders and those who prefer to automate their trading activities. This EA implements a robust trend-following strategy, combining multiple technical indicators to make informed trading decisions. It utilizes the Moving Average Convergence Divergence (MACD), Exponent
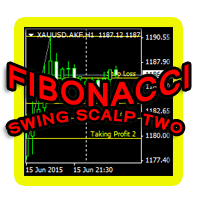
This indicator is another variant of the famous powerful indicator Fibonacci-SS https://www.mql5.com/en/market/product/10136 but has different behaviour in placing Pending Order and TP Line. Automatically places Fibonacci retracement lines from the last highest and lowest visible bars on the chart with: An auto Pending Order (Buy/Sell). Taking Profit 1, Taking Profit 2 is pivot point and Taking Profit 3 for extended reward opportunity. The best risk and reward ratio.
Simple and powerful indicat

SmartChanel is a universal indicator for all types of markets. This indicator should have in its arsenal every trader, since it represents a classic approach to analyzing the price of a trading instrument and is a ready-made trading strategy. The indicator forms the upper, average price movement limit.
Advantages of the indicator works with any trading tool works on any time period can be used both in the classical market and in the binary options market the indicator has no settings and is se

Stop Surviving. Start Hunting. You have seen what gold does to accounts. One minute you are in profit, the next a "unexpected" FOMC speech or geopolitical headline sends price 200 points against your position, shredding standard grid EAs and leaving nothing but margin calls. Most robots fail because they assume the market is static. Franky Gold assumes the market is a living predator — and it adapts its DNA to match. Two Brains, One Goal Inside Franky Gold lies a dual-core intelligence system th

Ever wondered why standard ADX is made unsigned and what if it would be kept signed? This indicator gives the answer, which allows you to trade more efficient. This indicator calculates ADX values using standard formulae, but excludes operation of taking the module of ADX values, which is forcedly added into ADX for some reason. In other words, the indicator preserves natural signs of ADX values, which makes it more consistent, easy to use, and gives signals earlier than standard ADX. Strictly s

General information The indicator determines the areas of flat and trending market states by comparing the average and current volatilities. Flat areas are rectangles of a user-defined color. It is easy to determine the maximum and minimum of the flat area, as well as its height in points. The beginning of each trend area is marked with an arrow indicating the direction of the trend.
Tuning parameters
1. Averaging period - period for calculating average volatility
2. Color of flat region -
MOVING AVERAGE ON OFF BUTTON as the name suggest you can disappear and reappear up to 5 moving average with a single click. This can save a lot of time and energy for the traders. you can change the color, period and shift of the moving average as you wish you can move the on off button where ever you want you can also change to simple moving average, exponential moving average and much more types of moving averages to know more about the the indicator and how to use it watch the video linked b

Breakout Expert Advisor for XAUUSD (Gold) — places ATR-filtered pending Buy/Sell orders based on recent high/low ranges (recommended H1). Short overview:
Gold Highest BreakOut is an automated Expert Advisor designed for trading XAUUSD . It places pending Buy Stop / Sell Stop orders at breakout levels derived from recent High/Low ranges and uses ATR and range filters to reduce false entries. Key points: Strategy: breakout from recent High/Low over configurable period. Filters: ATR-based v
Tick Volume Chart — fixed volume bars for MetaTrader 4. The tool creates charts on which each candle has a fixed tick volume. Data sampling is carried out not by time but by the tick volume. Each bar contains a given (fixed) tick volume. Tick volume can be adjusted by changing the value of the Volume parameter. You can apply indicators, Expert Advisors and scripts to the tick chart. You get a fully functional chart, on which you can work just as well as on a regular chart. In the process of work
Renko Chart — opens renko charts for MetaTrader 4. Renko charts can be created using this utility with all bars being in the form of Renko "bricks". All bars on the renko chart are the same size, which can be changed to get the desired chart. You can add indicators, EAs and scripts to the resulting chart. You get the completely operational chart which can be processed just like a regular one. The Renko Chart utility is not only history based, but also builds online. At the same time, the data is

KT Average Daily Range(ADR) shows the upper and lower levels using the average daily range covered by the currency pair or the instrument. The average daily range is calculated using the chosen period in the input settings. ADR High: ADR upper level is found by adding the average daily range value to the current day's low.
ADR Low: ADR lower level is found by subtracting the ADR value from the current day's high.
Features
It shows the ADR levels with several other helpful information benefici

The Liquidation Zones Heatmap is a custom technical indicator designed for the MetaTrader 4 (MT4) platform. It calculates and visualizes estimated liquidation zones based on price action and internal algorithms, displaying them as a dynamic heatmap on the chart. These zones are known by several names, sometimes referred to as liquidity pools, liquidity levels, leverage levels, liquidation heatmap levels, leverage heatmap zones, or leverage heatmap levels. These zones represent potential areas of
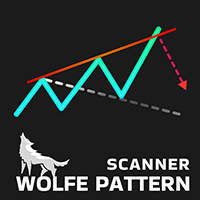
Contact me after payment to send you the user manual PDF file. Introduction Introducing the Wolfe Pattern Indicator, a powerful tool designed to help traders identify and capitalize on the elusive Wolfe Pattern in financial markets. This innovative indicator uses advanced algorithms to scan for the Wolfe Pattern in all symbols and time frames, providing traders with a unique edge in the market. How to trade with the Wolfe Pattern The Wolf Pattern is a rare and lucrative trading opportunity that

Dragonfly is an expert Advisor for real professionals. It is the quintessence of rational and technical analysis. The expert Advisor can be used both for dispersing small deposits and for conservative work.
Main:
"TakeProfit" - Number of points to close a trade with a profit
"StopLoss" - Number of points To close a trade with a loss
"Slippage" - Slippage
"Magic" - adviser ID
"Lot"- the amount of the transaction
Dynamic lot settings:
"Dynamic" - enables/disables dynamic calculation of th
FREE

This is the multi-time frame Fisher Divergence indicator for MetaTrader 4, with signal arrows and a Signals panel which is freely movable showing the last signals and their time in color. The indicator draws some lines based on signal time. On the time frames below H4, the indicator scans for H4 divergence signals and draws it on chart with thick trend lines, and also it draws arrows for them. And also it scans the current time frame and draws a line at divergence location and places signal arro
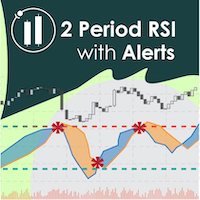
Two Period RSI + Alerts compares long-term and short-term RSI lines, and plots a fill between them for improved visualization. Fill is colored differently according to an uptrend (short period RSI above long period RSI) or a downtrend (short period RSI below long period RSI). Short-term RSI crossing long-term RSI adds a more robust trend confirmation signal than using single period RSI alone. This is a tool to help visualize and confirm RSI trends. We hope you enjoy!
Alerts Email, message, and

MT4 MT5 Trade Bridge for MetaTrader 4 is the MetaTrader 4 component of the MT4 MT5 Trade Bridge system. It allows a MetaTrader 4 terminal to work either as a Master or as a Slave in a local bridge connection with MetaTrader 5. When configured as Master , the MT4 component reads trading activity from the MetaTrader 4 terminal and writes structured trade data into a local bridge file. The connected MT5 component can then read this data and mirror the trading activity according to its selected set
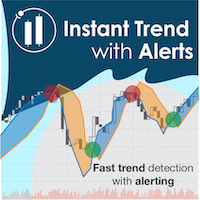
Catch major price movements, early in the trend. Alerts you to enter at the likely beginning of a trend, and if it's incorrect, quickly alerts you to exit to limit any loss. Designed to capture large, profitable price movements, with early entrance to maximize your returns. As shown in screenshots, typical behavior is several quick entrance/exists with small loss , and then capture of a large trend with high profits . The Instantaneous Trend indicator is a lag-reduced method to detect pri

Place Fibonacci Retracements in Seconds—with Wick-to-Wick Precision.
Drag Fib makes Fibonacci placement faster, cleaner, and more precise. One simple vertical drag places a retracement from wick to wick across the selected trend leg. As the move extends, the Fibonacci structure adjusts automatically. Saved placements remain anchored across timeframe changes and are stored separately for each symbol. Faster placement. Greater precision. Less repetitive chart work.
Built for Traders Who Want To
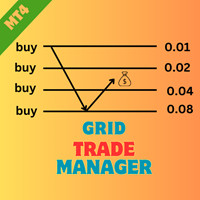
EA HedgeTradeManager MT4을 소개합니다. 이는 헤징 전략을 자동화하도록 설계된 강력한 Expert Advisor로, 트레이더에게 불리한 가격 변동을 관리할 수 있는 신뢰할 수 있는 도구를 제공합니다. 이 EA는 헤징 기법을 탐색하는 초보 트레이더와 거래 설정을 향상시키고자 하는 경험이 풍부한 전문가 모두에게 적합합니다. MQL 제품 설치 가이드 | 구매한 MQL 제품 업데이트 (MT4/MT5) | 일반 문제 해결 가이드 | 일반 설정 / 입력 가이드 | 백테스트 및 설정 파일 정교한 위험 관리 기능을 갖춘 EA HedgeTradeManager MT4은 잠재적 손실을 크게 줄이고 유연한 lot 크기를 허용하여 돋보입니다. 트레이더는 동적 lot 진행 및 자본 기반 종료 전략을 활용하여 forex, 지수 또는 암호화폐에서 변동성이 큰 시장을 효율적으로 탐색할 수 있습니다. MQL 제품 설치 가이드 | 구매한 MQL 제품 업데이트 (MT4/MT5) | 일반 문제 해결 가
FREE

MA Crossover Arrows is a simple indicator that draws arrows and alerts when two moving averages crossover.
Supported types of moving averages Simple Exponential Smoothed Linear Weighted
Supported Price types Close Open High Low Median Price (HL/2) Typical (HLC/3) Weighted Close (HLCC/4) When the fast moving average crosses above the slow moving average, a green up arrow will appear on the chart. When the fast moving average crosses below the slow moving average, a red down arrow will appear on
FREE

SL TP Indicator MT4 - PIP TradeBoxes is a visual trade planning tool that helps you clearly preview Stop Loss and Take Profit zones directly on your chart before entering a trade. Instead of estimating risk manually, this indicator displays clean SL and TP trade boxes, allowing you to instantly understand your risk-to-reward in real time. What this indicator does This tool is designed to help traders plan and visualize trades before execution, while also monitoring active trades with clear on-ch

Vizzion is a fully automated scalping Expert Advisor that can be run successfully using GBPJPY currency pair at H1 timeframe. Very Important
This Expert Advisor can not run with any EAs in the same account. As part of the money management plan, it calculates and monitors the Margin Level % and assumes that all open trades are created by it. If you want an Expert Advisor that trades in a daily basis, this EA is not for you because using this requires a patience to wait for a few days or weeks on

Pointer synchronization is an indicator with which the pointer can be synchronized in all the visible charts of the terminal. It shows a crossed cursor in all the visible charts of the terminal, in position relative to the cursor of the active chart. To activate the indicator, simply press the button that appears in one of the corners of the chart once the indicator is added to the chart. To deactivate the indicator, simply press the button again. Once the indicator has been deactivated, the cr

EA Hyperaktif – Adaptive Trend-Following Expert Advisor EA Hyperaktif is an automated trading system designed for MetaTrader 4 that combines momentum candle setups with a custom Pine Script ATR Rope Filter . Built to navigate volatile markets like XAUUSD (Gold) and major Forex pairs, this EA identifies strong trend continuations while filtering out market noise during sideways or low-volatility conditions. Key Features Pine Script ATR Rope Indicator Integration: Utilizes an advanced adaptive t

Gold Purity – Fully Automated XAUUSD Trading Solution
Gold Purity is a fully automated Expert Advisor designed to deliver high-performance, stable, and hands-free trading. Pre-configured with optimized default settings, it allows you to launch immediately—no complex setup or endless tweaking required. Whether you are a beginner seeking simplicity or an experienced trader looking for strategic flexibility, Gold Purity provides advanced risk controls and dynamic position management for long-ter

Don't purchase before testing the Demo version first. DEMO version: https://www.mql5.com/en/market/product/76917 __________________________________________________ This EA - Tool allow you replay bar in Meta Trader 4 for back test. This Tool can back test in multi timeframe in only one chart. This Tool is very useful for Price action trader. It can work with Indicators, some indicators cannot works. So please download Demo to test before purchase. Demo Version We do not accept refund in any
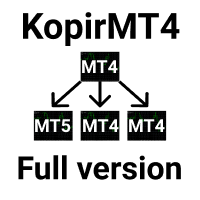
The adviser has been withdrawn from sale KopirMT4 (CopierMT4) - transaction copier for the MetaTrader 4 terminal, copies (synchronizes, duplicates) transactions from any accounts (copier, copy dealers).
Supports copying: MT4 <-> MT4, MT4 -> MT5 Hedge, MT5 Hedge -> MT4 Support: https://www.mql5.com/ru/messages/01c3f341a058d901
Why exactly our product? The copier has a high speed and is not dependent on ticks. Copy speed - less than 0.5 sec. Transactions are copied with high accuracy, the sc

Gold Miner MT4 strategy is based on the search for areas of concentration of prices of large buyers and sellers. In such zones, short-term trends are usually generated. This is a grid EA, but thanks to the function of overlapping unprofitable orders, it is able to withstand large drawdowns and recover the account. Works well on volatile pairs and gold (XAUUSD, GBPUSD, USDCAD, EURUSD, USDJPY, USDCHF, AUDUSD, NZDUSD ... ). It has many useful functions, such as closing orders on Friday or w
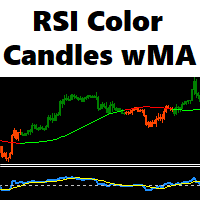
See RSI values turned into colored candles
This indicator provides both colored candles and a colored moving average. 6 drawaing styles are provided to allow customization of the color coding.
Applying coding to the chart may help in conceptualizing price trend and impulse movements defined through RSI values.
Features - optional colored candles - optional colored ma - 6 draw styles; RSI slope RSI above/below overbought/oversold levels RSI above/below level 50 RSI above/below it's moving average
FREE

BF News Trader EA is the most advanced FREE tool for high impact news trading on the market. Usually, when a major news event occurs, the price spikes in one or both directions and this creates an opportunity for short-term scalping. If the magnitude of the price movement is big enough, the trader could gain 20, or in some rare cases even more than 100 pips in a few seconds. Of course, nothing is perfect and the liquidity issues in such high volatility moments could lead to spread increase, exe
FREE
Developed by Etienne Botes and Douglas Siepman, the Vortex Indicator consists of two oscillators that capture positive and negative trend movement. In creating this indicator, Botes and Seipman drew on the work of Welles Wilder and Viktor Schauberger, who is considered the father of implosion technology. Despite a rather involved formula, the indicator is quite straightforward to understand and easy to interpret. A bullish signal triggers when the positive trend indicator (VI+ green line) crosse
FREE

This EA is specifically designed for trading USOil on brokers that offer a positive long swap , providing an advantage for both trading and long-term investment. The recommended minimum capital is $1,000–$1,500 (Available for Cent Account Also). However, before using the EA, it is important to review your broker’s USOil contract size in order to set an appropriate lot size.
For example, if the contract size is 1,000 , the user should consider setting a lot size of 0.01 . The recommended time-fra
FREE

Improved version of the free HMA Trend indicator (for MetaTrader 4) with statistical analysis. HMA Trend is a trend indicator based on the Hull Moving Average (HMA) with two periods. HMA with a slow period identifies the trend, while HMA with a fast period determines the short-term movements and signals in the trend direction.
The main differences from the free version: Ability to predict the probability of a trend reversal using analysis of history data. Plotting statistical charts for analyzi

Price to EMA Mean Histogram Version 1.10 for MetaTrader 4 Overview Price to EMA Mean Histogram is a separate-window oscillator that expresses the distance between price and a configurable moving-average mean as a percentage. It combines a close-price histogram, candle-extreme shadows, dynamic reference levels, and an optional fast EMA line in one compact view. The default configuration uses EMA 50 as the mean and EMA 14 as the fast reference. Visual Elements Bright bullish histogram: candle clos
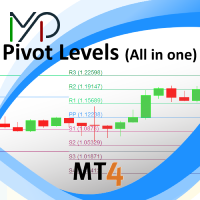
This indicator contains Pivot Levels of: Traditional Fibonacci Woodie Classic Demark Camarilla Calculation periods can be set to auto / Daily / Weekly / Monthly / Yearly. Number of Levels are editable. Options to hide level labels and price labels. Pivots Points are price levels chartists can use to determine intraday support and resistance levels. Pivot Points use the previous days Open, High, and Low to calculate a Pivot Point for the current day. Using this Pivot Point as the base, three resi
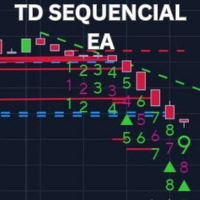
Overview The TD Sequential EA is a sophisticated automated trading system designed to capitalize on the TD Sequential indicator, developed by Tom DeMark. This EA identifies trading opportunities based on TD Sequential setups and executes trades with predefined risk management parameters. It offers a clean and customizable chart appearance and allows users to set their own lot sizes and other trading parameters. Key Features Automated Trading : Executes buy and sell orders based on TD Sequential

G2 Signal Manual Entry MT4 by Ida Bagus Putu Mahardika Master the Market with Precision Signals and Smart Risk Management G2 Signal Manual Entry is a cutting-edge trading solution designed to provide a competitive edge for Forex traders. Combining the power of Moving Average crossover signals with extensive automated risk management, this tool acts as a reliable trading assistant that helps you make timely decisions and optimize every profit opportunity. What Makes This Strategy Superior? Accu
FREE

무료 — 백테스트가 결코 보여주지 않았던 방식으로 스프레드를 확인하세요: 봉마다, 자기 자신의 평균과 비교해서, 그리고 직접 설정한 상한선과 비교해서.
완전 무료이며 제한이 없습니다. 차트에서 유용하다고 느끼셨다면 짧은 리뷰가 저희에게 가장 큰 도움이 됩니다. 30초면 충분하며, 다른 트레이더가 이 도구를 발견하는 유일한 경로입니다.
플랫폼: MetaTrader 4 (이 페이지). MetaTrader 5 버전: https://www.mql5.com/en/market/product/185748
대부분의 사람들은 인디케이터로 진입을 필터링합니다. 제 자신의 테스트에서는, 추세 시스템에 추가한 거의 모든 "똑똑한" 필터가 결과를 더 나쁘게 만들었습니다 — 손실 거래를 제거해 주기는 했지만, 큰 수익으로 이어졌을 돌파까지 함께 제거해 버려서 순이익이 떨어졌습니다. 꾸준히 값어치를 한 유일한 필터는 스프레드 상한선이었습니다. 그것은 애초에 시장 필터가 아닙니다: 처음부터 수익이 날 수
FREE
트레이딩 세션 3: 글로벌 시장 활동 시각화 트레이딩 세션 3 는 주요 일중 거래 세션인 아시아, 런던, 뉴욕 을 명확하게 표시하도록 설계된 직관적인 MQL5 지표입니다. 글로벌 시장 활동을 명확하게 이해하고 전략적인 거래 결정을 위해 변동성 증가 기간을 정확히 파악하십시오. 주요 기능: 글로벌 세션 시각화: 차트에서 아시아, 런던, 뉴욕 세션의 활성 거래 시간을 쉽게 식별할 수 있습니다. 변동성 통찰력: 각 세션 동안 어떤 통화가 일반적으로 가장 중요한 가격 변동을 경험하는지 이해하십시오. 아시아 세션: AUD, NZD 및 JPY 통화 쌍에서 종종 더 높은 변동성을 보입니다. 런던 세션: GBP 및 EUR 통화 쌍의 변동성 증가가 특징입니다. 뉴욕 세션: USD 는 일반적으로 이 세션 동안 가장 변동성이 큰 통화입니다. 사용자 정의 가능한 거래 시간: 유연한 HH:MM 입력 필드를 사용하여 세션 시간을 특정 요구 사항에 맞게 조정하십시오. 선택 가능한 표시 요일: 집중적인 분석을
FREE

개요 True Strength Index(TSI) 지표는 MT4의 별도 창에 표시되는 모멘텀 오실레이터입니다. 모멘텀(MTM)과 그 절대값을 두 번의 지수 이동평균(EMA)으로 부드럽게 처리한 뒤, 그 비율에 100을 곱해 산출합니다. TSI는 시장 추세의 강도와 전환점을 시각적으로 파악하는 데 유용합니다. 주요 기능 이중 EMA 부드러움 처리로 노이즈 감소 및 깨끗한 선 형태 제공 신호 EMA 오버레이로 진입·청산 타이밍 보조 –100에서 +100 범위 자동 스케일링 0 및 ±50 레벨 라인 표시로 가독성 향상 Fast EMA, Slow EMA, Signal EMA 기간을 자유롭게 설정 가능 설치 방법 MT4에서 “파일” → “데이터 폴더 열기”를 선택합니다. TSI.mq4 파일을 MQL4\Indicators 폴더에 복사합니다. MT4를 재시작하거나 “네비게이터” 창에서 우클릭 후 “새로 고침”을 선택합니다. 차트 상단 “삽입” → “사용자 지정” → “TSI”를 차례로 클릭한 후
FREE

BBMA MT4 by RWBTradeLab
BBMA read as one running sequence, not as a pile of separate signals. This indicator plots the three line families the system is built on — Bollinger Bands, Linear Weighted Moving Averages on the High and on the Low, and an EMA on the Close — and then labels the sequence those lines produce, candle by candle, on any symbol and any timeframe.
The Lines
- Bollinger Bands: Upper, Basis and Lower, from SMA 20 with deviation 2 - LW MA Low (5 to 10): the lower band, drawn i
FREE

Green Red Triple Overlap Candle by RWBTradeLab
Three candles of the same colour that go nowhere. A clean, non-repainting detector for MetaTrader 4 that finds the groups where one side keeps pushing and the other side keeps absorbing — and marks the exact band the group folded over. All from CLOSED candles only.
What This Indicator Does
The middle candle is the reference. Candle 1 and Candle 3 clamp its BODY from opposite ends, which is what stops the three of them from stepping away from eac
FREE
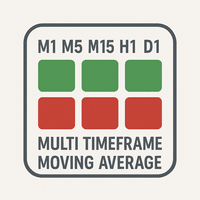
The "MTF Moving Average Panel" indicator is more of a helping tool than an indicator, it serves to help know the trend direction for the current currency pair of all timeframes in one place. It is best used with other indicators and signals, to help filter the signals according the trend based on multiple timeframes.
Indicator inputs : - Moving Average period : Default is set to 34. - Moving Average method : The method of calculation of the Moving Average. Default is set to Exponential. - Movin
FREE

The presented indicator, based on the volatility readings of a financial instrument plots dynamic S/R levels on the price chart. The indicator determines the trend and points to possible entry points formed by local highs/lows. The indicator allows you to notify the user of its signals by sending messages to the terminal and e-mail. The indicator does not repaint or recalculate. Signals when working with the indicator: The appearance of a red arrow above the price chart is a possible start of a
FREE

CS Pro An oscillator that measures market cycles through sine waves. The market doesn't always move randomly—it breathes in cycles. The CS Pro (CSO) identifies these cycles by mathematically decomposing price into sinusoidal components to extract the current market phase. How it Works The principle is straightforward: the trend is removed from the price, and the remaining cyclical component is converted into a phase angle via trigonometric projection. The resulting sine wave is highly correlated
FREE

Bar Countdown is an MT4 indicator that shows the size of the current candle and exactly how much time is left before it closes. It is a practical tool that many traders rely on in high-frequency trading and short-term scalping, where a few seconds or a couple of points can decide whether a trade wins or loses. By putting the three pieces of information you check most often — time, range, and spread — directly on the chart, it helps you make faster, calmer decisions. Core functions Time — Count
FREE
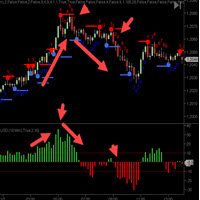
The C ycleTraderPro Close Strength Value Indicator measures the distance from the OPEN of a new bar to the CLOSE of that bar. Input - length = 10 default We add these values together going back the the length setting. If the 1st bar was plus 10 ticks and then the next bar was minus 7 ticks, then this would register +3
There are 2 ways to trade Close Strength Value: 1. Trading in the direction of lower highs and lower lows and vice versa for buys, higher highs, and higher lows. 2. Trade when the
FREE

The trend pigs is a trend EA with a filtering system. It is recommended to configure the EA based on your experience.
To configure the EA, you can use the following indicators:
MA Cross indicator with parameters(periods) settings. Main signal A TREND indicator with parameters(periods) settings. There is a possibility of switching off. The Squeeze indicator with the settings(periods). There is a possibility of switching off.
The expert advisors have the ability to filter signals according to t
FREE

Welcome to Gold Bloom World!
This forex robot, "Gold Bloom," is made for gold lovers around the world. The entry logic is sophisticated for the XAUUSD forex pair. The robot monitors the previous day's candle pattern and places a pending order in one direction. Take profit is determined by a trailing stop, while the stop loss is placed automatically based on the previous candle's price.
Simple input
Just enter initial lot size and set trailing stop.(points) For XAUUSD , please input points val
FREE
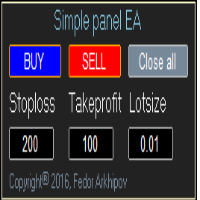
This is a simple panel EA for one-click trading. Unlike the standard panel, it features the Close all button for closing all orders on the current symbol, as well as the ability to enter the stop loss and take profit values before opening an order. The EA distinguishes its orders from others, therefore, the magic number must be specified in the panel settings. The panel is able to take screenshots when opening and closing deals to allow further analysis of the signals for opening/closing orders.
FREE

# %R Trend Exhaustion — Dual Williams %R Reversal Oscillator **Catch the exact bar an overbought or oversold trend runs out of steam — a fast and a slow Williams %R, cross-checked, with the reversal marked for you.**
Most %R (Williams Percent Range) setups suffer from one problem: a short-period %R flags "overbought" constantly in a strong trend, so traders either ignore it or get stopped out fighting the trend too early. %R Trend Exhaustion fixes this by running **two** %R readings at once —
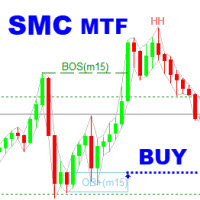
SMC Analyzer Multi-Timeframe is a powerful tool designed to help traders apply Smart Money Concepts (SMC) across multiple timeframes. This indicator identifies key structural points such as market structure shifts (Break of Structure and Change of Character), order blocks, fair value gaps (FVG), and liquidity zones from higher timeframes and overlays them onto the current chart. By aligning these critical SMC signals across multiple timeframes, traders gain a more comprehensive view of instituti

The indicator of the indicators. The Most Powerful Technique to Determine Forex Trend Strength in 2023. We have perfected Supreme Commander that it calculates an average of the selected indicators (up to 16) and the selected timeframe (all) with the result of a single trend that indicates the potential of buying and selling. It includes the following indicators:
Accelerator/Decelerator oscillator Average Directional Movement Index Awesome oscillator; Bulls and Bears Commodity Channel Index; De

MTF High Low indicator displays key price levels across multiple timeframes directly on your chart, so you always know where the market has been and what levels matter most.
The NY Session High/Low Levels automatically plot the highest and lowest prices of the New York trading session on your chart. It provides clear horizontal lines for the Today (TDY) , Yesterday (YTD) , Week (7D) , and Month (30D) sessions, with customizable display options. Inspired by MTF.HighLow
FREE
트레이딩 전략과 기술 지표를 판매하기에 가장 좋은 장소가 왜 MetaTrader 마켓인지 알고 계십니까? 광고나 소프트웨어 보호가 필요 없고, 지불 문제도 없습니다. 모든 것이 MetaTrader 마켓에서 제공됩니다.
