Watch the Market tutorial videos on YouTube
How to buy а trading robot or an indicator
Run your EA on
virtual hosting
virtual hosting
Test аn indicator/trading robot before buying
Want to earn in the Market?
How to present a product for a sell-through
Technical Indicators for MetaTrader 4 - 50

The most important thing in my system of forces, is the variation and changing of these forces. It is the key to the whole system, and from this point, my second indicator called FORCES-VARIATION appeares important. The indicator is represented in a separate window in the form of the green histogram and the red curve . The parameter NPIuPeriod represents the number of bars on which we calculate the variation of buyers forces. The parameter NPIdPeriod represents the number of bars on which we cal
This panel will be very useful for a research of a trading strategy system. The MA-ControlPanel is based on the very popular Moving Averages indicator. You will be able to change the indicator parameters: Period , Shift , Method and Apply Price by clicking on the Up ( /\ ) and Down ( \/ ) buttons. You may choose your favorite colors using parameters BackGround, maColor1 and maColor2. Sometimes, when you will open a rarely used currency pair or timeframe the indicator will not show its value. In
This is a Control Panel for major indicators: ATR, CCI, RSI, RVI, Stochastic and MACD. You have the ability to change any input parameters for each indicator. For example: ATR atrPeriod = 13; atrColor = Yellow; CCI cciPeriod = 13; cciPrice = PRICE_CLOSE; cciColor = Aqua; This indicator will be helpful for those who like to use many indicators before any decision making.
This is a Control Panel for major chart indicators: Moving Averages, Bollinger Bands, Envelopes, PSAR and Fractals. You have the ability to change any input parameters for each indicator. For example:
MA maPeriod = 13; ma_method = MODE_SMA; app_price = PRICE_CLOSE; maColor = Yellow; Bands bbPeriod = 20; bb_dev = 2; bb_Price = PRICE_CLOSE; bbColor = Aqua; This indicator will be helpful for those who like to use many indicators before any decision making.

The [GRAFF] III manual trading system is based on multiple MetaTrader (MT4) indicators. Together, the entire PACK of GRAFF III indicators makes an advanced trading tool. The system consists of over 20 different custom-built indicators which have been carefully selected and tested in the long term to produce strong and efficient trading signals. The particular indicators are based on different mathematical formulas, so the entire system is calibrated to remove false signals from its own indicator
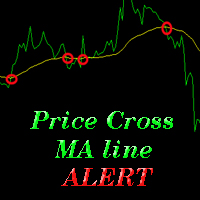
The indicator alerts you when the market price crosses MA line. You can choose any MA line to use via the parameter input tab (see the screenshot below). Parameters (the same as the four parameters you have to choose when you add MA line on a chart): ma_period ma_shift ma_method (0=Simple; 1=Exponential...) ma_apply (0=Close; 1=Open; 2=High; 3=Low...) When the price crosses MA line, it will alert you with a message looking as follows: "Price crossing DOWN MA line, pair: EURUSD Period: 60" or "
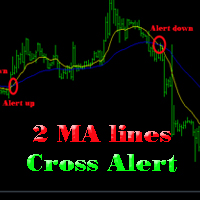
The indicator help you to do alert when two MA lines cross action You can choose all parameters for two these MA lines to use via parameter input tab (see screenshot below).
Parameters Same as 4 parameters you have to choose when you add MA line on chart. Fast MA: ma1_period ma1_shift ma1_method (0=Simple; 1=Exponential...) ma1_apply (0=Close; 1=Open; 2=High; 3=Low...) Slow MA: ma2_period ma2_shift ma2_method (0=Simple; 1=Exponential...) ma2_apply (0=Close; 1=Open; 2=High; 3=Low...) When f
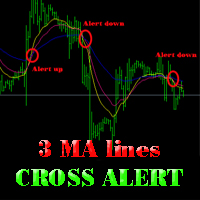
The indicator alerts you when 3 MA lines cross UP/DOWN (see the screenshot below). You can choose all parameters for these 3 MA lines to use via parameter input tab.
Parameters Same as 4 parameters you have to choose when you add MA line on the chart. Fast MA: ma1_period ma1_shift ma1_method (0=Simple; 1=Exponential...) ma1_apply (0=Close; 1=Open; 2=High; 3=Low...) Medium MA: ma2_period ma2_shift ma2_method (0=Simple; 1=Exponential...) ma2_apply (0=Close; 1=Open; 2=High; 3=Low...) Slow MA:
This indicator will be very useful for a research of a trading strategy system. The RSI-ControlPanel is based on the very popular Relative Strength Index indicator. You will be able to change the indicator parameters Period , Apply Price, HighLevel and LowLevel by clicking on the Up ( /\ ) and Down ( \/ ) buttons. Sometimes, when you will open a rarely used currency pair or timeframe the indicator will not show its value. In this case you should use button " 0 ".

"Make it Horizontal" will convert any trendline to horizontal by just selecting it and then pressing the H key. This tool must be included in your charts as an indicator. It has no inputs, just drag it to your charts and that's it! I created this tool because the MT4 doesn't have any built-in feature like this. How many times have you drawn a line and you need to double click it in order to configure the start and end price level so you can make it horizontal? Well, that's not an issue anymore!

This indicator will be very useful for a research of a trading strategy system. The MACD Control Panel is based on the very popular Relative Strength Index indicator. You will be able to change the indicator parameters FastPeriod , SlowPeriod , SignalPeriod and Apply Price by clicking on the Up ( /\ ) and Down ( \/ ) buttons. Sometimes, when you will open a rarely used currency pair or timeframe the indicator will not show its value. In this case you should use button " 0 ".
Waddah Attar Binary Support and Resistance Indicator. This indicator draws on chart very powerful Support and Resistance levels. It calculate these levels based on price binary values. Stronger levels are drawn in Blue Color and Red Color in more width. You can change the color and width for these levels from the indicator properties window. This indicator works only on five-digit symbols.
XP Moving Average – Your All-in-One Trading Powerhouse Master the markets with XP Moving Average , the ultimate moving average indicator for MetaTrader 4. Whether you’re scalping , swing trading , or investing long-term , this versatile tool combines 9 advanced moving averages in one—enhanced with a modern graphical dashboard and real-time alerts . With AI-powered insights coming soon , XP Moving Average is your key to smarter, more profitable trades . Why Choose XP Moving Average? 9-in-1

Knowledge of the strength and weakness of each currency is vital for every forex trader. Our Currency Strength Meter indicator measures the strength of eight major currencies (USD, EUR, GBP, CHF, JPY, CAD, AUD, NZD) by using the Relative Strength Index indicator, also known as RSI. The Currency Strength Meter indicator shows you, simply and quickly, when a currency is oversold, overbought, or in "normal area". This way, you can identify which currency is the strongest and the weakest.
Our

This indicator is based on the classical indicator RSI (Relative Strangth Index) and will be helpful for those who love and know how to use not a visual but digital representation of the indicator. All TimeFrames RSI MT4 indicator shows values from each timeframe. You will be able to change the main input parameters for each RSI for every TF. Example for M1: sTF1_____ = "M1"; Period1 = 14; Price1 = PRICE_CLOSE.
This indicator shows the lateral movement of the price when the indicator line corresponds to zero and Up/Down trend when indicator line is higher / lower than and parallel to zero-line. Of course, the moment when the indicator line is crossing the zero-line is the best moment to enter the market. This indicator has no input parameters... So, the results will be always the same for every time frame and currency pairs.

The ATR indicator is a helpful tool for measuring the range of bars. It quickly and easily helps evaluate the ATR's current spread (range), which is especially useful for VSA traders. The indicator for classifying the range of bars (candles) uses the moving average and its multiples. Accordingly, the area where the volume is located (relative to the moving average) is labeled as ultra-low, low, average, high, very high, or ultra-high. Our ATR indicator is rendered as a histogram. This indicator

The Volume indicator is an excellent tool for measuring tick volume or real volume activity. It quickly and easily helps traders evaluate the volume's current size. The indicator for classification of the volume size uses the moving average and its multiples. Accordingly, the area where the volume is located (relative to the moving average) is labeled as ultra-low, low, average, high, very high, or ultra-high. This indicator can calculate the moving average by four methods: SMA - Simple Mov
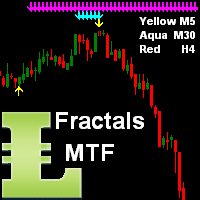
This indicator shows arrows as Support and Resistance from current time frame (Yellow arrows) and 2 higher TF by your choice (TF2 = Aqua arrows, TF3 = Magenta arrows and TF4 = Blue arrows). When all 3 color arrows are appearing in the same place then this is a good time to enter a new position.
Inputs NumOfBars - number of Bars where the indicator will show all arrows; DistanceArrow - you can increase the distance (vertically) between arrows especially on higher TF.
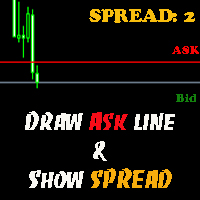
The indicator helps you to draw Ask line on the current chart and show the current spread. So, it helps you to do scalping trade easier. See the video below. It shows you how it works. Parameters line_color – Ask line color
text_size – text size of spread value text_color – color of spread value Thank you! If you have any question, please contact me via Skype: cuongph149, or email: hungcuongkhmt51@gmail.com

Any chart has patterns of consolidation which are also called accumulation patterns. These are sections where the market has been on the same price level during significant amount of time, and thus it was accumulating positions. After such accumulation, positions are distributing, and the market passes from flat into trend. The Consolidation Levels indicator is a professional tool which identifies these sections and builds levels according to the price of the market at the moment of consolidatio
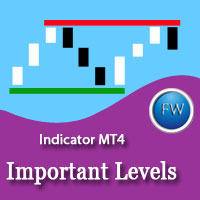
The main rule of the profitable trading is opening trades in the direction of a trend. You can define the current trend using fractal analysis. Important Levels ResSup displays important price levels on the chart. The breakthrough of those levels shows the price direction. The data panel allows you to track the current trends on all timeframes. The current timeframe's important level values are shown in the comments. The indicator can be useful for traders working by levels. It can also be a par

This is an MTF indicator of support and resistance levels based on Advanced ZigZag Dynamic and/or Extended Fractals indicator extremums with price labels (can be disabled). More higher TFs can be selected for MTF mode. By default, the levels are generated based on ZigZag indicator dots. Fractals indicator dots can also be used together with ZigZag or instead of it. In order to simplify the use and save CPU time, calculation is performed once per each bar at its opening. Parameters: ForcedTF - ch

The indicator calculates the levels by ATR daily range using the equations: 1AR = Open + ATR -1AS = Open - ATR AR 1/2 = Open + (ATR / 2) AS -1/2 = Open - (ATR / 2) AR 1/4 = Open + (ATR / 4) AS -1/4 = Open - (ATR / 4) AR 3/4 = Open + ((ATR*3) / 4) AS -3/4 = Open - ((ATR*3) / 4) AR 2 = Open + (ATR*2) AS -2 = Open - (ATR*2) Parameters Period ATR - ATR period
Shift time - shift by time for Open Color opening of day - Open line color
Color 1AR, -1AS - 1AR, -1AS line color
Color AR 1/2, AS -1/2 - AR 1

The indicator makes levels according to local maximums and minimums of a week, a month, or a year. Parameters: Week number - number of weeks for lines display Week level color - Week line color Month number - number of months for lines display Month level color - Month line color Year number - number of years for lines display Year level color - Year line color Width line - Width of lines Style line - Style of lines
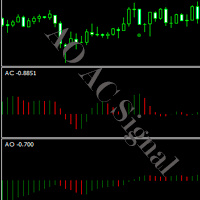
The indicator displays signals of different indicators (which can be selected in parameters) on a chart when zero level is crossed. AO, AC or AO+AC if signals of two indicators coincide. The indicator shows an Alert message (pop-up window) when a signal appears. Parameters: Indicators - Selection of the indicator AO, AC, AO+AC. Bars - Number of bars in history for display of signals. Alert - Pop-up window in case of a signal.
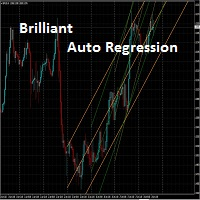
The indicator automatically draws up to five different regression channels. The product draws the channels for the previous major periods. For example : Indicator Chart Drawing Period
M1
D1
M5 D1
M15 D1 M30 D1 H1 D1 H4 W1 It updates itself at the beginning of the major period (ex.: D1 or W1). The periods are in the major period domain. For example : if the indicator is put on H1 chart, the period of 1 means 1 day on the chart.
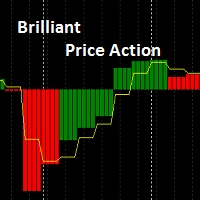
Brilliant Price Action Brilliant Price Action Indicator is a leading Indicator that does not repaint . It can be calculated on a time frame and represented on another time frame. It can be used in trend identification from higher time frames OR for Entry on lower time frames. Moving average modes are: 0 = Simple moving Average. 1 = Exponential moving Average. 2 = Smoothed moving Average. 3 = Linear Weighted moving Average.

N Money Management With this adviser, you won't loose your daily drawdown. Show the account actual leverage. Show the whole entry history on the chart. Calculate the moneymanagement (Risk Management to minimize the drawdown). Settings ShowEntryHistory: show all history entry line. ShowOpenArrow: show order open price. ShowAccountInfo: show the display text. calcLotPerEquity (e.g: 50) with equity of 100$ >> 100/50 = 2 >> 2x0.01 Lot = 0.02 Lot advised. priceOnePipInOneLot: input your broker price

The indicator displays trend reversal in the form of arrows. The indicator does not change its values (is not redrawn) after a signal. The program notifies about arrows by means of a pop-up window, or sending notification to e-mail. This is a multitimeframe instrument. Values of the indicator may be displayed from higher timeframes.
Parameters Time-frame - select time session; zero is the current timeframe (Time-frame cannot be lower than the current time interval). Bars - number of bars on the
X-Lines 2.0 Pro I want to present for your attention a new and completely updated and expanded version of X-Lines indicator. Version 2.0 Pro has many new features and can make your analysis more productive.
Please read full instructions here .
Please before purchasing try free version.
Free and limited version (you can set only one alert): here
1) Multi-timeframe settings and user-friendly control panel. You can dynamically select and save indicator settings not only for each currency pairs
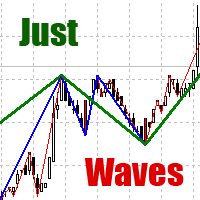
Among various methods of technical analysis of the Forex market, wave analysis used to be the basic one. Anyway, when it comes to the price change over a period of time, we are dealing with waves. According to Elliott's theory, waves are formed in a fractal way. On the same principle MT4 indicator "Just Waves" marks up waves of different levels (up to 8) and creates graphic lines that indicate the beginning and ending points of the waves. "Just Waves" offers an objective criterion of a wave, the
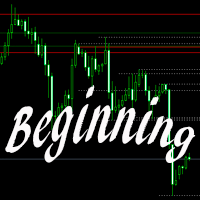
The indicator builds levels from beginning of a week or a month, or according to local Highs and Lows. These levels are meant for detection of strong support and resistance levels on a chart. Most big players of the market are guided by particularly these data: opening of the week or opening of the month. Breakout of one or several Highs and price consolidation on these levels suggest that market intends to grow. Breakout of Lows and price consolidation bears evidence of market's intention to mo

VR MultiPrice Analysis is an indicator that determines the strength of a currency in a currency pair. Let's take the EUR / USD pair as an example. How can we determine which currency is currently weak and which is strong? The easiest and most reliable way is to compare the EUR against other currencies, excluding the USD. The variants of power distribution: The EUR is rising against other currencies - this is a sign that the currency has become more attractive to traders and investors, or good ne

The Currency Barometer indicator is a unique tool that measures the strength of two currencies represented in the pair and compares the difference between them. The result is shown as a histogram where you can simply identify which currency is the strongest. This indicator is designed to measure the strengths and weaknesses of eight major currencies (USD, EUR, GBP, CHF, CAD, JPY, AUD, and NZD) and works on 28 currency pairs. The indicator uses the CI method (Commodity Channel Index) to calc

The Volume Spread Analysis indicator is based on the original Volume Spread Analysis method. It was designed for quick and easy recognition of VSA patterns. Even though this indicator looks very simple, it is the most sophisticated tool we've ever made. It is a really powerful analytical tool that generates very reliable trading signals. Because it is very user-friendly and understandable, it is suitable for every type of trader, regardless of his experience.
What is VSA? VSA - Volume Spre

Did You Have A Profitable Trade But Suddenly Reversed? Exiting a trade is equally important as entering! Exit Scope helps maximize your current trade profit and avoid turning winning trades to losers.
Attention Exit Signals are NOT to be used in entering a trade! Exit means closing your trades to avoid correction/reversal which can wipe out existing profit or haunt break-even orders. Please watch presentation (Click Here)
Features Generates instant exit signals based on price action, volatili
When the price is moving Up/Down rapidly majority of brokers are increasing the Spread. This indicator will show the Spread for 9 currency pairs by your choice ( Yellow digits ) - you allow to change all input parameters, including changing the name of the currency pairs. This indicator also shows classical indicator RSI (Relative Strength Index) for defined currency pairs and will be helpful for those who love and know how to use not a visual but digital representation of the indicator.

The VWAP indicator is our version of the popular Volume-Weighted Average Price indicator. The VWAP is the ratio between the value traded (price multiplied by the number of volume traded) and the total volume traded over a specific time period. As a result, it measures the average price of the instrument much better than the simple moving average. Although there are many ways to use the VWAP, most investors use it to calculate the daily average.
The indicator works in five modes: Moving -

Overbought describes a period of time where there has been a significant and consistent upward move in price over a period of time without much pullback. Oversold describes a period of time where there has been a significant and consistent downward move in price over a period of time without much pullback. This indicator will show the Overbought conditions (Green Bars) and Oversold conditions (Red Bars). The value of Green/Red Bars represents a power of the price movement. Input parameters numBa

Japanese Candlesticks Monitor scans Japanese candlesticks. It shows a vertical line and a name of a probable candlestick pattern. The indicator is constantly updated, and new patterns are added. Your feedback is most welcome. I have just started working on the indicator, and your opinions are highly appreciated . The indicator does not work on history data . If the indicator has not been launched at a candle opening, that candle is not considered. This means that the indicator works in real time

This is an interactive and easy-to-set indicator which allows to form seven equally spaced channels which have your settings simultaneously. All seven channels are enabled by default. But you can easily enable one or another channel using control buttons located in the upper case of the indicator's control panel. You can change a period of the indicator calculation by clicking one of buttons indicating number of the channel in the lower case of the control panel. Two other buttons (one of them i

Pipfinite creates unique, high quality and affordable trading tools. Our tools may or may not work for you, so we strongly suggest to try the Demo Version for MT4 first. Please test the indicator prior to purchasing to determine if it works for you. We want your good reviews, so hurry up and test it for free...we hope you will find it useful.
Combo Energy Beam with Swing Control Strategy: Confirm swing pullback signals Watch Video: (Click Here) Energy Beam with Trend Laser Strategy: Confirm Tre

Description Shows whether market is trending or not, to what extent, which direction, and if the trend is increasing. The indicator is very useful for trend following strategies. The indicator can also alert when the market transitions from being flat to trending, which can serve as a great entry point. The alert is controllable directly from the chart, with an on-chart tick box to enable the alert. Also includes bonus indicators of current spread and ask/bid prices in large text, color coded as

This indicator is based on the classical indicators: RSI (Relative Strength Index) and PSAR (Parabolic Stop and Reverse) and will be helpful for those who love and know how to use not a visual but digital representation of the indicators. The indicator shows values from 9 currency pairs. You will be able to change the main input parameters for RSI: OverboughtLevel = 70; OversoldLevel = 30; Period = 14; Price = PRICE_CLOSE; and PSAR: step = 0.02; maximum = 0.2; Also you may change Symb1 - Symb9 t

Simply drop the indicator to the graph and support and resistance levels will be shown automatically! The indicator for automatic drawing of support and resistance levels based on THREE points. Identified points are marked on the chart Indicator shows break through price for both bullish and bearish trends (if found) You can specify on how many bars the indicator shall look in order to identify supporting points. In addition, you can select on which time frame the indicator will work. That means

The indicator for automatic drawing of Fibonacci-based Moving Averages on the chart. It supports up to eight lines at a time. The user can configure the period of each line. The indicator also provides options to configure color and style of every line. In addition, it is possible to show indicator only on specific time frames. Please contact the author for providing additional levels or if you have any other suggestions.
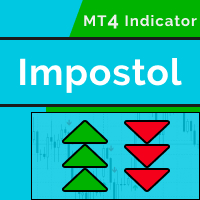
New indicator Impostol is based on the relative strength index (RSI) and trend indicator ADX. With it, you can identify a trend for your trade. Its signals are easy ti interpret, because it shows the recommended entries using up and down arrows. The indicator has a minimum of settings and is easy to use.
Impostol Expert for MetaTrader 4 — HERE
Main features Uses arrows to show market entry points. The indicator is not redrawing. Recommended timeframe is H1 and higher (lower timeframes can sh

The Breakout Indicator That Has Been Proven & Tested! Breakout Analyzer uses an advanced algorithm based on high probability price patterns. Each trade is analyzed on the statistics panel to help you evaluate the best breakout setups.
Bonus Strategy 1
Breakout Analyzer with Volume Critical Watch Video: (Click Here)
Bonus Strategy 2
Breakout Analyzer with Strength Meter
Watch Video: (Click Here)
Features Universal compatibility to different trading systems Analyzes statistics of breakout sign

BB St Dev BB St Dev is analogous to the Bollinger indicator. Upper and lower parts of the Bollinger channel are calculated by means of iStdDev . iStdDev is a standard indicator of МetaТrader 4. Moving average has a special smoothing algorithm. Settings M - period of Moving average BandsDeviations parameter - channel generation factor. Apart from classic Bollinger Bands, BandsDeviations can possess any value here. Visio parameter If Visio = False , this indicator will coincide with the Bollinger
The indicator for presenting current spread in real time. It is a very simple still useful indicator for manual trading and market analysis. The indicator shows current spread (in 4-digit format) for the selected instrument. You can specify the place on the chart where indicator shall print the output as well as output color. Please contact the author if any changes are required.

The B150 model is a fully revised version of the Historical Memory indicator with an improved search algorithm. It also features a graphical interface what makes working with this tool quick and convenient. Indicator-forecaster. Very useful as an assistant, acts as a key point to forecast the future price movement. The forecast is made using the method of searching the most similar part in the history (patter). The indicator is drawn as a line that shows the result of change of the close price o

Forex trend has always been a friend of traders, and trend indicators help determine the trend and make the right decisions. Most of the trading systems developed by trading gurus are based on the trend.
It is best used on timeframes above the M30, from the beginning of the London session to America.
It should be remembered that there are no indicators that are not wrong. Any strategy requires confirmation of its signals. When building your own system, it is recommended to use several indicat
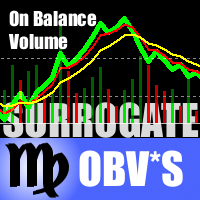
This is a special edition of the On-Balance Volume indicator based on pseudo-real volumes emulated from tick volumes. It calculates a near to real estimation of trade volumes distribution for Forex instruments (where only tick volumes are available) and then applies conventional OBV formula to them. Volumes are calculated by the same algorithm that's used in the indicator TrueVolumeSurrogate . The indicator itself is not required but can be used for reference.
Parameters MAfast - fast moving av
Advanced ADX indicator that allows operating on many timeframes simultaneously! Unique indicator with the ability to display ADX charts not only on the current timeframe, but also on higher ones. The example attached shows how it is possible to see 3 ADX chart on M5, M15 and M30 timeframes respectively. This functionality allows to significantly improve the accuracy of determining the trend. The Timeframe Delta parameter specifies how much the indicator’s timeframe should be different from the t

This indicator is designed for M1 time frame and shows 2 lines: Sum of Points when the price goes up divided on Sum of Ticks when the price goes up (Aqua color). Sum of Points when the price goes down divided on Sum of Ticks when the price goes down (Orange color). You will see all major data as a comment in the left upper corner of the chart. Keep in mind that Sum of Points will be greater or equal to Sum of Ticks. Of course, the ATT is calculating all ticks forward only, beginning from the tim
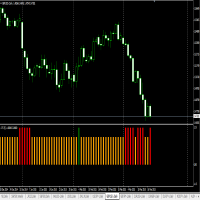
This is an indicator for finding the strongest trend each day, suitable for intraday trading or a swing trading. See the live performance at : https://www.mql5.com/en/signals/93383
How to Use: RED BAR means Bearish Trend for the next candle GREEN BAR means Bullish Trend for the next candle ORANGE BAR means Sideways Trend for the next candle
Example:
If we are using D1 timeframe, see the last BAR, if the bar is RED BAR, open short/sell for today. If we are using H1 timeframe, see the last BAR,
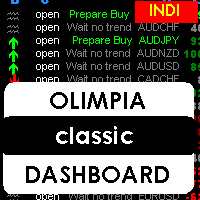
This indicator is a multipairs dashboard which recognizes the best pair setup to open orders with 8 families of currencies. Families of currencies include: AUD, USD, EUR, GBP, CAD, NZD, CHF, JPY; 28 pairs in total. The precise moment to open an order is shown at Column A on the dashboard, you can also setup alerts, e-mails and notification to mobile devices. You can filter alerts by spread value of pairs.
What is the dashboard showing? RED values mean short trends, GREEN values mean long trends

This is an indicator for additional signal filtering. It can be used as an additional filter in a trading system. The indicator does not redraw its data and can be used both in forex trading and with binary options. It has 3 operation modes and flexible sensitivity settings. The indicator uses multiple buffers, therefore it can be easily used in various Expert Advisors.

The indicator is designed for visual determining market directions. It allows to determine the distance from a price and helps in drawing correct conclusions. Perfectly defines flat zones, horizontal intraday trends and trend movements, and an additional setting allows to use the indicator on any instrument. Does not redraw its readings. You get professional trading indicator for a reasonable price.
Settings: Period_FF = 7 - indicator period Sensitivity_FF = 5 - sensitivity in % Wish you all su

Fibolopes (converted from Envelopes) Indicator is based on the Fibonacci sequence. The input parameter FiboNumPeriod is responsible for the number in the integer sequence (0, 1, 1, 2, 3, 5. 8 13, 34, 55, 89...) The indicator will calculate the Main Yellow dot line and 2 bands as a +/- Deviation to it. This indicator is calculating a ZigZag (Aqua line) which combine with Fibolopes together form a system signals for Open (Z crossing Fibolopes) a new position and Close (Z crossing Fibolopes in oppo

The purpose of the indicator is drawing an equidistant channel. It is somewhat different from the traditional model. The choice of control parameters is simple and does not require any special description. Enter the calculation interval in hours and the solution to the problem will appear on the screen. Please note that the time involved in calculation of the channel must be greater than the timeframe it will be displayed on. If the parameters you enter are beyond the allowable limits, you will

Marcus = market customization is 3 in 1 indicator. Universal business tool from professional traders that helps visualizing interesting market situations. Preview markets using price action and sentiment in the market. Three tools necessary to understand the market situation and the anticipation of further movement. Finally, you will see what parquet traders see. With these tools, you will see the important supports and resistances. It shows you the entry of big players on the market. The indica

The indicator colors bars displaying prices of overbought and oversold areas on the chart. It will help you to estimate moments when market climate changes and the price has its local extreme values. It can be used both independently and as a good supplement to any channel trading system. And this indicator is easy-to-use in expert advisors due to usage of indicator buffers instead of graphical objects. Settings ExtPeriod = 100 — indicator period; Sensitivity = 80 — indicator sensitivity.
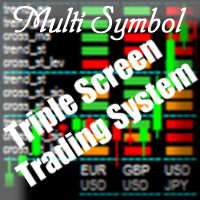
Purpose The indicator is intended for manual multi-currency trading based on the Triple Screen Strategy. It works with any symbols located in the Market Watch window of the MT4: currencies, metals, indexes, etc. The number of instruments can be limited by capacity of the МТ4's parameters. But if desired, you can create several windows with various set of instruments and parameters.
Operation Principle The indicator uses the modified Triple Screen Strategy for determining trend direction in the

Индикатор Форекс LTT Range System показывает на графике средние диапазоны движения рыночной цены за периоды M 15, H 1, H 4, D 1, W 1, MN 1. Верхняя и нижняя границы диапазонов рассчитываются от цены открытия бара. Пивот – середина между ценой открытия бара и границей диапазона: если рыночная цена находится выше цены открытия бара – метка пивота располагается между ценой открытия бара и верхней меткой диапазона, если рыночная цена находится ниже цены открытия бара – метка пивота располагается ме

This indicator shows an Up trend (Green square) if a fast MA is above a slow MA and Down trend (Red square) if a fast MA is below a slow MA from all Time Frames for each currency pair. Input parameters: From Symb1 to Symb9. - You may change any of this Symbol to any legal currency pair existed on your platform. Period_Fast = 5; Method_Fast = MODE_EMA; Price_Fast = PRICE_CLOSE; Period_Slow = 21; Method_Slow = MODE_SMA; Price_Slow = PRICE_TYPICAL; Attention: Before using this indicator you have t
Pipfinite creates unique, high quality and affordable trading tools. Our tools may or may not work for you, so we strongly suggest to try the Demo Version for MT4 first. Please test the indicator prior to purchasing to determine if it works for you. We want your good reviews, so hurry up and test it for free...we hope you will find it useful.
Combo Swing Control with Energy Beam Strategy: Confirm swing pullback signals Watch Video: (Click Here)
Features Detects overall bias and waits for overb
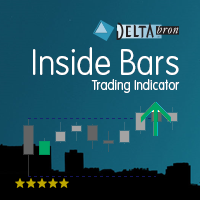
The Inside Bars indicator shows Inside Bars, the Breakout Zone and Breakouts thereof. Inside Bars are an important price action pattern. The price action of an Inside Bar is completely covered by the price action of the previous bar. Inside Bars are most often used on higher timeframes. Settings Inside Bars default settings are good enough most of the time. Feel free to fine tune them to your needs. ATR factor to skip large candles - very large candles should be filtered as they often cover othe
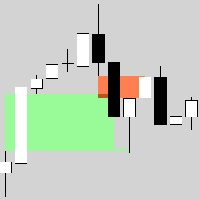
Hidden123Gap (123Gap) is universal business tool from the professional traders that helps to visualize market situation. It previews markets using a price action and a sentiment in the market. The tool is necessary to understand the market situation and the anticipation of further movement. Finally, you will see how traders estimate the market. With this tool, you will see important supports and resistances. It shows you the entry of big players on the market. The indicator works on all timefram
The MetaTrader Market is a unique store of trading robots and technical indicators.
Read the MQL5.community User Memo to learn more about the unique services that we offer to traders: copying trading signals, custom applications developed by freelancers, automatic payments via the Payment System and the MQL5 Cloud Network.
You are missing trading opportunities:
- Free trading apps
- Over 8,000 signals for copying
- Economic news for exploring financial markets
Registration
Log in
If you do not have an account, please register
Allow the use of cookies to log in to the MQL5.com website.
Please enable the necessary setting in your browser, otherwise you will not be able to log in.