VR ATR Pro
- Indicators
-
Vladimir Pastushak
 🤝 Hello my friend! I'm glad to welcome you to my page!
 - Version: 26.20
- Updated: 8 February 2026
- Activations: 20
VR ATR Pro is a technical indicator designed to determine target levels based on the statistical analysis of previous trading periods. It is based on the mathematical calculation of the average price movement over a selected period of time.
Operating Principle of the Indicator, Based on Statistics
The indicator's operation is based on observing the daily behavior of the price: each trading period is characterized by a certain movement amplitude — the price travels a certain distance in points both up and down from the opening point.
Similarly, it can be assumed that at the beginning of each new trading period, the price has its conditional "range"... a simple mathematical calculation determines the average value... This average value is not a guarantee but serves as a reference point, indicating the probable size of the movement in the current period.
Thus, the indicator applies this principle: it analyzes historical price fluctuations over a selected period of time, calculates the average statistical value, and displays levels on the chart. This allows the trader to understand the strength and "range" of the financial instrument for the current period.
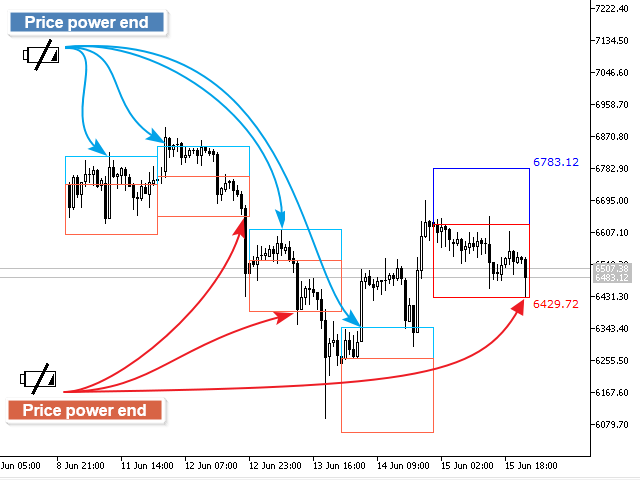
Indicator Display
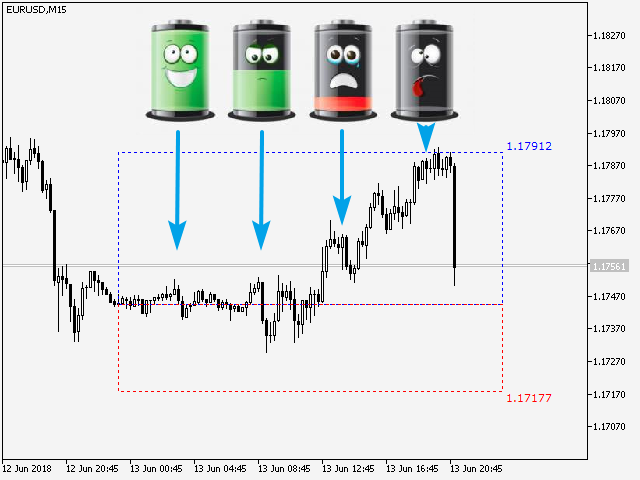
The indicator displays two levels on the chart:
- Upper Level — the calculated target for upward movement.
- Lower Level — the calculated target for downward movement.
Additionally, levels can be displayed as areas, allowing for deviation to be accounted for and obtaining a target price range.
Key Features
- Signals are fixed upon period completion and do not change afterward.
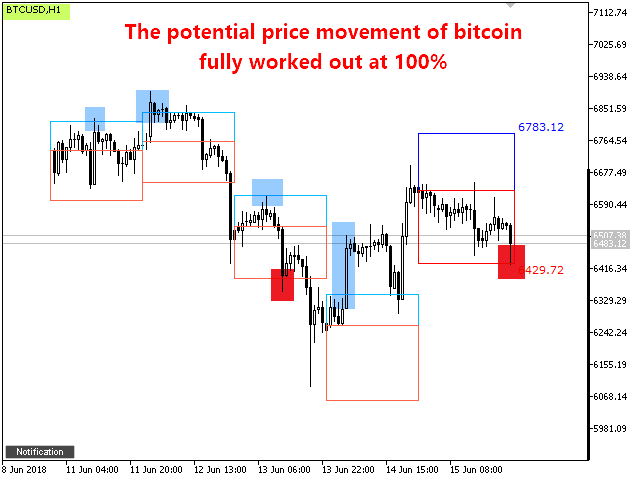
- Works with various asset classes: currency pairs (Forex), metals, indices (CFD), futures, and cryptocurrency.
- Can be applied on any timeframes.
- Allows configuration for displaying exact levels or zones.
- Supports sending notifications via push messages to smartphones, email, and standard terminal alerts.
- Functionally identical versions are available for MetaTrader 4 and MetaTrader 5.
Practical Application
The indicator can be used as an auxiliary tool for:
- Identifying potential zones for placing Take Profit and Stop Loss orders.
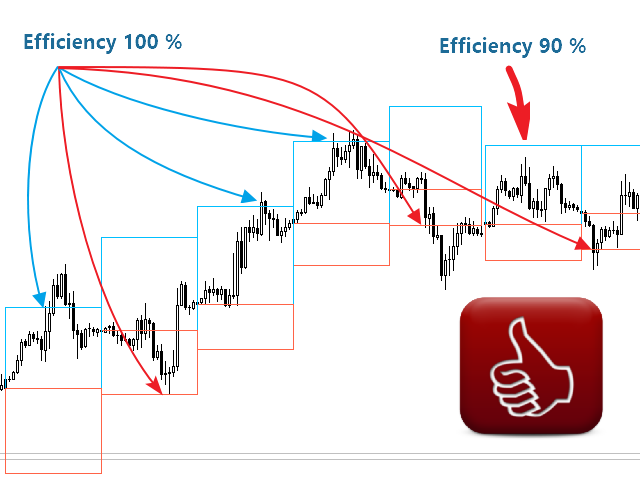
- Assessing the potential of price movement within an existing trading strategy.
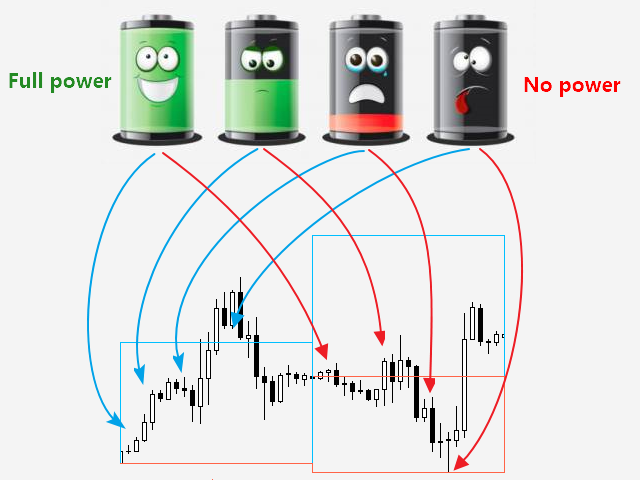
- Filtering market conditions: reaching the calculated level can serve as a signal of exhaustion of strength in the current movement.
Recommendations
- The Indicator Calculation Timeframe must be greater than the Timeframe on which the indicator operates.
- The best period for calculating the indicator is the PERIOD_D1 Period.
- Use the indicator in conjunction with your trading system.
- Place Take Profit inside the levels, and Stop Loss beyond the levels.
- Use a calculation period (Indicator calculation period) greater than 10 to obtain the most accurate results.
- If the price breaches one of the levels, you should cease trading until the next trading period.
VR ATR Pro is a high-quality tool for assessing the potential price movement range. Its logic is based on the analysis of historical volatility, allowing for an objective approach to determining target levels. Like any analytical tool, it requires an understanding of its operating principles.
Settings
[+] === Main Settings === [+]
- Indicator calculation period
- Number of periods to display
- Indicator calculation timeframe
- Show text labels
- Display type
- Percentage for area
- Show achieved targets
- Show potential number of points
[+] === Current Period Settings === [+]
- Current uptrend figure color
- Current uptrend figure line style
- Current uptrend figure line thickness
- Fill current uptrend figure
- Current downtrend figure color
- Current downtrend figure line style
- Current downtrend figure line thickness
- Fill current downtrend figure
[+] === Settings of periods in history === [+]
- Uptrend figure color
- Uptrend figure line style
- Uptrend figure line thickness
- Fill uptrend figure with color
- Downtrend figure color
- Downtrend figure line style
- Downtrend figure line thickness
- Fill downtrend figure with color
[+] === Other === [+] - Прочее;
- Text size
- Prefix
Version for: MetaTrader 5
Your feedback, the best thanks to us! Leave a review.
More information in blog.


Very useful indicator but as most indicators it is not meant to be used as a stand alone but as a confirmation . This indicator helps confirm of the market is breakout out or trending sideways. Still testing it but so far pleased with my purchase.