Harmonic Pattern Scenario Planner MT4
- Indicators
-
Young Ho Seo
 Harmonic Pattern Indicator - Repainting + Japanese Candlestick Pattern Scanner + Automatic Channel + Many more
https://www.mql5.com/en/market/product/4488 - Version: 11.3
- Updated: 1 February 2021
- Activations: 5
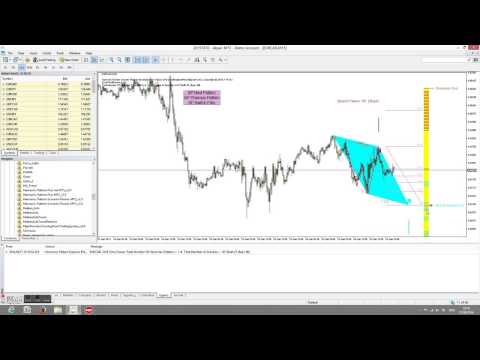
Introduction to Harmonic Pattern Scenario Planner
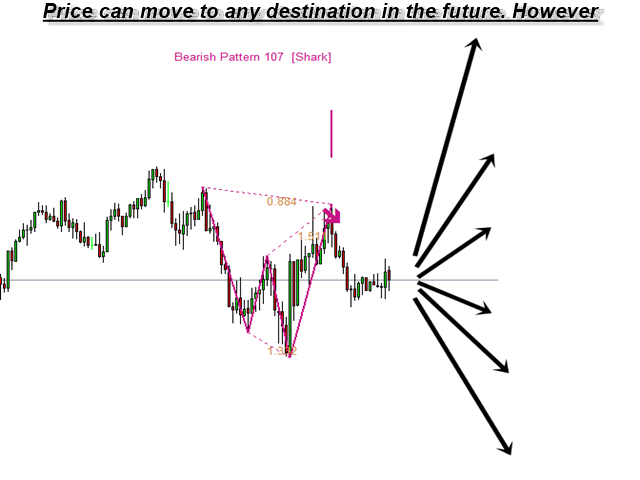
The present state of Forex market can go through many different possible price paths to reach its future destination. Future is dynamic. Therefore, planning your trade with possible future scenario is an important step for your success. To meet such a powerful concept, we introduce the Harmonic Pattern Scenario Planner, the first predictive Harmonic Pattern Tool in the world among its kind.
Main Features
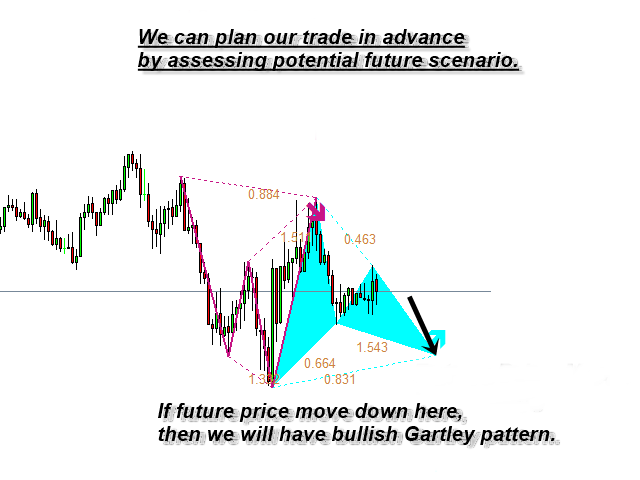
- Predicting future patterns for scenario analysis
- 11 Harmonic Pattern Detection
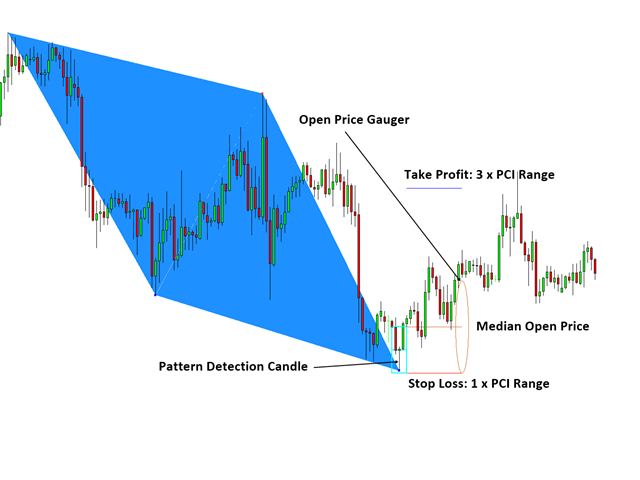
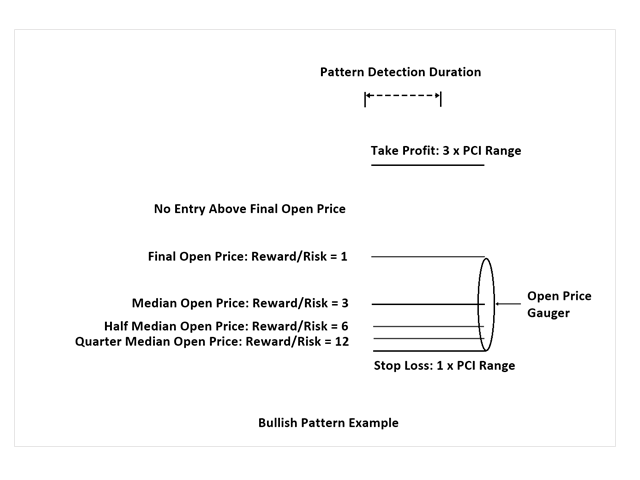
- Automatic stop loss and take profit recognition for excellent risk management
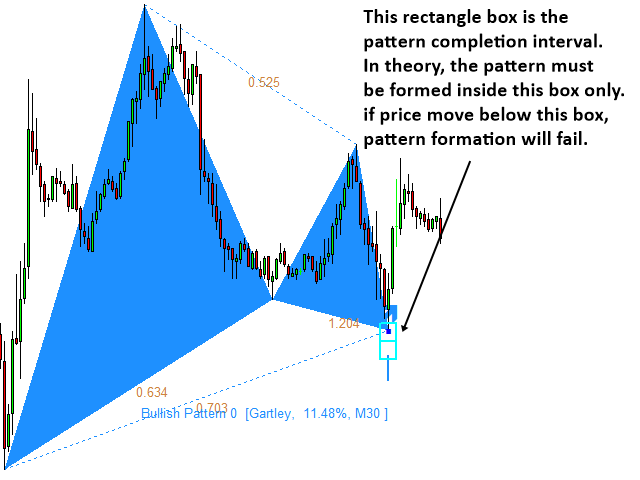
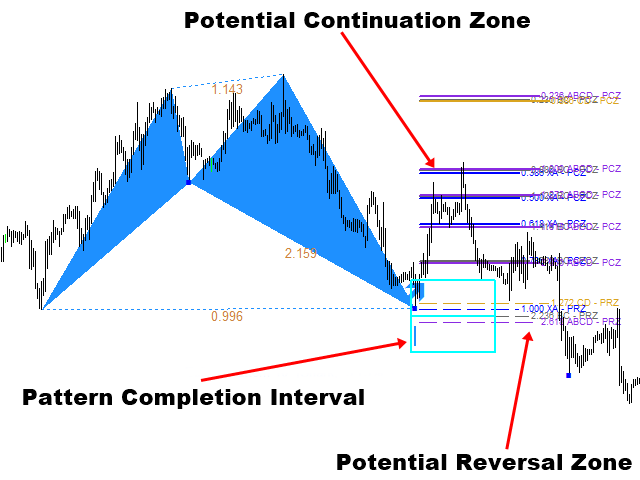
- Pattern Completion Interval (PCI) for precision trading
- Potential Continuation Zone (PCZ) detection for future price movement prediction
- Potential Reversal Zone (PRZ) detection for Point D detection
- Automatic Channel Detection to go with Harmonic Pattern (Optional)
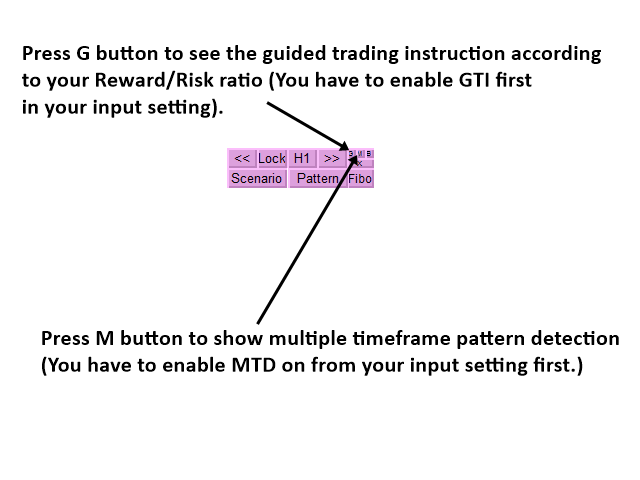
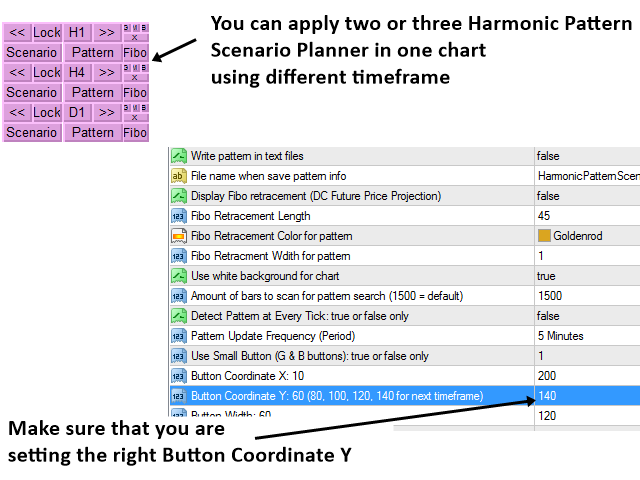
- Multiple timeframe Pattern Analysis
- Multiple timeframe Pattern Detection
- Guided Trading Instruction for professional traders
- Pattern Locking and Unlocking feature in your chart
- Even more, please find it out.
Simulation for Future Harmonic Pattern
There are powerful simulation techniques known to generate possible future price patterns like Monte Carlo Simulation, Brownian motion simulation, etc. To do so, we need to understand the price behaviour including distribution and its randomness. Then we repeat the simulation as many times as possible to identify various future price path. Some future price path may be very important for your trading whereas some other price path may be insignificant. Harmonic Pattern Scenario Planner collects those significant price paths only for your advance trading decision. You will get the advantage of early warning.
Indicator Inputs
These parameters below concerns operations of Harmonic patterns. You can change timeframe of pattern detection. However, you cannot use smaller timeframe pattern detection for higher timeframe. For example, you cannot set Timeframe to detect patterns = H1 timeframe while you are using D1 chart.
- Timeframe to detect Patterns
- Max number of patterns to display
- Pattern Index from which to display
- Enable sound alert
- Send email if pattern is found
- Send notification if pattern is found
- Display Fibo retracement (DC Future Price Projection)
- Fibo Retracement Length
- Fibo Retracement Color for pattern
- Fibo Retracment Width for pattern
- Use white background for chart
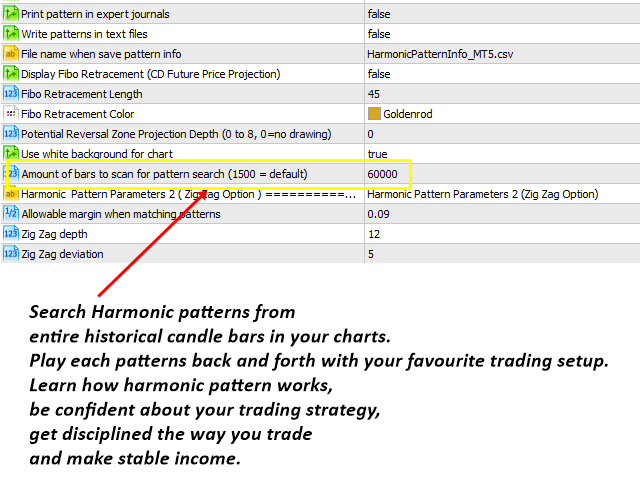
- Amount of bars to scan for pattern search (1500 = default)
- Detect Pattern at Every Tick: true or false only
- Pattern Update Frequency (Period)
Trading Strategy Guide
In fact, the detailed trading strategy with harmonic pattern can be found from the link below:
https://www.mql5.com/en/blogs/post/747647
For the most important trading strategy, you can have a look at the Young’s Mutual Pattern Turning Point Strategy in the following books: Guide to Precision Harmonic Pattern Trading and Science Of Support, Resistance, Fibonacci Analysis, Harmonic Pattern, Elliott Wave and X3 Chart Pattern.
Important Note
This is the off the shelf product. Therefore, we do not accept any modification or customization request on this product. In addition, we do not provide any code library or any support for your coding for this product.


Scenario mode is amazing, i recommand;