Finding custom currency pair patterns in Python using MetaTrader 5

Introduction to Forex pattern analysis
What do beginners see when they first look at currency pair charts? Lots of intraday fluctuations, volatility increases and decreases, trend changes and much more. Ups, downs, zigzags - how to figure it all out? I also began my acquaintance with Forex by immersing myself in the study of price pattern analysis.
Many things in our world seem chaotic at first glance. But any experienced specialist sees patterns and possibilities in his or her personal sphere that seems confusing to others. The same is true for currency pair charts. If we try to systematize this chaos, we can discover hidden patterns that can suggest future price movement.
But how to find them? How to distinguish a real pattern from random noise? Here is where the fun begins. I decided to create my own pattern analysis system using Python and MetaTrader 5. A kind of symbiosis of math and programming for conquering Forex.
The idea was to study a lot of historical data using an algorithm that would find repeating patterns and evaluate their performance. Sounds interesting? In reality, the implementation turned out to be not so simple.
Setting up the environment: installing necessary libraries and connecting to MetaTrader 5
So, our first task is to install Python. It can be downloaded from the official website python.org. Make sure to check the "Add Python to PATH" box.
The next important step is libraries. We will need a few of them. The main one is MetaTrader 5. Also, there is 'pandas' for working with data. And perhaps 'numpy'. Open the command line and type:
pip install MetaTrader5 pandas numpy matplotlib pytz
The first thing you need to do is install MetaTrader 5 itself. Download it from your broker's official website and install. Nothing complicated.
Now we need to find the path to the terminal. Typically, it is something like "C:\Program Files\MetaTrader 5\terminal64.exe".
Now open Python and type:
import MetaTrader5 as mt5

if not mt5.initialize(path="C:/Program Files/MetaTrader 5/terminal64.exe"):
    print("MetaTrader 5 initialization failed.")
    mt5.shutdown()
else:
    print("MetaTrader 5 initialized successfully.")
Launch it. If you see the successful terminal initialization message, all has been done correctly.
Want to make sure everything works? Let's try to get some data:
import MetaTrader5 as mt5
import pandas as pd
from datetime import datetime

if not mt5.initialize():
    print("Oops! Something went wrong.")
    mt5.shutdown()

eurusd_ticks = mt5.copy_ticks_from("EURUSD", datetime.now(), 10, mt5.COPY_TICKS_ALL)
ticks_frame = pd.DataFrame(eurusd_ticks)
print("Look at this beauty:")
print(ticks_frame)

mt5.shutdown()
If you see a data table, then congratulations! You have just taken your first step into the world of algorithmic Forex trading using Python. It is not as difficult as it seems.
Code structure: Basic functions and their purpose
So, let's start to analyze the code structure. This is a complete system for analyzing patterns in the foreign exchange market.
We will start with the main thing in the system - the find_patterns function. This function looks through historical data, identifying patterns of a given length. After finding the first patterns, we need to evaluate their efficiency. This function also remembers the last pattern for future use.
The next function is calculate_winrate_and_frequency. This function analyzes the patterns found - here is the frequency of occurrence, and the win rate, as well as sorting of patterns.
The process_currency_pair function also plays an important role. This is a fairly important handler. It loads the data, looks through it, searches for patterns of different lengths, and also gives the top 300 patterns for sales and purchases. As for the beginning of the code, here is the initialization, parameter settings, chart interval (TF) and time period (in my case, it is from 1990 to 2024).
Now let's move on to the main code execution loop. The features of the pattern search algorithm include different pattern lengths, since short ones are common but do not provide reliability, while long ones are too rare, although they are more effective. We should consider all dimensions.
Getting data from MetaTrader 5: copy_rates_range function
Our first function should receive data from the terminal. Let's look at the code:
import MetaTrader5 as mt5
import pandas as pd
import time
from datetime import datetime, timedelta
import pytz

# List of major currency pairs
major_pairs = ['EURUSD']

# Setting up data request parameters
timeframe = mt5.TIMEFRAME_H4
start_date = pd.Timestamp('1990-01-01')
end_date = pd.Timestamp('2024-05-31')

def process_currency_pair(symbol):
    max_retries = 5
    retries = 0
    while retries < max_retries:
        try:
            # Loading OHLC data
            rates = mt5.copy_rates_range(symbol, timeframe, start_date, end_date)
            if rates is None:
                raise ValueError("No data received")
            ohlc_data = pd.DataFrame(rates)
            ohlc_data['time'] = pd.to_datetime(ohlc_data['time'], unit='s')
            break
        except Exception as e:
            print(f"Error loading data for {symbol}: {e}")
            retries += 1
            time.sleep(2)  # Wait before retrying

    if retries == max_retries:
        print(f"Failed to load data for {symbol} after {max_retries} attempts")
        return

    # Further data processing...
What is going on in this code? First, we define our currency pairs. Right now we only have EURUSD, but you can add others. Then we set the time interval. H4 is 4 hours. This is the optimal timing.
Next are the dates. From 1990 to 2024. We will need a lot of historical quotes. The more data we have, the more accurate our analysis. Now to the main thing - the process_currency_pair function. It loads data using copy_rates_range.
What do we get as a result? DataFrame with historical data. Time, open, close, high, low - everything that is necessary for work.
If something goes wrong, errors are identified, displayed on the screen, and we try again.
Time series processing: Transforming OHLC data into price movement directions
Let's get back to our main task. We want to transform the chaotic fluctuations of the Forex market into something more orderly - trends and reversals. How do we do this? We will turn prices into directions.
Here is our code:
# Fill missing values with the mean
ohlc_data.fillna(ohlc_data.mean(), inplace=True)

# Convert price movements to directions
ohlc_data['direction'] = np.where(ohlc_data['close'].diff() > 0, 'up', 'down')
What is going on here? First, we fill in the gaps. Gaps can significantly worsen our final result. We fill them with average values.
And now the most interesting part. We create a new column named 'direction'. There we translate price data into data that simulates trend behavior. It works in an elementary way:
- If the current closing price is higher than the previous one, we write 'up'.
- If it is below, we write 'down'.
Quite a simple formulation, but quite effective. Now instead of complex numbers we have a simple sequence of 'ups' and 'downs'. This sequence is much easier for human perception. But why do we need it? These 'ups' and 'downs' are the building blocks for our patterns. It is from them that we will collect a complete picture of what is happening in the market.
Pattern search algorithm: find_patterns function
So we have a sequence of 'ups' and 'downs'. Next, we will look for repeating patterns in this sequence.
Here is the find_patterns function:
def find_patterns(data, pattern_length, direction):
    patterns = defaultdict(list)
    last_pattern = None
    last_winrate = None
    last_frequency = None

    for i in range(len(data) - pattern_length - 6):
        pattern = tuple(data['direction'][i:i+pattern_length])
        if data['direction'][i+pattern_length+6] == direction:
            patterns[pattern].append(True)
        else:
            patterns[pattern].append(False)

    # Check last prices for pattern match
    last_pattern_tuple = tuple(data['direction'][-pattern_length:])
    if last_pattern_tuple in patterns:
        last_winrate = np.mean(patterns[last_pattern_tuple]) * 100
        last_frequency = len(patterns[last_pattern_tuple])
        last_pattern = last_pattern_tuple

    return patterns, last_pattern, last_winrate, last_frequency
How does it all work?
- We create the 'patterns' dictionary. This will serve as a kind of library where we will store all the patterns we find.
- Then we start to iterate through the data. We take a data sample of pattern_length (this could be 3, 4, 5, etc. up to 25) and look at what happens 6 bars after it.
- If after 6 bars the price moves in the desired direction (up for buy patterns or down for sell patterns), we set True. If not - False.
- We do this for all possible data samples. We should get similar patterns: "up-up-down" - True, "down-up-up" - False and so on.
- Next, we check whether any of the patterns that we encountered earlier are currently being formed. If so, we calculate its win rate (percentage of successful hits) and frequency of occurrence.
That is how we turn a simple sequence of 'ups' and 'downs' into a pretty powerful forecasting tool. But that is not all. Next, we will sort these patterns, select the most efficient ones, and analyze them.
Calculating pattern statistics: WinRate and occurrence frequency
Now that we have a number of patterns, we need to select the best ones.
Let's take a look at our code:
def calculate_winrate_and_frequency(patterns):
    results = []
    for pattern, outcomes in patterns.items():
        winrate = np.mean(outcomes) * 100
        frequency = len(outcomes)
        results.append((pattern, winrate, frequency))
    results.sort(key=lambda x: x[1], reverse=True)
    return results
Here we take each pattern and its results (we referred to them earlier as True and False), and then calculate the win rate - this is our productivity percentage. If a pattern works 7 times out of 10, its win rate is 70%. We also count the frequency - this is the number of times the pattern occurred. The more often, the more reliable our statistics. We put all this into the 'results' list. And finally, sorting. We put the best patterns at the top of the list.
Sorting results: Selecting significant patterns
Now we have enough data. But we will not need all of them. We need to sort them out.
filtered_buy_results = [result for result in all_buy_results if result[2] > 20]
filtered_sell_results = [result for result in all_sell_results if result[2] > 20]

filtered_buy_results.sort(key=lambda x: x[1], reverse=True)
top_300_buy_patterns = filtered_buy_results[:300]

filtered_sell_results.sort(key=lambda x: x[1], reverse=True)
top_300_sell_patterns = filtered_sell_results[:300]
We set up sorting in a similar way. First, we sort out all patterns that occur less than 20 times. As statistics shows, rare patterns are less reliable.
We then sort the remaining patterns by win rate. The most efficient ones are set at the beginning of the list. As a result, we select the top 300. This is all that should remain from a multitude of patterns, the number of which exceeds a thousand.
Working with different pattern lengths: from 3 to 25
Now we need to select the pattern variations that will statistically and consistently produce profits when trading. The options differ in length. They can consist of either 3 or 25 price movements. Let's check all the possible ones:
pattern_lengths = range(3, 25)  # Pattern lengths from 3 to 25
all_buy_patterns = {}
all_sell_patterns = {}

for pattern_length in pattern_lengths:
    buy_patterns, last_buy_pattern, last_buy_winrate, last_buy_frequency = find_patterns(ohlc_data, pattern_length, 'up')
    sell_patterns, last_sell_pattern, last_sell_winrate, last_sell_frequency = find_patterns(ohlc_data, pattern_length, 'down')
    all_buy_patterns[pattern_length] = buy_patterns
    all_sell_patterns[pattern_length] = sell_patterns
We launch our pattern search filter for each length from 3 to 25. Why do we use this implementation? Patterns less than three moves are too unreliable - we mentioned this earlier. Patterns longer than 25 are too rare. For each length, we look for both buy and sell patterns.
But why do we need so many different lengths? Short patterns can capture quick market reversals, while long patterns can show long-term trends. We do not know in advance what will be more effective, so we test everything.
Buy and sell pattern analysis
Now that we have a selection of patterns of varying lengths, it is time to determine which ones actually work.
Here is our code in action:
all_buy_results = []
for pattern_length, patterns in all_buy_patterns.items():
    results = calculate_winrate_and_frequency(patterns)
    all_buy_results.extend(results)

all_sell_results = []
for pattern_length, patterns in all_sell_patterns.items():
    results = calculate_winrate_and_frequency(patterns)
    all_sell_results.extend(results)
We take every pattern - both buy and sell - and sort it through our win rate and frequency calculator.
But we do not just count statistics. We look for the difference between buy and sell patterns. Why is this important? Because the market can behave differently when rising and falling. Sometimes buy patterns work better, while sometimes sell patterns become more reliable.
Next, we will move on to the next step by comparing patterns of different lengths with each other. It may turn out that short patterns work better for determining the entry point into the market, and long ones work better for determining the long-term trend. The same can happen the other way around. That is why we analyze everything and do not discard anything ahead of time.
At the end of this analysis, we form the first results: which patterns work better for buying, which for selling, what length of patterns are most effective in different market conditions. With this data, we can already conduct an analysis of prices on the Forex market.
But remember that even the best pattern is not a guarantee of success. The market is full of surprises. Our task is to increase the chances of success, and that is what we do by analyzing patterns from all sides.
Looking ahead: Forecasting based on recent patterns
Now it is time for some predictions. Let's take a look at our predictor code:
if last_buy_pattern:
    print(f"\nLast buy pattern for {symbol}: {last_buy_pattern}, Winrate: {last_buy_winrate:.2f}%, Frequency: {last_buy_frequency}")
    print(f"Forecast: Price will likely go up.")
if last_sell_pattern:
    print(f"\nLast sell pattern for {symbol}: {last_sell_pattern}, Winrate: {last_sell_winrate:.2f}%, Frequency: {last_sell_frequency}")
    print(f"Forecast: Price will likely go down.")
We look at the last pattern that formed and try to predict the future and perform our trading analysis.
Please note that we are considering two scenarios: a buy pattern and a sell pattern. Why? Because the market is an eternal confrontation between bulls and bears, buyers and sellers. We should be prepared for any turn of events.
For each pattern, we output three key parameters: the pattern itself, its win rate, and its occurrence frequency. The win rate is especially important. If a buy pattern has a 70% win rate, it means that 70% of the time after this pattern appeared, the price actually rose. These are pretty good results. But remember, even 90% is not a guarantee. There is always room for surprises in the world of Forex.
Frequency also plays an important role. A pattern that occurs frequently is more reliable than a rare one.
The rather interesting part is our forecast. "Price will likely go up" or "Price will likely go down". These forecasts bring some satisfaction from the work done. But remember that even the most accurate forecast is only a probability, not a guarantee. The Forex market is quite difficult to predict. News, economic events, even tweets from influential people can change the direction of price movement in a matter of seconds.
Therefore, our code is not a panacea, but rather a very smart EA. It can be interpreted as: "Look, based on historical data, we have reason to believe that the price will go up (or down)". It is up to you to decide whether to enter the market or not. Applying these forecasts is a thoughtful process. You have information about possible movements, but each step still needs to be taken wisely, taking into account the overall situation on the market.
Drawing the future: Visualizing the best patterns and forecasts
Let's add some visualization magic to our code:
import matplotlib.pyplot as plt

def visualize_patterns(patterns, title, filename):
    patterns = patterns[:20]  # Take top 20 for clarity
    patterns.reverse()  # Reverse the list to display it correctly on the chart

    fig, ax = plt.subplots(figsize=(12, 8))

    winrates = [p[1] for p in patterns]
    frequencies = [p[2] for p in patterns]
    labels = [' '.join(p[0]) for p in patterns]

    ax.barh(range(len(patterns)), winrates, align='center', color='skyblue', zorder=10)
    ax.set_yticks(range(len(patterns)))
    ax.set_yticklabels(labels)
    ax.invert_yaxis()  # Invert the Y axis to display the best patterns on top

    ax.set_xlabel('Winrate (%)')
    ax.set_title(title)

    # Add occurrence frequency
    for i, v in enumerate(winrates):
        ax.text(v + 1, i, f'Freq: {frequencies[i]}', va='center')

    plt.tight_layout()
    plt.savefig(filename)
    plt.close()

# Visualize top buy and sell patterns
visualize_patterns(top_300_buy_patterns, f'Top 20 Buy Patterns for {symbol}', 'top_buy_patterns.png')
visualize_patterns(top_300_sell_patterns, f'Top 20 Sell Patterns for {symbol}', 'top_sell_patterns.png')

# Visualize the latest pattern and forecast
def visualize_forecast(pattern, winrate, frequency, direction, symbol, filename):
    fig, ax = plt.subplots(figsize=(8, 6))

    ax.bar(['Winrate'], [winrate], color='green' if direction == 'up' else 'red')
    ax.set_ylim(0, 100)
    ax.set_ylabel('Winrate (%)')
    ax.set_title(f'Forecast for {symbol}: Price will likely go {direction}')

    ax.text(0, winrate + 5, f'Pattern: {" ".join(pattern)}', ha='center')
    ax.text(0, winrate - 5, f'Frequency: {frequency}', ha='center')

    plt.tight_layout()
    plt.savefig(filename)
    plt.close()

if last_buy_pattern:
    visualize_forecast(last_buy_pattern, last_buy_winrate, last_buy_frequency, 'up', symbol, 'buy_forecast.png')
if last_sell_pattern:
    visualize_forecast(last_sell_pattern, last_sell_winrate, last_sell_frequency, 'down', symbol, 'sell_forecast.png')
We created two functions: visualize_patterns and visualize_forecast. The first one draws an informative horizontal bar chart with the top 20 patterns, their win rates and occurrence frequency. The second one creates a visual representation of our forecast based on the latest pattern.
For patterns, we use horizontal columns because patterns can be long and it makes them easier to read. Our color is pleasant for the human eye to perceive - sky-blue.
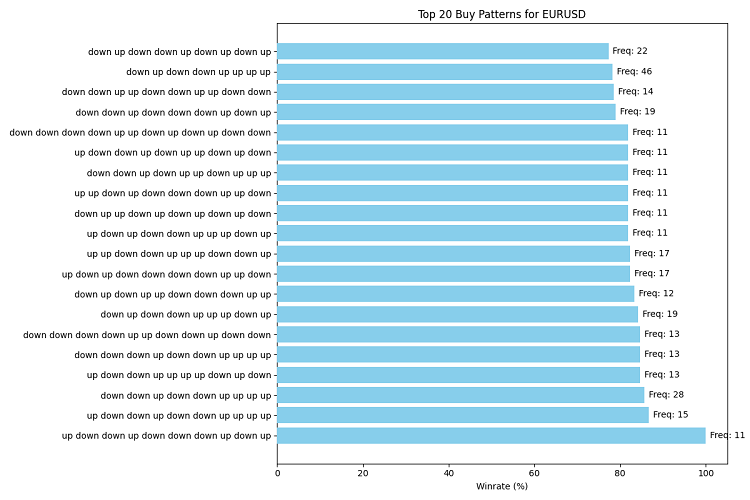
We save our masterpieces in PNG files.
Testing and backtesting the pattern analysis system
We have created our pattern analysis system, but how do we know if it actually works? To do this, we need to test it on historical data.
Here is our code needed for this task:
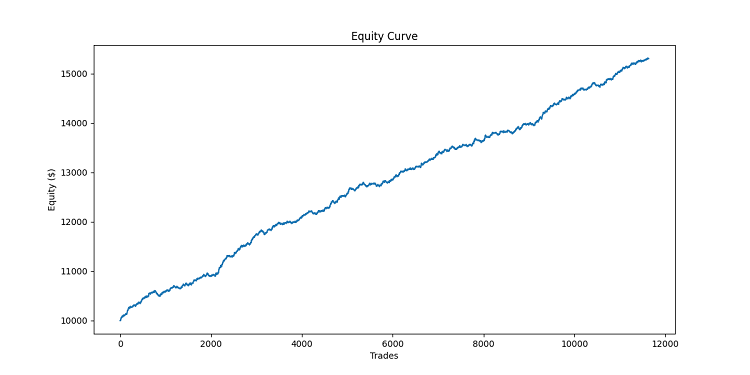
def simulate_trade(data, direction, entry_price, take_profit, stop_loss):
    for i, row in data.iterrows():
        current_price = row['close']

        if direction == "BUY":
            if current_price >= entry_price + take_profit:
                return {'profit': take_profit, 'duration': i}
            elif current_price <= entry_price - stop_loss:
                return {'profit': -stop_loss, 'duration': i}
        else:  # SELL
            if current_price <= entry_price - take_profit:
                return {'profit': take_profit, 'duration': i}
            elif current_price >= entry_price + stop_loss:
                return {'profit': -stop_loss, 'duration': i}

    # If the loop ends without reaching TP or SL, close at the current price
    last_price = data['close'].iloc[-1]
    profit = (last_price - entry_price) if direction == "BUY" else (entry_price - last_price)
    return {'profit': profit, 'duration': len(data)}

def backtest_pattern_system(data, buy_patterns, sell_patterns):
    equity_curve = [10000]  # Initial capital $10,000
    trades = []

    for i in range(len(data) - max(len(p[0]) for p in buy_patterns + sell_patterns)):
        current_data = data.iloc[:i+1]
        last_pattern = tuple(current_data['direction'].iloc[-len(buy_patterns[0][0]):])

        matching_buy = [p for p in buy_patterns if p[0] == last_pattern]
        matching_sell = [p for p in sell_patterns if p[0] == last_pattern]

        if matching_buy and not matching_sell:
            entry_price = current_data['close'].iloc[-1]
            take_profit = 0.001  # 10 pips
            stop_loss = 0.0005  # 5 pips
            trade_result = simulate_trade(data.iloc[i+1:], "BUY", entry_price, take_profit, stop_loss)
            trades.append(trade_result)
            equity_curve.append(equity_curve[-1] + trade_result['profit'] * 10000)  # Multiply by 10000 to convert to USD
        elif matching_sell and not matching_buy:
            entry_price = current_data['close'].iloc[-1]
            take_profit = 0.001  # 10 pips
            stop_loss = 0.0005  # 5 pips
            trade_result = simulate_trade(data.iloc[i+1:], "SELL", entry_price, take_profit, stop_loss)
            trades.append(trade_result)
            equity_curve.append(equity_curve[-1] + trade_result['profit'] * 10000)  # Multiply by 10000 to convert to USD
        else:
            equity_curve.append(equity_curve[-1])

    return equity_curve, trades

# Conduct a backtest
equity_curve, trades = backtest_pattern_system(ohlc_data, top_300_buy_patterns, top_300_sell_patterns)

# Visualizing backtest results
plt.figure(figsize=(12, 6))
plt.plot(equity_curve)
plt.title('Equity Curve')
plt.xlabel('Trades')
plt.ylabel('Equity ($)')
plt.savefig('equity_curve.png')
plt.close()

# Calculating backtest statistics
total_profit = equity_curve[-1] - equity_curve[0]
win_rate = sum(1 for trade in trades if trade['profit'] > 0) / len(trades) if trades else 0
average_profit = sum(trade['profit'] for trade in trades) / len(trades) if trades else 0

print(f"\nBacktest Results:")
print(f"Total Profit: ${total_profit:.2f}")
print(f"Win Rate: {win_rate:.2%}")
print(f"Average Profit per Trade: ${average_profit*10000:.2f}")
print(f"Total Trades: {len(trades)}")
What is going on here? The simulate_trade function is our simulator of a single trade. It monitors the price and closes the trade when take profit or stop loss is reached.
backtest_pattern_system is a more important function. It goes through the historical data, step by step, day by day, checking to see if one of our patterns has formed. Found a buy pattern? Then we buy. Found a sell one? We sell.
We use fixed take profit of 100 points and stop loss of 50 points. We need to set the boundaries for a satisfactory profit - not too much so that we do not risk more than the limit, but not too little so that the profit can grow.
After each trade we update our equity curve. At the end of our work we get the following result: how much we earned in total, what percentage of transactions were profitable, what is the average profit per trade. And of course, we visualize the results.
Let's implement pattern search using MQL5 language. Here is our code:
//+------------------------------------------------------------------+
//|                                       PatternProbabilityIndicator|
//|                                                 Copyright 2024   |
//|                                             https://www.mql5.com |
//+------------------------------------------------------------------+
#property copyright "Copyright 2024, Your Name Here"
#property link      "https://www.mql5.com"
#property version   "1.06"
#property indicator_chart_window
#property indicator_buffers 2
#property indicator_plots   2

//--- plot BuyProbability
#property indicator_label1  "BuyProbability"
#property indicator_type1   DRAW_LINE
#property indicator_color1  clrGreen
#property indicator_style1  STYLE_SOLID
#property indicator_width1  2

//--- plot SellProbability
#property indicator_label2  "SellProbability"
#property indicator_type2   DRAW_LINE
#property indicator_color2  clrRed
#property indicator_style2  STYLE_SOLID
#property indicator_width2  2

//--- input parameters
input int      InpPatternLength = 5;    // Pattern Length (3-10)
input int      InpLookback     = 1000;  // Lookback Period (100-5000)
input int      InpForecastHorizon = 6;  // Forecast Horizon (1-20)

//--- indicator buffers
double         BuyProbabilityBuffer[];
double         SellProbabilityBuffer[];

//--- global variables
int            g_pattern_length;
int            g_lookback;
int            g_forecast_horizon;
string         g_patterns[];
int            g_pattern_count;
int            g_pattern_occurrences[];
int            g_pattern_successes[];
int            g_total_bars;

//+------------------------------------------------------------------+
//| Custom indicator initialization function                         |
//+------------------------------------------------------------------+
int OnInit()
{
   //--- validate inputs
   if(InpPatternLength < 3 || InpPatternLength > 10)
   {
      Print("Invalid Pattern Length. Must be between 3 and 10.");
      return INIT_PARAMETERS_INCORRECT;
   }

   if(InpLookback < 100 || InpLookback > 5000)
   {
      Print("Invalid Lookback Period. Must be between 100 and 5000.");
      return INIT_PARAMETERS_INCORRECT;
   }

   if(InpForecastHorizon < 1 || InpForecastHorizon > 20)
   {
      Print("Invalid Forecast Horizon. Must be between 1 and 20.");
      return INIT_PARAMETERS_INCORRECT;
   }

   //--- indicator buffers mapping
   SetIndexBuffer(0, BuyProbabilityBuffer, INDICATOR_DATA);
   SetIndexBuffer(1, SellProbabilityBuffer, INDICATOR_DATA);

   //--- set accuracy
   IndicatorSetInteger(INDICATOR_DIGITS, 2);

   //--- set global variables
   g_pattern_length = InpPatternLength;
   g_lookback = InpLookback;
   g_forecast_horizon = InpForecastHorizon;

   //--- generate all possible patterns
   if(!GeneratePatterns())
   {
      Print("Failed to generate patterns.");
      return INIT_FAILED;
   }

   g_total_bars = iBars(_Symbol, PERIOD_CURRENT);

   return(INIT_SUCCEEDED);
}

//+------------------------------------------------------------------+
//| Custom indicator iteration function                              |
//+------------------------------------------------------------------+
int OnCalculate(const int rates_total,
                const int prev_calculated,
                const datetime &time[],
                const double &open[],
                const double &high[],
                const double &low[],
                const double &close[],
                const long &tick_volume[],
                const long &volume[],
                const int &spread[])
{
   //--- check for rates total
   if(rates_total <= g_lookback + g_pattern_length + g_forecast_horizon)
   {
      Print("Not enough data for calculation.");
      return 0;
   }

   int start = (prev_calculated > g_lookback + g_pattern_length + g_forecast_horizon) ?
               prev_calculated - 1 : g_lookback + g_pattern_length + g_forecast_horizon;

   if(ArraySize(g_pattern_occurrences) != g_pattern_count)
   {
      ArrayResize(g_pattern_occurrences, g_pattern_count);
      ArrayResize(g_pattern_successes, g_pattern_count);
   }

   ArrayInitialize(g_pattern_occurrences, 0);
   ArrayInitialize(g_pattern_successes, 0);

   // Pre-calculate patterns for efficiency
   string patterns[];
   ArrayResize(patterns, rates_total);
   for(int i = g_pattern_length; i < rates_total; i++)
   {
      patterns[i] = "";
      for(int j = 0; j < g_pattern_length; j++)
      {
         patterns[i] += (close[i-j] > close[i-j-1]) ? "U" : "D";
      }
   }

   // Main calculation loop
   for(int i = start; i < rates_total; i++)
   {
      string current_pattern = patterns[i];

      if(StringLen(current_pattern) != g_pattern_length) continue;

      double buy_probability = CalculateProbability(current_pattern, true, close, patterns, i);
      double sell_probability = CalculateProbability(current_pattern, false, close, patterns, i);

      BuyProbabilityBuffer[i] = buy_probability;
      SellProbabilityBuffer[i] = sell_probability;
   }

   // Update Comment with pattern statistics if total bars changed
   if(g_total_bars != iBars(_Symbol, PERIOD_CURRENT))
   {
      g_total_bars = iBars(_Symbol, PERIOD_CURRENT);
      UpdatePatternStatistics();
   }

   return(rates_total);
}

//+------------------------------------------------------------------+
//| Generate all possible patterns                                   |
//+------------------------------------------------------------------+
bool GeneratePatterns()
{
   g_pattern_count = (int)MathPow(2, g_pattern_length);
   if(!ArrayResize(g_patterns, g_pattern_count))
   {
      Print("Failed to resize g_patterns array.");
      return false;
   }

   for(int i = 0; i < g_pattern_count; i++)
   {
      string pattern = "";
      for(int j = 0; j < g_pattern_length; j++)
      {
         pattern += ((i >> j) & 1) ? "U" : "D";
      }
      g_patterns[i] = pattern;
   }

   return true;
}

//+------------------------------------------------------------------+
//| Calculate probability for a given pattern                        |
//+------------------------------------------------------------------+
double CalculateProbability(const string &pattern, bool is_buy, const double &close[], const string &patterns[], int current_index)
{
   if(StringLen(pattern) != g_pattern_length || current_index < g_lookback)
   {
      return 50.0; // Return neutral probability on error
   }

   int pattern_index = ArraySearch(g_patterns, pattern);
   if(pattern_index == -1)
   {
      return 50.0;
   }

   int total_occurrences = 0;
   int successful_predictions = 0;

   for(int i = g_lookback; i > g_pattern_length + g_forecast_horizon; i--)
   {
      int historical_index = current_index - i;
      if(historical_index < 0 || historical_index + g_pattern_length + g_forecast_horizon >= ArraySize(close))
      {
         continue;
      }

      if(patterns[historical_index] == pattern)
      {
         total_occurrences++;
         g_pattern_occurrences[pattern_index]++;
         if(is_buy && close[historical_index + g_pattern_length + g_forecast_horizon] > close[historical_index + g_pattern_length])
         {
            successful_predictions++;
            g_pattern_successes[pattern_index]++;
         }
         else if(!is_buy && close[historical_index + g_pattern_length + g_forecast_horizon] < close[historical_index + g_pattern_length])
         {
            successful_predictions++;
            g_pattern_successes[pattern_index]++;
         }
      }
   }

   return (total_occurrences > 0) ? (double)successful_predictions / total_occurrences * 100 : 50;
}

//+------------------------------------------------------------------+
//| Update pattern statistics and display in Comment                 |
//+------------------------------------------------------------------+
void UpdatePatternStatistics()
{
   string comment = "Pattern Statistics:\n";
   comment += "Pattern Length: " + IntegerToString(g_pattern_length) + "\n";
   comment += "Lookback Period: " + IntegerToString(g_lookback) + "\n";
   comment += "Forecast Horizon: " + IntegerToString(g_forecast_horizon) + "\n\n";
   comment += "Top 5 Patterns:\n";

   int sorted_indices[];
   ArrayResize(sorted_indices, g_pattern_count);
   for(int i = 0; i < g_pattern_count; i++) sorted_indices[i] = i;

   // Use quick sort for better performance
   ArraySort(sorted_indices);

   for(int i = 0; i < 5 && i < g_pattern_count; i++)
   {
      int idx = sorted_indices[g_pattern_count - 1 - i];  // Reverse order for descending sort
      double win_rate = g_pattern_occurrences[idx] > 0 ?
                        (double)g_pattern_successes[idx] / g_pattern_occurrences[idx] * 100 : 0;

      comment += g_patterns[idx] + ": " +
                 "Occurrences: " + IntegerToString(g_pattern_occurrences[idx]) + ", " +
                 "Win Rate: " + DoubleToString(win_rate, 2) + "%\n";
   }

   Comment(comment);
}

//+------------------------------------------------------------------+
//| Custom function to search for a string in an array               |
//+------------------------------------------------------------------+
int ArraySearch(const string &arr[], string value)
{
   for(int i = 0; i < ArraySize(arr); i++)
   {
      if(arr[i] == value) return i;
   }
   return -1;
}
This is how it looks on the chart:
Creating an EA for pattern detection and trading
Next, I checked the developments in the MetaTrader 5 tester, because the tests in Python were successful. The code below is also attached to the article. The code is a practical implementation of the concept of pattern analysis in the foreign exchange market. It embodies the idea that historical price patterns can provide statistically significant information about future market movements.
EA key components:
- Pattern generation: The EA uses a binary representation of price movements (upward or downward), creating all possible combinations for a given pattern length.
- Statistical analysis: The EA performs a retrospective analysis, assessing the frequency of occurrence of each pattern and its predictive efficiency.
- Dynamic adaptation: The EA continuously updates pattern statistics to adapt to changing market conditions.
- Making trading decisions: Based on the identified most effective patterns for buying and selling, the EA opens, closes or holds positions.
- Parameterization: The EA provides the ability to customize key parameters, such as pattern length, analysis period, forecast horizon, and the minimum number of pattern occurrences to account for.
In total, I made 4 versions of the EA: the first one is based on the concept of the article, it opens trades based on patterns, and closes them when a new better pattern in the opposite direction is detected. The second one is the same, but multi-currency one: it works with the 10 most liquid Forex pairs, according to World Bank statistics. The third one is the same, but it closes trades when the price passes a number of bars greater than the forecast horizon. The last one is closing by take profit and stop.
Here is the code for the first EA, the rest will be in the attached files:
//+------------------------------------------------------------------+
//|                                  PatternProbabilityExpertAdvisor |
//|                                Copyright 2024, Evgeniy Koshtenko |
//|                          https://www.mql5.com/en/users/koshtenko |
//+------------------------------------------------------------------+
#property copyright "Copyright 2023, Evgeniy Koshtenko"
#property link      "https://www.mql5.com/en/users/koshtenko"
#property version   "1.00"

#include <Trade\Trade.mqh>            // Include the CTrade trading class

//--- input parameters
input int      InpPatternLength = 5;    // Pattern Length (3-10)
input int      InpLookback     = 1000;  // Lookback Period (100-5000)
input int      InpForecastHorizon = 6;  // Forecast Horizon (1-20)
input double   InpLotSize = 0.1;        // Lot Size
input int      InpMinOccurrences = 30;  // Minimum Pattern Occurrences

//--- global variables
int            g_pattern_length;
int            g_lookback;
int            g_forecast_horizon;
string         g_patterns[];
int            g_pattern_count;
int            g_pattern_occurrences[];
int            g_pattern_successes[];
int            g_total_bars;
string         g_best_buy_pattern = "";
string         g_best_sell_pattern = "";

CTrade trade;                         // Use the CTrade trading class
//+------------------------------------------------------------------+
//| Expert initialization function                                   |
//+------------------------------------------------------------------+
int OnInit()
{
   //--- validate inputs
   if(InpPatternLength < 3 || InpPatternLength > 10)
   {
      Print("Invalid Pattern Length. Must be between 3 and 10.");
      return INIT_PARAMETERS_INCORRECT;
   }

   if(InpLookback < 100 || InpLookback > 5000)
   {
      Print("Invalid Lookback Period. Must be between 100 and 5000.");
      return INIT_PARAMETERS_INCORRECT;
   }

   if(InpForecastHorizon < 1 || InpForecastHorizon > 20)
   {
      Print("Invalid Forecast Horizon. Must be between 1 and 20.");
      return INIT_PARAMETERS_INCORRECT;
   }

   //--- set global variables
   g_pattern_length = InpPatternLength;
   g_lookback = InpLookback;
   g_forecast_horizon = InpForecastHorizon;

   //--- generate all possible patterns
   if(!GeneratePatterns())
   {
      Print("Failed to generate patterns.");
      return INIT_FAILED;
   }

   g_total_bars = iBars(_Symbol, PERIOD_CURRENT);

   return(INIT_SUCCEEDED);
}

//+------------------------------------------------------------------+
//| Expert tick function                                             |
//+------------------------------------------------------------------+
void OnTick()
{
   if(!IsNewBar()) return;

   UpdatePatternStatistics();

   string current_pattern = GetCurrentPattern();

   if(current_pattern == g_best_buy_pattern)
   {
      if(PositionSelect(_Symbol) && PositionGetInteger(POSITION_TYPE) == POSITION_TYPE_SELL)
      {
         trade.PositionClose(_Symbol);
      }
      if(!PositionSelect(_Symbol))
      {
         trade.Buy(InpLotSize, _Symbol, 0, 0, 0, "Buy Pattern: " + current_pattern);
      }
   }
   else if(current_pattern == g_best_sell_pattern)
   {
      if(PositionSelect(_Symbol) && PositionGetInteger(POSITION_TYPE) == POSITION_TYPE_BUY)
      {
         trade.PositionClose(_Symbol);
      }
      if(!PositionSelect(_Symbol))
      {
         trade.Sell(InpLotSize, _Symbol, 0, 0, 0, "Sell Pattern: " + current_pattern);
      }
   }
}

//+------------------------------------------------------------------+
//| Generate all possible patterns                                   |
//+------------------------------------------------------------------+
bool GeneratePatterns()
{
   g_pattern_count = (int)MathPow(2, g_pattern_length);
   if(!ArrayResize(g_patterns, g_pattern_count))
   {
      Print("Failed to resize g_patterns array.");
      return false;
   }

   for(int i = 0; i < g_pattern_count; i++)
   {
      string pattern = "";
      for(int j = 0; j < g_pattern_length; j++)
      {
         pattern += ((i >> j) & 1) ? "U" : "D";
      }
      g_patterns[i] = pattern;
   }

   return true;
}

//+------------------------------------------------------------------+
//| Update pattern statistics and find best patterns                 |
//+------------------------------------------------------------------+
void UpdatePatternStatistics()
{
   if(ArraySize(g_pattern_occurrences) != g_pattern_count)
   {
      ArrayResize(g_pattern_occurrences, g_pattern_count);
      ArrayResize(g_pattern_successes, g_pattern_count);
   }

   ArrayInitialize(g_pattern_occurrences, 0);
   ArrayInitialize(g_pattern_successes, 0);

   int total_bars = iBars(_Symbol, PERIOD_CURRENT);
   int start = total_bars - g_lookback;
   if(start < g_pattern_length + g_forecast_horizon) start = g_pattern_length + g_forecast_horizon;

   double close[];
   ArraySetAsSeries(close, true);
   CopyClose(_Symbol, PERIOD_CURRENT, 0, total_bars, close);

   string patterns[];
   ArrayResize(patterns, total_bars);
   ArraySetAsSeries(patterns, true);

   for(int i = 0; i < total_bars - g_pattern_length; i++)
   {
      patterns[i] = "";
      for(int j = 0; j < g_pattern_length; j++)
      {
         patterns[i] += (close[i+j] > close[i+j+1]) ? "U" : "D";
      }
   }

   for(int i = start; i >= g_pattern_length + g_forecast_horizon; i--)
   {
      string current_pattern = patterns[i];
      int pattern_index = ArraySearch(g_patterns, current_pattern);

      if(pattern_index != -1)
      {
         g_pattern_occurrences[pattern_index]++;
         if(close[i-g_forecast_horizon] > close[i])
         {
            g_pattern_successes[pattern_index]++;
         }
      }
   }

   double best_buy_win_rate = 0;
   double best_sell_win_rate = 0;

   for(int i = 0; i < g_pattern_count; i++)
   {
      if(g_pattern_occurrences[i] >= InpMinOccurrences)
      {
         double win_rate = (double)g_pattern_successes[i] / g_pattern_occurrences[i];
         if(win_rate > best_buy_win_rate)
         {
            best_buy_win_rate = win_rate;
            g_best_buy_pattern = g_patterns[i];
         }
         if((1 - win_rate) > best_sell_win_rate)
         {
            best_sell_win_rate = 1 - win_rate;
            g_best_sell_pattern = g_patterns[i];
         }
      }
   }

   Print("Best Buy Pattern: ", g_best_buy_pattern, " (Win Rate: ", DoubleToString(best_buy_win_rate * 100, 2), "%)");
   Print("Best Sell Pattern: ", g_best_sell_pattern, " (Win Rate: ", DoubleToString(best_sell_win_rate * 100, 2), "%)");
}

//+------------------------------------------------------------------+
//| Get current price pattern                                        |
//+------------------------------------------------------------------+
string GetCurrentPattern()
{
   double close[];
   ArraySetAsSeries(close, true);
   CopyClose(_Symbol, PERIOD_CURRENT, 0, g_pattern_length + 1, close);

   string pattern = "";
   for(int i = 0; i < g_pattern_length; i++)
   {
      pattern += (close[i] > close[i+1]) ? "U" : "D";
   }

   return pattern;
}

//+------------------------------------------------------------------+
//| Custom function to search for a string in an array               |
//+------------------------------------------------------------------+
int ArraySearch(const string &arr[], string value)
{
   for(int i = 0; i < ArraySize(arr); i++)
   {
      if(arr[i] == value) return i;
   }
   return -1;
}

//+------------------------------------------------------------------+
//| Check if it's a new bar                                          |
//+------------------------------------------------------------------+
bool IsNewBar()
{
   static datetime last_time = 0;
   datetime current_time = iTime(_Symbol, PERIOD_CURRENT, 0);
   if(current_time != last_time)
   {
      last_time = current_time;
      return true;
   }
   return false;
}
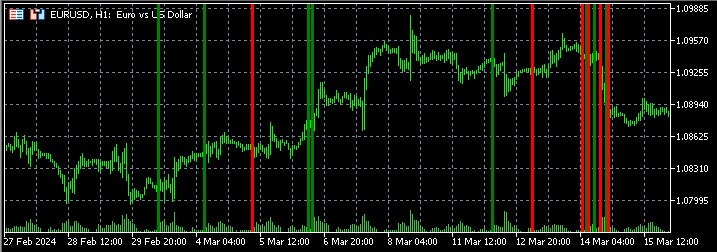
As for the test results, they are as follows on EURUSD:
And in detail:
Not bad, and the graphics are beautiful. Other EA versions either hang around zero or go into long drawdowns. The best option also does not quite fit my criteria. I prefer EAs with a profit factor above 2 and a Sharpe ratio above 1. It occurred to me that in the Python tester it was necessary to take into account both the trade commission, as well as spread and swap.
Potential improvements: Expanding timeframes and adding indicators
Let's continue our reflections. The system certainly shows positive results, but how can they be improved, and is it realistic?
Now we are looking at the 4-hour timeframe. Let's try to look further. We should add a daily, weekly, maybe even monthly chart. With this approach, we will be able to see more global trends and larger-scale patterns. Let's expand the code to cover all these time scales:
timeframes = [mt5.TIMEFRAME_H4, mt5.TIMEFRAME_D1, mt5.TIMEFRAME_W1, mt5.TIMEFRAME_MN1]
for tf in timeframes:
    ohlc_data = get_ohlc_data(symbol, tf, start_date, end_date)
    patterns = find_patterns(ohlc_data)
More data, more noise. We need to learn to sort this noise out to get clearer data.
Let's expand the range of analyzed features. In the trading world, this is the addition of technical indicators. RSI, MACD and Bollinger Bands are the most frequently used tools.
def add_indicators(data):
    data['RSI'] = ta.RSI(data['close'])
    data['MACD'] = ta.MACD(data['close']).macd()
    data['BB_upper'], data['BB_middle'], data['BB_lower'] = ta.BBANDS(data['close'])
    return data

ohlc_data = add_indicators(ohlc_data)
Indicators can help us confirm our pattern signals. Or, we can additionally search for patterns on indicators.
Conclusion
So we have finished our work on finding and analyzing patterns. We have created a system that looks for patterns in the market chaos. We learned to visualize our results, conduct backtests, plan for future improvements. But most importantly, we learned to think like analytical traders. We do not just follow the crowd, we look for our own path, our own patterns, our own possibilities.
Keep in mind that the market is a product of the actions of living people. It grows and changes. And our task is to change with it. Today's patterns may not work tomorrow, but that is not a reason to despair. This is an opportunity to learn, adapt, and grow. Use this system as a starting point. Experiment, improve, create your own. Maybe you will find that very pattern that will open the doors to successful trading!
Good luck to you on this exciting journey! Let your patterns always be profitable, and let losses be just lessons on your way to success. See you soon in the world of Forex!
Translated from Russian by MetaQuotes Ltd.
Original article: https://www.mql5.com/ru/articles/15965
Warning: All rights to these materials are reserved by MetaQuotes Ltd. Copying or reprinting of these materials in whole or in part is prohibited.
This article was written by a user of the site and reflects their personal views. MetaQuotes Ltd is not responsible for the accuracy of the information presented, nor for any consequences resulting from the use of the solutions, strategies or recommendations described.

 Creating a Trading Administrator Panel in MQL5 (Part XI): Modern feature communications interface (I)
- Free trading apps
- Over 8,000 signals for copying
- Economic news for exploring financial markets
You agree to website policy and terms of use
Thank you for this very pertinent article