Articles on data analysis and statistics in MQL5
Articles on mathematical models and laws of probability are interesting for many traders. Mathematics is the basis of technical indicators, and statistics is required to analyze trading results and develop strategies.
Read about the fuzzy logic, digital filters, market profile, Kohonen maps, neural gas and many other tools that can be used for trading.
Add a new article

You are missing trading opportunities:
- Free trading apps
- Over 8,000 signals for copying
- Economic news for exploring financial markets
Registration
Log in
You agree to website policy and terms of use
If you do not have an account, please register

Statistical Arbitrage Through Cointegrated Stocks (Part 1): Engle-Granger and Johansen Cointegration Tests
This article aims to provide a trader-friendly, gentle introduction to the most common cointegration tests, along with a simple guide to understanding their results. The Engle-Granger and Johansen cointegration tests can reveal statistically significant pairs or groups of assets that share long-term dynamics. The Johansen test is especially useful for portfolios with three or more assets, as it calculates the strength of cointegrating vectors all at once.

Using association rules in Forex data analysis
How to apply predictive rules of supermarket retail analytics to the real Forex market? How are purchases of cookies, milk and bread related to stock exchange transactions? The article discusses an innovative approach to algorithmic trading based on the use of association rules.

Price Action Analysis Toolkit Development (Part 30): Commodity Channel Index (CCI), Zero Line EA
Automating price action analysis is the way forward. In this article, we utilize the Dual CCI indicator, the Zero Line Crossover strategy, EMA, and price action to develop a tool that generates trade signals and sets stop-loss (SL) and take-profit (TP) levels using ATR. Please read this article to learn how we approach the development of the CCI Zero Line EA.

From Novice to Expert: Animated News Headline Using MQL5 (III) — Indicator Insights
In this article, we’ll advance the News Headline EA by introducing a dedicated indicator insights lane—a compact, on-chart display of key technical signals generated from popular indicators such as RSI, MACD, Stochastic, and CCI. This approach eliminates the need for multiple indicator subwindows on the MetaTrader 5 terminal, keeping your workspace clean and efficient. By leveraging the MQL5 API to access indicator data in the background, we can process and visualize market insights in real-time using custom logic. Join us as we explore how to manipulate indicator data in MQL5 to create an intelligent and space-saving scrolling insights system, all within a single horizontal lane on your trading chart.

Price Action Analysis Toolkit Development (Part 29): Boom and Crash Interceptor EA
Discover how the Boom & Crash Interceptor EA transforms your charts into a proactive alert system-spotting explosive moves with lightning-fast velocity scans, volatility surge checks, trend confirmation, and pivot-zone filters. With crisp green “Boom” and red “Crash” arrows guiding your every decision, this tool cuts through the noise and lets you capitalize on market spikes like never before. Dive in to see how it works and why it can become your next essential edge.

Volumetric neural network analysis as a key to future trends
The article explores the possibility of improving price forecasting based on trading volume analysis by integrating technical analysis principles with LSTM neural network architecture. Particular attention is paid to the detection and interpretation of anomalous volumes, the use of clustering and the creation of features based on volumes and their definition in the context of machine learning.

MetaTrader 5 Machine Learning Blueprint (Part 1): Data Leakage and Timestamp Fixes
Before we can even begin to make use of ML in our trading on MetaTrader 5, it’s crucial to address one of the most overlooked pitfalls—data leakage. This article unpacks how data leakage, particularly the MetaTrader 5 timestamp trap, can distort our model's performance and lead to unreliable trading signals. By diving into the mechanics of this issue and presenting strategies to prevent it, we pave the way for building robust machine learning models that deliver trustworthy predictions in live trading environments.

Developing a Replay System (Part 73): An Unusual Communication (II)
In this article, we will look at how to transmit information in real time between the indicator and the service, and also understand why problems may arise when changing the timeframe and how to solve them. As a bonus, you will get access to the latest version of the replay /simulation app.

Atomic Orbital Search (AOS) algorithm
The article considers the Atomic Orbital Search (AOS) algorithm, which uses the concepts of the atomic orbital model to simulate the search for solutions. The algorithm is based on probability distributions and the dynamics of interactions in the atom. The article discusses in detail the mathematical aspects of AOS, including updating the positions of candidate solutions and the mechanisms of energy absorption and release. AOS opens new horizons for applying quantum principles to computing problems by offering an innovative approach to optimization.

Data Science and ML (Part 44): Forex OHLC Time series Forecasting using Vector Autoregression (VAR)
Explore how Vector Autoregression (VAR) models can forecast Forex OHLC (Open, High, Low, and Close) time series data. This article covers VAR implementation, model training, and real-time forecasting in MetaTrader 5, helping traders analyze interdependent currency movements and improve their trading strategies.

Training a multilayer perceptron using the Levenberg-Marquardt algorithm
The article presents an implementation of the Levenberg-Marquardt algorithm for training feedforward neural networks. A comparative analysis of performance with algorithms from the scikit-learn Python library has been conducted. Simpler learning methods, such as gradient descent, gradient descent with momentum, and stochastic gradient descent are preliminarily discussed.

Data Science and ML (Part 43): Hidden Patterns Detection in Indicators Data Using Latent Gaussian Mixture Models (LGMM)
Have you ever looked at the chart and felt that strange sensation… that there’s a pattern hidden just beneath the surface? A secret code that might reveal where prices are headed if only you could crack it? Meet LGMM, the Market’s Hidden Pattern Detector. A machine learning model that helps identify those hidden patterns in the market.

Analyzing weather impact on currencies of agricultural countries using Python
What is the relationship between weather and Forex? Classical economic theory has long ignored the influence of such factors as weather on market behavior. But everything has changed. Let's try to find connections between the weather conditions and the position of agricultural currencies on the market.

From Novice to Expert: Animated News Headline Using MQL5 (I)
News accessibility is a critical factor when trading on the MetaTrader 5 terminal. While numerous news APIs are available, many traders face challenges in accessing and integrating them effectively into their trading environment. In this discussion, we aim to develop a streamlined solution that brings news directly onto the chart—where it’s most needed. We'll accomplish this by building a News Headline Expert Advisor that monitors and displays real-time news updates from API sources.

Developing a Replay System (Part 72): An Unusual Communication (I)
What we create today will be difficult to understand. Therefore, in this article I will only talk about the initial stage. Please read this article carefully, it is an important prerequisite before we proceed to the next step. The purpose of this material is purely didactic as we will only study and master the presented concepts, without practical application.

Price Action Analysis Toolkit Development (Part 27): Liquidity Sweep With MA Filter Tool
Understanding the subtle dynamics behind price movements can give you a critical edge. One such phenomenon is the liquidity sweep, a deliberate strategy that large traders, especially institutions, use to push prices through key support or resistance levels. These levels often coincide with clusters of retail stop-loss orders, creating pockets of liquidity that big players can exploit to enter or exit sizeable positions with minimal slippage.

ALGLIB library optimization methods (Part II)
In this article, we will continue to study the remaining optimization methods from the ALGLIB library, paying special attention to their testing on complex multidimensional functions. This will allow us not only to evaluate the efficiency of each algorithm, but also to identify their strengths and weaknesses in different conditions.

Price Action Analysis Toolkit Development (Part 26): Pin Bar, Engulfing Patterns and RSI Divergence (Multi-Pattern) Tool
Aligned with our goal of developing practical price-action tools, this article explores the creation of an EA that detects pin bar and engulfing patterns, using RSI divergence as a confirmation trigger before generating any trading signals.

Developing a Replay System (Part 71): Getting the Time Right (IV)
In this article, we will look at how to implement what was shown in the previous article related to our replay/simulation service. As in many other things in life, problems are bound to arise. And this case was no exception. In this article, we continue to improve things. The content presented here is intended solely for educational purposes. Under no circumstances should the application be viewed for any purpose other than to learn and master the concepts presented.

Data Science and ML (Part 42): Forex Time series Forecasting using ARIMA in Python, Everything you need to Know
ARIMA, short for Auto Regressive Integrated Moving Average, is a powerful traditional time series forecasting model. With the ability to detect spikes and fluctuations in a time series data, this model can make accurate predictions on the next values. In this article, we are going to understand what is it, how it operates, what you can do with it when it comes to predicting the next prices in the market with high accuracy and much more.
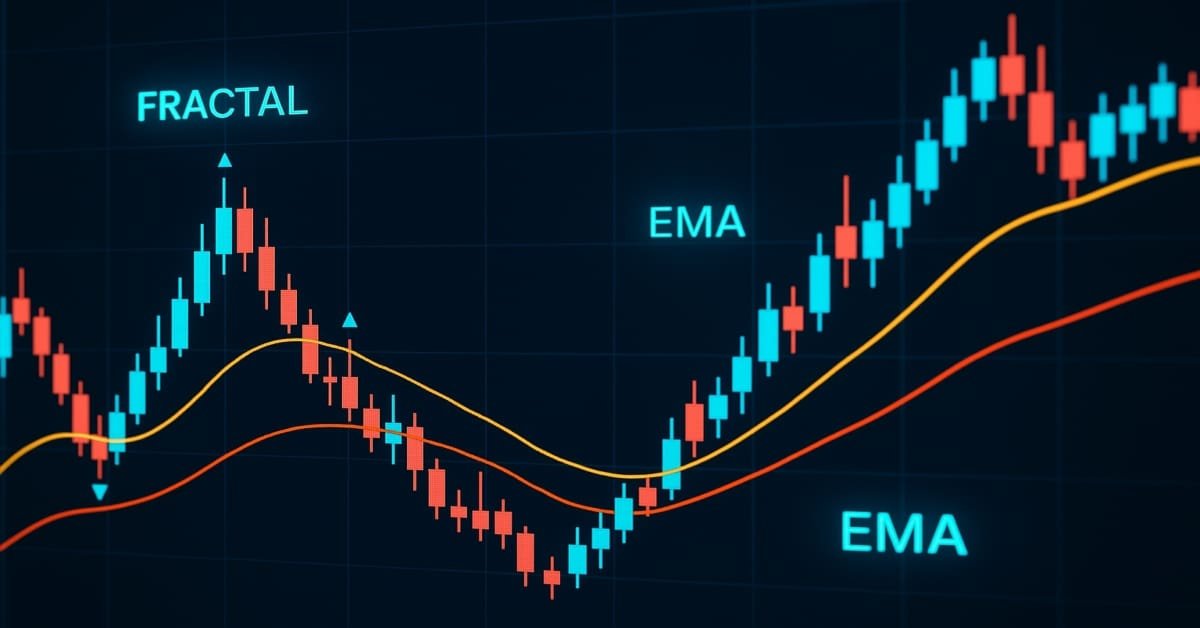
Price Action Analysis Toolkit Development (Part 25): Dual EMA Fractal Breaker
Price action is a fundamental approach for identifying profitable trading setups. However, manually monitoring price movements and patterns can be challenging and time-consuming. To address this, we are developing tools that analyze price action automatically, providing timely signals whenever potential opportunities are detected. This article introduces a robust tool that leverages fractal breakouts alongside EMA 14 and EMA 200 to generate reliable trading signals, helping traders make informed decisions with greater confidence.

ALGLIB library optimization methods (Part I)
In this article, we will get acquainted with the ALGLIB library optimization methods for MQL5. The article includes simple and clear examples of using ALGLIB to solve optimization problems, which will make mastering the methods as accessible as possible. We will take a detailed look at the connection of such algorithms as BLEIC, L-BFGS and NS, and use them to solve a simple test problem.

Build Self Optimizing Expert Advisors in MQL5 (Part 7): Trading With Multiple Periods At Once
In this series of articles, we have considered multiple different ways of identifying the best period to use our technical indicators with. Today, we shall demonstrate to the reader how they can instead perform the opposite logic, that is to say, instead of picking the single best period to use, we will demonstrate to the reader how to employ all available periods effectively. This approach reduces the amount of data discarded, and offers alternative use cases for machine learning algorithms beyond ordinary price prediction.

Developing a Replay System (Part 70): Getting the Time Right (III)
In this article, we will look at how to use the CustomBookAdd function correctly and effectively. Despite its apparent simplicity, it has many nuances. For example, it allows you to tell the mouse indicator whether a custom symbol is on auction, being traded, or the market is closed. The content presented here is intended solely for educational purposes. Under no circumstances should the application be viewed for any purpose other than to learn and master the concepts presented.

Building MQL5-Like Trade Classes in Python for MetaTrader 5
MetaTrader 5 python package provides an easy way to build trading applications for the MetaTrader 5 platform in the Python language, while being a powerful and useful tool, this module isn't as easy as MQL5 programming language when it comes to making an algorithmic trading solution. In this article, we are going to build trade classes similar to the one offered in MQL5 to create a similar syntax and make it easier to make trading robots in Python as in MQL5.

From Novice to Expert: Auto-Geometric Analysis System
Geometric patterns offer traders a concise way to interpret price action. Many analysts draw trend lines, rectangles, and other shapes by hand, and then base trading decisions on the formations they see. In this article, we explore an automated alternative: harnessing MQL5 to detect and analyze the most popular geometric patterns. We’ll break down the methodology, discuss implementation details, and highlight how automated pattern recognition can sharpen a trader's market insights.

Price Action Analysis Toolkit Development (Part 24): Price Action Quantification Analysis Tool
Candlestick patterns offer valuable insights into potential market moves. Some single candles signal continuation of the current trend, while others foreshadow reversals, depending on their position within the price action. This article introduces an EA that automatically identifies four key candlestick formations. Explore the following sections to learn how this tool can enhance your price-action analysis.

Developing a Replay System (Part 69): Getting the Time Right (II)
Today we will look at why we need the iSpread feature. At the same time, we will understand how the system informs us about the remaining time of the bar when there is not a single tick available for it. The content presented here is intended solely for educational purposes. Under no circumstances should the application be viewed for any purpose other than to learn and master the concepts presented.
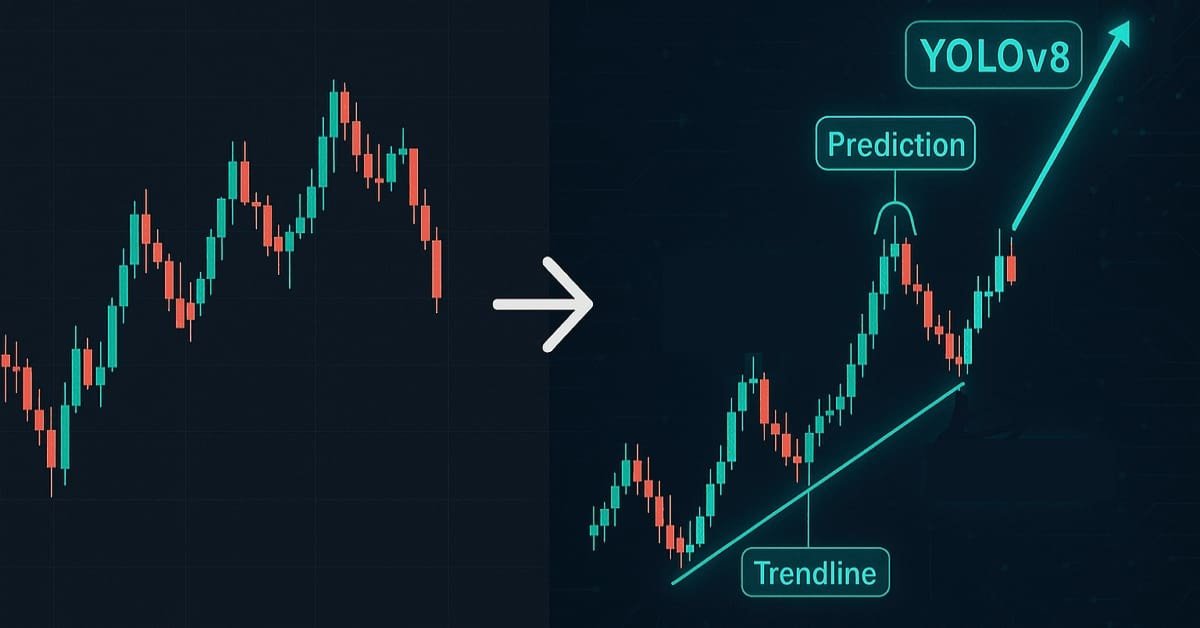
Data Science and ML (Part 41): Forex and Stock Markets Pattern Detection using YOLOv8
Detecting patterns in financial markets is challenging because it involves seeing what's on the chart, something that's difficult to undertake in MQL5 due to image limitations. In this article, we are going to discuss a decent model made in Python that helps us detect patterns present on the chart with minimal effort.

Price Action Analysis Toolkit Development (Part 23): Currency Strength Meter
Do you know what really drives a currency pair’s direction? It’s the strength of each individual currency. In this article, we’ll measure a currency’s strength by looping through every pair it appears in. That insight lets us predict how those pairs may move based on their relative strengths. Read on to learn more.

Data Science and ML (Part 40): Using Fibonacci Retracements in Machine Learning data
Fibonacci retracements are a popular tool in technical analysis, helping traders identify potential reversal zones. In this article, we’ll explore how these retracement levels can be transformed into target variables for machine learning models to help them understand the market better using this powerful tool.

Developing a Replay System (Part 68): Getting the Time Right (I)
Today we will continue working on getting the mouse pointer to tell us how much time is left on a bar during periods of low liquidity. Although at first glance it seems simple, in reality this task is much more difficult. This involves some obstacles that we will have to overcome. Therefore, it is important that you have a good understanding of the material in this first part of this subseries in order to understand the following parts.

Artificial Ecosystem-based Optimization (AEO) algorithm
The article considers a metaheuristic Artificial Ecosystem-based Optimization (AEO) algorithm, which simulates interactions between ecosystem components by creating an initial population of solutions and applying adaptive update strategies, and describes in detail the stages of AEO operation, including the consumption and decomposition phases, as well as different agent behavior strategies. The article introduces the features and advantages of this algorithm.

Data Science and ML (Part 39): News + Artificial Intelligence, Would You Bet on it?
News drives the financial markets, especially major releases like Non-Farm Payrolls (NFPs). We've all witnessed how a single headline can trigger sharp price movements. In this article, we dive into the powerful intersection of news data and Artificial Intelligence.
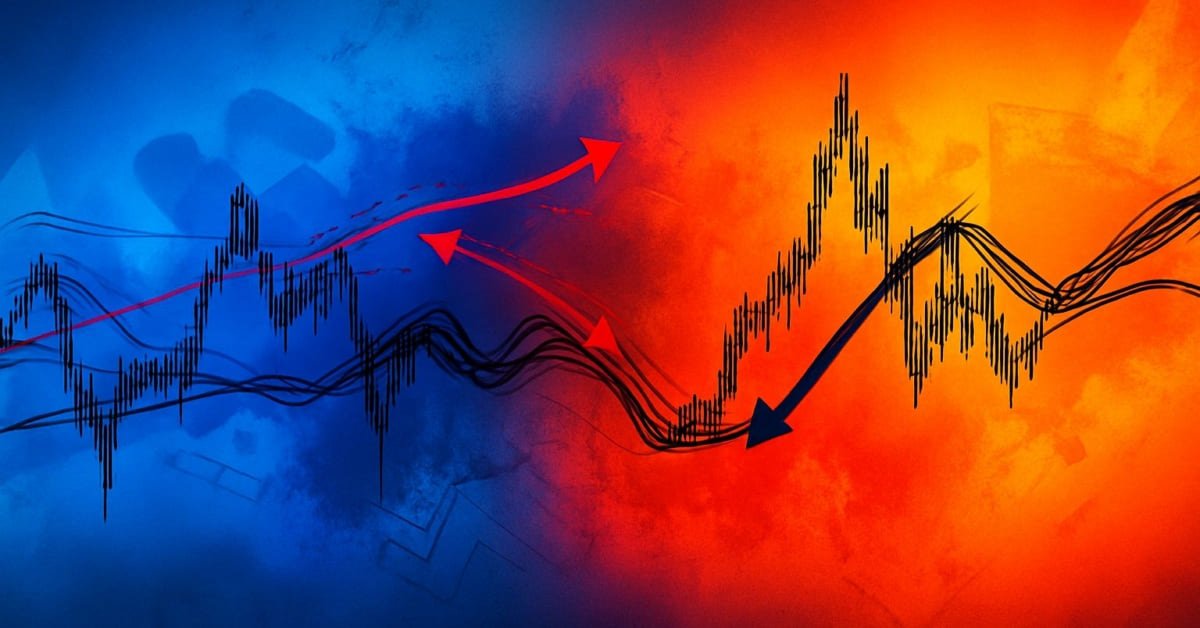
Price Action Analysis Toolkit Development (Part 22): Correlation Dashboard
This tool is a Correlation Dashboard that calculates and displays real-time correlation coefficients across multiple currency pairs. By visualizing how pairs move in relation to one another, it adds valuable context to your price-action analysis and helps you anticipate inter-market dynamics. Read on to explore its features and applications.

Developing a Replay System (Part 67): Refining the Control Indicator
In this article, we'll look at what can be achieved with a little code refinement. This refinement is aimed at simplifying our code, making more use of MQL5 library calls and, above all, making it much more stable, secure and easy to use in other projects that we may develop in the future.

Forecasting exchange rates using classic machine learning methods: Logit and Probit models
In the article, an attempt is made to build a trading EA for predicting exchange rate quotes. The algorithm is based on classical classification models - logistic and probit regression. The likelihood ratio criterion is used as a filter for trading signals.

Economic forecasts: Exploring the Python potential
How to use World Bank economic data for forecasts? What happens when you combine AI models and economics?

Creating a Trading Administrator Panel in MQL5 (Part XI): Modern feature communications interface (I)
Today, we are focusing on the enhancement of the Communications Panel messaging interface to align with the standards of modern, high-performing communication applications. This improvement will be achieved by updating the CommunicationsDialog class. Join us in this article and discussion as we explore key insights and outline the next steps in advancing interface programming using MQL5.

Finding custom currency pair patterns in Python using MetaTrader 5
Are there any repeating patterns and regularities in the Forex market? I decided to create my own pattern analysis system using Python and MetaTrader 5. A kind of symbiosis of math and programming for conquering Forex.