Articles on data analysis and statistics in MQL5
Articles on mathematical models and laws of probability are interesting for many traders. Mathematics is the basis of technical indicators, and statistics is required to analyze trading results and develop strategies.
Read about the fuzzy logic, digital filters, market profile, Kohonen maps, neural gas and many other tools that can be used for trading.
Add a new article

You are missing trading opportunities:
- Free trading apps
- Over 8,000 signals for copying
- Economic news for exploring financial markets
Registration
Log in
You agree to website policy and terms of use
If you do not have an account, please register

Causal analysis of time series using transfer entropy
In this article, we discuss how statistical causality can be applied to identify predictive variables. We will explore the link between causality and transfer entropy, as well as present MQL5 code for detecting directional transfers of information between two variables.

MQL5 Wizard Techniques you should know (Part 29): Continuation on Learning Rates with MLPs
We wrap up our look at learning rate sensitivity to the performance of Expert Advisors by primarily examining the Adaptive Learning Rates. These learning rates aim to be customized for each parameter in a layer during the training process and so we assess potential benefits vs the expected performance toll.

Developing a Replay System (Part 42): Chart Trade Project (I)
Let's create something more interesting. I don't want to spoil the surprise, so follow the article for a better understanding. From the very beginning of this series on developing the replay/simulator system, I was saying that the idea is to use the MetaTrader 5 platform in the same way both in the system we are developing and in the real market. It is important that this is done properly. No one wants to train and learn to fight using one tool while having to use another one during the fight.

Hybridization of population algorithms. Sequential and parallel structures
Here we will dive into the world of hybridization of optimization algorithms by looking at three key types: strategy mixing, sequential and parallel hybridization. We will conduct a series of experiments combining and testing relevant optimization algorithms.

Data Science and ML (Part 27): Convolutional Neural Networks (CNNs) in MetaTrader 5 Trading Bots — Are They Worth It?
Convolutional Neural Networks (CNNs) are renowned for their prowess in detecting patterns in images and videos, with applications spanning diverse fields. In this article, we explore the potential of CNNs to identify valuable patterns in financial markets and generate effective trading signals for MetaTrader 5 trading bots. Let us discover how this deep machine learning technique can be leveraged for smarter trading decisions.

Population optimization algorithms: Resistance to getting stuck in local extrema (Part II)
We continue our experiment that aims to examine the behavior of population optimization algorithms in the context of their ability to efficiently escape local minima when population diversity is low and reach global maxima. Research results are provided.

GIT: What is it?
In this article, I will introduce a very important tool for developers. If you are not familiar with GIT, read this article to get an idea of what it is and how to use it with MQL5.

Data Science and ML (Part 26): The Ultimate Battle in Time Series Forecasting — LSTM vs GRU Neural Networks
In the previous article, we discussed a simple RNN which despite its inability to understand long-term dependencies in the data, was able to make a profitable strategy. In this article, we are discussing both the Long-Short Term Memory(LSTM) and the Gated Recurrent Unit(GRU). These two were introduced to overcome the shortcomings of a simple RNN and to outsmart it.

SP500 Trading Strategy in MQL5 For Beginners
Discover how to leverage MQL5 to forecast the S&P 500 with precision, blending in classical technical analysis for added stability and combining algorithms with time-tested principles for robust market insights.

Portfolio Optimization in Python and MQL5
This article explores advanced portfolio optimization techniques using Python and MQL5 with MetaTrader 5. It demonstrates how to develop algorithms for data analysis, asset allocation, and trading signal generation, emphasizing the importance of data-driven decision-making in modern financial management and risk mitigation.

Price Driven CGI Model: Theoretical Foundation
Let's discuss the data manipulation algorithm, as we dive deeper into conceptualizing the idea of using price data to drive CGI objects. Think about transferring the effects of events, human emotions and actions on financial asset prices to a real-life model. This study delves into leveraging price data to influence the scale of a CGI object, controlling growth and emotions. These visible effects can establish a fresh analytical foundation for traders. Further insights are shared in the article.

MQL5 Wizard Techniques you should know (Part 27): Moving Averages and the Angle of Attack
The Angle of Attack is an often-quoted metric whose steepness is understood to strongly correlate with the strength of a prevailing trend. We look at how it is commonly used and understood and examine if there are changes that could be introduced in how it's measured for the benefit of a trade system that puts it in use.

Eigenvectors and eigenvalues: Exploratory data analysis in MetaTrader 5
In this article we explore different ways in which the eigenvectors and eigenvalues can be applied in exploratory data analysis to reveal unique relationships in data.

MQL5 Wizard Techniques you should know (Part 26): Moving Averages and the Hurst Exponent
The Hurst Exponent is a measure of how much a time series auto-correlates over the long term. It is understood to be capturing the long-term properties of a time series and therefore carries some weight in time series analysis even outside of economic/ financial time series. We however, focus on its potential benefit to traders by examining how this metric could be paired with moving averages to build a potentially robust signal.

Developing a Replay System (Part 41): Starting the second phase (II)
If everything seemed right to you up to this point, it means you're not really thinking about the long term, when you start developing applications. Over time you will no longer need to program new applications, you will just have to make them work together. So let's see how to finish assembling the mouse indicator.

MQL5 Wizard Techniques you should know (Part 25): Multi-Timeframe Testing and Trading
Strategies that are based on multiple time frames cannot be tested in wizard assembled Expert Advisors by default because of the MQL5 code architecture used in the assembly classes. We explore a possible work around this limitation for strategies that look to use multiple time frames in a case study with the quadratic moving average.

Data Science and Machine Learning (Part 25): Forex Timeseries Forecasting Using a Recurrent Neural Network (RNN)
Recurrent neural networks (RNNs) excel at leveraging past information to predict future events. Their remarkable predictive capabilities have been applied across various domains with great success. In this article, we will deploy RNN models to predict trends in the forex market, demonstrating their potential to enhance forecasting accuracy in forex trading.

Developing a Replay System (Part 40): Starting the second phase (I)
Today we'll talk about the new phase of the replay/simulator system. At this stage, the conversation will become truly interesting and quite rich in content. I strongly recommend that you read the article carefully and use the links provided in it. This will help you understand the content better.

Developing a Replay System (Part 39): Paving the Path (III)
Before we proceed to the second stage of development, we need to revise some ideas. Do you know how to make MQL5 do what you need? Have you ever tried to go beyond what is contained in the documentation? If not, then get ready. Because we will be doing something that most people don't normally do.

Population optimization algorithms: Resistance to getting stuck in local extrema (Part I)
This article presents a unique experiment that aims to examine the behavior of population optimization algorithms in the context of their ability to efficiently escape local minima when population diversity is low and reach global maxima. Working in this direction will provide further insight into which specific algorithms can successfully continue their search using coordinates set by the user as a starting point, and what factors influence their success.

MQL5 Wizard Techniques you should know (Part 24): Moving Averages
Moving Averages are a very common indicator that are used and understood by most Traders. We explore possible use cases that may not be so common within MQL5 Wizard assembled Expert Advisors.

The base class of population algorithms as the backbone of efficient optimization
The article represents a unique research attempt to combine a variety of population algorithms into a single class to simplify the application of optimization methods. This approach not only opens up opportunities for the development of new algorithms, including hybrid variants, but also creates a universal basic test stand. This stand becomes a key tool for choosing the optimal algorithm depending on a specific task.

Data Science and Machine Learning (Part 24): Forex Time series Forecasting Using Regular AI Models
In the forex markets It is very challenging to predict the future trend without having an idea of the past. Very few machine learning models are capable of making the future predictions by considering past values. In this article, we are going to discuss how we can use classical(Non-time series) Artificial Intelligence models to beat the market

Integrating Hidden Markov Models in MetaTrader 5
In this article we demonstrate how Hidden Markov Models trained using Python can be integrated into MetaTrader 5 applications. Hidden Markov Models are a powerful statistical tool used for modeling time series data, where the system being modeled is characterized by unobservable (hidden) states. A fundamental premise of HMMs is that the probability of being in a given state at a particular time depends on the process's state at the previous time slot.

News Trading Made Easy (Part 2): Risk Management
In this article, inheritance will be introduced into our previous and new code. A new database design will be implemented to provide efficiency. Additionally, a risk management class will be created to tackle volume calculations.

MQL5 Wizard Techniques you should know (Part 21): Testing with Economic Calendar Data
Economic Calendar Data is not available for testing with Expert Advisors within Strategy Tester, by default. We look at how Databases could help in providing a work around this limitation. So, for this article we explore how SQLite databases can be used to archive Economic Calendar news such that wizard assembled Expert Advisors can use this to generate trade signals.

Data Science and Machine Learning (Part 23): Why LightGBM and XGBoost outperform a lot of AI models?
These advanced gradient-boosted decision tree techniques offer superior performance and flexibility, making them ideal for financial modeling and algorithmic trading. Learn how to leverage these tools to optimize your trading strategies, improve predictive accuracy, and gain a competitive edge in the financial markets.

Population optimization algorithms: Evolution of Social Groups (ESG)
We will consider the principle of constructing multi-population algorithms. As an example of this type of algorithm, we will have a look at the new custom algorithm - Evolution of Social Groups (ESG). We will analyze the basic concepts, population interaction mechanisms and advantages of this algorithm, as well as examine its performance in optimization problems.

Integrate Your Own LLM into EA (Part 3): Training Your Own LLM with CPU
With the rapid development of artificial intelligence today, language models (LLMs) are an important part of artificial intelligence, so we should think about how to integrate powerful LLMs into our algorithmic trading. For most people, it is difficult to fine-tune these powerful models according to their needs, deploy them locally, and then apply them to algorithmic trading. This series of articles will take a step-by-step approach to achieve this goal.

Modified Grid-Hedge EA in MQL5 (Part IV): Optimizing Simple Grid Strategy (I)
In this fourth part, we revisit the Simple Hedge and Simple Grid Expert Advisors (EAs) developed earlier. Our focus shifts to refining the Simple Grid EA through mathematical analysis and a brute force approach, aiming for optimal strategy usage. This article delves deep into the mathematical optimization of the strategy, setting the stage for future exploration of coding-based optimization in later installments.

Causal inference in time series classification problems
In this article, we will look at the theory of causal inference using machine learning, as well as the custom approach implementation in Python. Causal inference and causal thinking have their roots in philosophy and psychology and play an important role in our understanding of reality.

Spurious Regressions in Python
Spurious regressions occur when two time series exhibit a high degree of correlation purely by chance, leading to misleading results in regression analysis. In such cases, even though variables may appear to be related, the correlation is coincidental and the model may be unreliable.

MQL5 Wizard Techniques you should know (Part 20): Symbolic Regression
Symbolic Regression is a form of regression that starts with minimal to no assumptions on what the underlying model that maps the sets of data under study would look like. Even though it can be implemented by Bayesian Methods or Neural Networks, we look at how an implementation with Genetic Algorithms can help customize an expert signal class usable in the MQL5 wizard.

Population optimization algorithms: Binary Genetic Algorithm (BGA). Part II
In this article, we will look at the binary genetic algorithm (BGA), which models the natural processes that occur in the genetic material of living things in nature.

Population optimization algorithms: Binary Genetic Algorithm (BGA). Part I
In this article, we will explore various methods used in binary genetic and other population algorithms. We will look at the main components of the algorithm, such as selection, crossover and mutation, and their impact on the optimization. In addition, we will study data presentation methods and their impact on optimization results.

MQL5 Wizard Techniques you should know (Part 19): Bayesian Inference
Bayesian inference is the adoption of Bayes Theorem to update probability hypothesis as new information is made available. This intuitively leans to adaptation in time series analysis, and so we have a look at how we could use this in building custom classes not just for the signal but also money-management and trailing-stops.

A feature selection algorithm using energy based learning in pure MQL5
In this article we present the implementation of a feature selection algorithm described in an academic paper titled,"FREL: A stable feature selection algorithm", called Feature weighting as regularized energy based learning.

MQL5 Wizard Techniques you should know (Part 18): Neural Architecture Search with Eigen Vectors
Neural Architecture Search, an automated approach at determining the ideal neural network settings can be a plus when facing many options and large test data sets. We examine how when paired Eigen Vectors this process can be made even more efficient.
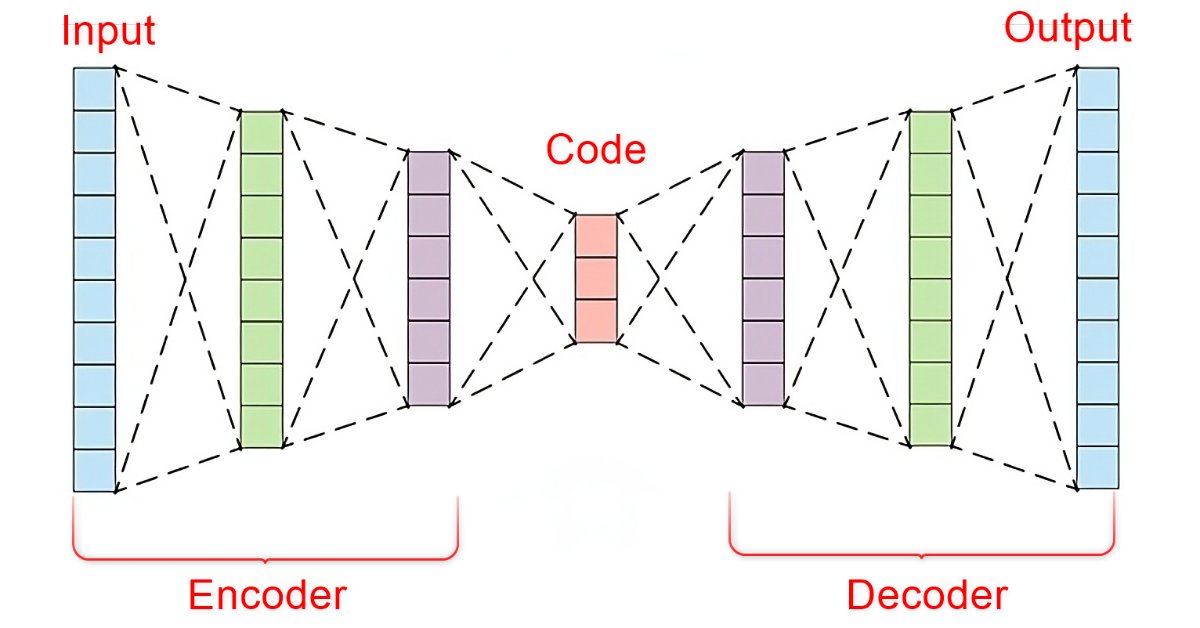
Data Science and Machine Learning (Part 22): Leveraging Autoencoders Neural Networks for Smarter Trades by Moving from Noise to Signal
In the fast-paced world of financial markets, separating meaningful signals from the noise is crucial for successful trading. By employing sophisticated neural network architectures, autoencoders excel at uncovering hidden patterns within market data, transforming noisy input into actionable insights. In this article, we explore how autoencoders are revolutionizing trading practices, offering traders a powerful tool to enhance decision-making and gain a competitive edge in today's dynamic markets.

Developing a Replay System (Part 38): Paving the Path (II)
Many people who consider themselves MQL5 programmers do not have the basic knowledge that I will outline in this article. Many people consider MQL5 to be a limited tool, but the actual reason is that they do not have the required knowledge. So, if you don't know something, don't be ashamed of it. It's better to feel ashamed for not asking. Simply forcing MetaTrader 5 to disable indicator duplication in no way ensures two-way communication between the indicator and the Expert Advisor. We are still very far from this, but the fact that the indicator is not duplicated on the chart gives us some confidence.