
Developing Market Entropy Indicator: Trading System Based on Information Theory

Table of contents:
Introduction
Traders and algorithm developers constantly face a critical question: is the market currently structured and suitable for trend-following strategies, or is it in a transitional or chaotic state where conventional indicators generate mostly noise? While most tools focus on price and its derivatives, they rarely quantify the degree of randomness in price action. As a result, many systems apply the same logic across all market conditions, leading to false entries, poor signal quality, and inconsistent performance in unpredictable environments.
To address this, we introduce a framework that formalizes market randomness using Shannon entropy applied to discretized price states (up, down, flat). The Market Entropy Indicator computes a normalized entropy score over a rolling window and maps it into distinct market regimes—TREND, TRANSITION, and CHAOTIC—using clearly defined thresholds. We augment this with fast/slow entropy horizons, entropy momentum, divergence, and compression/decompression detection so the informational state is both measurable and implementable in MQL5 as buffers, regime flags, visual markers, and rule-based signal filters.
Indicator Overview and Understanding
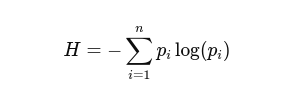
The Market Entropy Indicator is built upon Shannon's Information Theory, transforming price action into measurable information content through entropy calculation. At its core, the indicator analyzes price movements by classifying each bar into one of three states: up movement, down movement, or flat movement (determined by the PriceStep input). These states are then processed through a sliding window (EntropyPeriod) where the indicator counts the frequency of each state and applies the entropy formula:
This calculation reveals how much randomness exists in the market at any given time. When one movement type dominates (like mostly up moves in a strong trend), entropy becomes low, typically below 0.35, indicating structured, predictable market conditions. When movements are evenly distributed between up, down, and flat, entropy rises above 0.65, signaling chaotic, unpredictable market behavior. The indicator visualizes regimes with a color-coded histogram: green for trending, yellow for transition, and red for chaotic conditions. Additional lines show fast entropy (20), slow entropy (100), and their divergence.
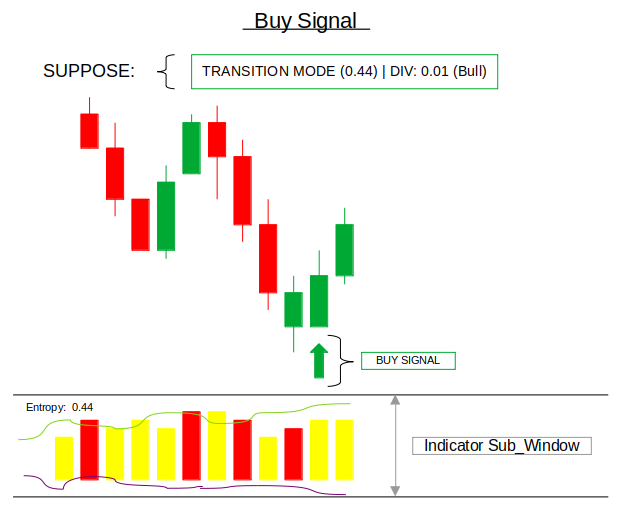
The progression from raw entropy calculation to actionable buy/sell signals involves analyzing how entropy interacts across multiple periods and detecting critical transitions in market structure. Buy signals typically emerge during a transition from compression to decompression. Specifically, fast entropy crosses above slow entropy, entropy rises from below 0.30 into the 0.35–0.45 range, and momentum turns positive. This suggests organized directional movement after consolidation.
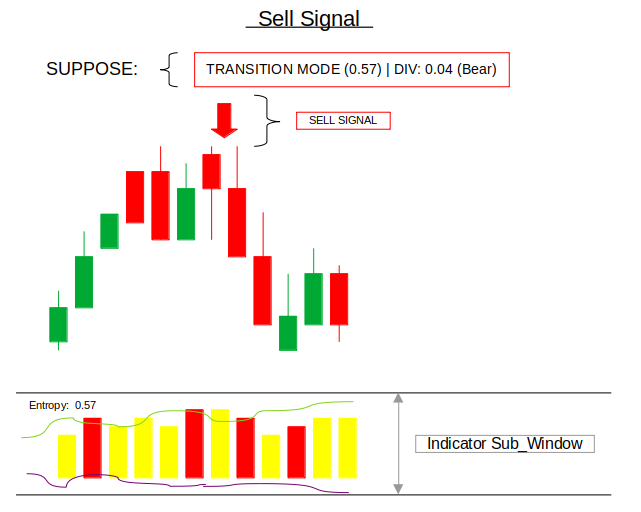
Conversely, sell signals are generated when the opposite occurs: fast entropy crosses below slow entropy, entropy breaks above 0.55 heading toward chaotic territory, and momentum turns negative, indicating the breakdown of market structure. The indicator also detects “information shocks” (25%+ entropy spikes) and regime shifts. All signals are drawn as single arrows on the main chart to prevent clustering. This multi-layered approach transforms abstract information theory into concrete trading signals by identifying when market randomness decreases (favorable for trend following) or increases (warning for range-bound or chaotic conditions).
Getting Started
//+------------------------------------------------------------------+
//|                                                   Entropy IT.mq5 |
//|                        GIT under Copyright 2025, MetaQuotes Ltd. |
//|                     https://www.mql5.com/en/users/johnhlomohang/ |
//+------------------------------------------------------------------+
#property copyright "GIT under Copyright 2025, MetaQuotes Ltd."
#property link      "https://www.mql5.com/en/users/johnhlomohang/"
#property version   "1.00"
#property description "Market Entropy Indicator – Information Theory Visualization"
#property description "Multi-period signal generation using entropy relationships"
#property description "Features Histogram Compression/Decompression visualization"
#property indicator_separate_window
#property indicator_minimum -0.2
#property indicator_maximum 1.2
#property indicator_buffers 16
#property indicator_plots   10

//--- Entropy Histogram
#property indicator_label1 "Entropy"
#property indicator_type1 DRAW_COLOR_HISTOGRAM
#property indicator_color1 clrGreen,clrYellow,clrRed
#property indicator_width1 2

//--- Smoothed Entropy
#property indicator_label2 "Smoothed Entropy"
#property indicator_type2 DRAW_LINE
#property indicator_color2 clrWhite

//--- Entropy Momentum
#property indicator_label3 "Entropy Momentum"
#property indicator_type3 DRAW_LINE
#property indicator_color3 clrCyan

//--- Fast Entropy (short period)
#property indicator_label4 "Fast Entropy"
#property indicator_type4 DRAW_LINE
#property indicator_color4 clrLime

//--- Slow Entropy (long period)
#property indicator_label5 "Slow Entropy"
#property indicator_type5 DRAW_LINE
#property indicator_color5 clrOrange

//--- Entropy Divergence
#property indicator_label6 "Divergence"
#property indicator_type6 DRAW_LINE
#property indicator_color6 clrMagenta

//--- Compression/Decompression Indicator
#property indicator_label7 "Compress/Decompress"
#property indicator_type7 DRAW_COLOR_HISTOGRAM
#property indicator_color7 clrBlue,clrRed,clrGray
#property indicator_width7 2

//--- Flow Arrows (plot-based)
#property indicator_label8 "Entropy Flow"
#property indicator_type8 DRAW_COLOR_ARROW
#property indicator_color8 clrLime,clrOrange

//--- Shock Marker
#property indicator_label9 "Information Shock"
#property indicator_type9 DRAW_ARROW
#property indicator_color9 clrMagenta

//--- Regime Change Marker
#property indicator_label10 "Regime Shift"
#property indicator_type10 DRAW_ARROW
#property indicator_color10 clrWhite
To get started, we configure the indicator to run in a separate window with a normalized range from -0.2 to 1.2, allowing us to clearly visualize entropy values and their dynamics. We define a total of 16 buffers and 10 plots to support multiple layers of information visualization. The core of the indicator is the entropy histogram, which uses color coding (green, yellow, red) to represent different market regimes, while the smoothed entropy line provides a clearer view of the underlying information trend. We further enhance this by introducing entropy momentum, which captures the rate of change in information, as well as fast and slow entropy lines that allow us to compare short-term and long-term uncertainty in the market.
Building on this foundation, we extend the visualization to capture deeper market behavior through entropy divergence, highlighting differences between fast and slow entropy, and a compression/decompression histogram, which visually distinguishes periods of information buildup versus expansion. To make the indicator more actionable, we include flow arrows that show the direction of entropy change, spikes in randomness, and regime shift markers that signal transitions between structured and chaotic market states.
//--- Inputs
input int      EntropyPeriod      = 50;          // Base entropy period
input int      SmoothingPeriod    = 10;          // Smoothing of entropy line
input int      MomentumPeriod     = 5;           // Momentum period
input int      FastEntropyPeriod  = 20;          // Fast entropy period for signals
input int      SlowEntropyPeriod  = 100;         // Slow entropy period for signals
input int      PriceStep          = 1;           // Minimum price change (points) to classify as move
input double   SignalThreshold    = 0.15;        // Threshold for signal generation
input bool     ShowSignals        = true;        // Draw buy/sell arrows on main chart
input int      SignalArrowOffset  = 15;          // Offset in points for arrow placement
input bool     UseDailyReset      = true;        // Reset entropy calculation daily
input double   CompressionZone    = 0.30;        // Entropy level considered compression zone
input double   DecompressionZone  = 0.50;        // Entropy level considered decompression zone
input int      CompressionBars    = 5;           // Bars to confirm compression/decompression
input int      MinSignalGap       = 10;          // Minimum bars between same signal types

//--- Buffers (for subwindow display)
double entropyBuffer[];
double entropyColors[];
double compressionIndicator[];
double compressionColors[];
double smoothBuffer[];
double momentumBuffer[];
double fastEntropyBuffer[];
double slowEntropyBuffer[];
double divergenceBuffer[];
double flowBuffer[];
double flowColors[];
double shockBuffer[];
double regimeShiftBuffer[];

//--- Signal buffers
double buySignalBuffer[];
double sellSignalBuffer[];

//--- Internal arrays
int states[];                // 0=flat, 1=up, 2=down
int regime[];                // 0=trend, 1=transition, 2=chaotic
int compressionState[];      // -1=compressing, 0=neutral, 1=decompressing

//--- Daily tracking
datetime   currentDay;
int        dailyUp, dailyDown, dailyFlat, dailyBars;
double     prevDailyEntropy;

//--- Multi-period tracking
double     prevFastEntropy, prevSlowEntropy;
double     prevMomentum;

//--- Compression tracking
double     compressionLevel[];
double     decompressionLevel[];

//--- Signal tracking to prevent duplicates
datetime   lastBuySignalTime;
datetime   lastSellSignalTime;
datetime   lastCompressionStartTime;
datetime   lastDecompressionStartTime;
int        lastBuyBar;
int        lastSellBar;
int        lastCompressionBar;
int        lastDecompressionBar;

//--- Chart object prefix
string objPrefix;
Here, we define input parameters that control the behavior of the entropy-based system. The core parameters, such as EntropyPeriod, FastEntropyPeriod, and SlowEntropyPeriod, allow us to measure information across multiple time horizons, while SmoothingPeriod and MomentumPeriod help refine the signal by reducing noise and capturing the speed of information change. We also introduce thresholds like SignalThreshold, CompressionZone, and DecompressionZone to classify market states and trigger meaningful events. Additional controls such as SignalArrowOffset, MinSignalGap, and ShowSignals ensure that visual signals are both clear and not overly frequent, while UseDailyReset allows the indicator to restart entropy calculations each day, making it adaptive to intraday market behavior.
To support this logic, we allocate multiple buffers and internal arrays that handle both visualization and computation. The main buffers (such as entropyBuffer, momentumBuffer, fastEntropyBuffer, and slowEntropyBuffer) store different layers of entropy analysis, while others like compressionIndicator, flowBuffer, and shockBuffer are dedicated to visual cues that highlight market structure changes. Signal buffers (buySignalBuffer and sellSignalBuffer) are used to project trading opportunities onto the chart, while internal arrays like states, regime, and compressionState classify price behavior and market conditions. We also maintain tracking variables for daily statistics, multi-period comparisons, and signal timing to prevent duplication, ensuring that the system remains both efficient and logically consistent as it processes incoming market data.
//+------------------------------------------------------------------+
//|  OnInit                                                          |
//+------------------------------------------------------------------+
int OnInit()
  {
   //--- Bind buffers
   SetIndexBuffer(0, entropyBuffer, INDICATOR_DATA);
   SetIndexBuffer(1, entropyColors, INDICATOR_COLOR_INDEX);
   SetIndexBuffer(2, smoothBuffer, INDICATOR_DATA);
   SetIndexBuffer(3, momentumBuffer, INDICATOR_DATA);
   SetIndexBuffer(4, fastEntropyBuffer, INDICATOR_DATA);
   SetIndexBuffer(5, slowEntropyBuffer, INDICATOR_DATA);
   SetIndexBuffer(6, divergenceBuffer, INDICATOR_DATA);
   SetIndexBuffer(7, compressionIndicator, INDICATOR_DATA);
   SetIndexBuffer(8, compressionColors, INDICATOR_COLOR_INDEX);
   SetIndexBuffer(9, flowBuffer, INDICATOR_DATA);
   SetIndexBuffer(10, flowColors, INDICATOR_COLOR_INDEX);
   SetIndexBuffer(11, shockBuffer, INDICATOR_DATA);
   SetIndexBuffer(12, regimeShiftBuffer, INDICATOR_DATA);
   SetIndexBuffer(13, buySignalBuffer, INDICATOR_DATA);
   SetIndexBuffer(14, sellSignalBuffer, INDICATOR_DATA);

   //--- Set empty value for all plots
   for(int i = 0; i <= 14; i++)
      PlotIndexSetDouble(i, PLOT_EMPTY_VALUE, EMPTY_VALUE);

   //--- Arrow codes for plot-based markers
   PlotIndexSetInteger(8, PLOT_ARROW, 233);        // up/down arrows for flow
   PlotIndexSetInteger(9, PLOT_ARROW, 167);        // lightning
   PlotIndexSetInteger(10, PLOT_ARROW, 159);       // diamond

   //--- Prefix for chart objects
   objPrefix = "MktEntropy_" + IntegerToString(ChartID()) + "_";

   //--- Initialize tracking variables
   currentDay = 0;
   dailyUp = dailyDown = dailyFlat = dailyBars = 0;
   prevDailyEntropy = EMPTY_VALUE;
   prevFastEntropy = prevSlowEntropy = prevMomentum = EMPTY_VALUE;

   //--- Initialize signal tracking
   lastBuySignalTime = 0;
   lastSellSignalTime = 0;
   lastCompressionStartTime = 0;
   lastDecompressionStartTime = 0;
   lastBuyBar = -MinSignalGap;
   lastSellBar = -MinSignalGap;
   lastCompressionBar = -MinSignalGap;
   lastDecompressionBar = -MinSignalGap;

   //--- Initialize compression tracking arrays
   ArrayResize(compressionState, 1);
   ArrayResize(compressionLevel, 1);
   ArrayResize(decompressionLevel, 1);

   return INIT_SUCCEEDED;
  }

//+------------------------------------------------------------------+
//|  OnDeinit                                                        |
//+------------------------------------------------------------------+
void OnDeinit(const int reason)
  {
   ObjectsDeleteAll(0, objPrefix);
  }
In this initialization phase, we bind all required buffers. This ensures that entropy, momentum, divergence, compression states, and trading signals are mapped correctly for calculation and visualization. We also standardize all plots by assigning an empty value to prevent unwanted drawings and define specific arrow codes for visual markers like flow direction, shocks, and regime shifts.
Additionally, we generate a unique object prefix using the chart ID to manage chart objects safely, initialize all tracking variables for daily calculations and multi-period comparisons, and reset signal-related states to avoid duplicate signals. We then prepare dynamic arrays for compression tracking and ensure proper cleanup in the deinitialization step by removing all objects associated with this indicator, keeping the chart environment clean and efficient.
//+------------------------------------------------------------------+
//|  OnCalculate                                                     |
//+------------------------------------------------------------------+
int OnCalculate(const int rates_total,
                const int prev_calculated,
                const datetime &time[],
                const double &open[],
                const double &high[],
                const double &low[],
                const double &close[],
                const long &tick_volume[],
                const long &volume[],
                const int &spread[])
  {
   if(rates_total < SlowEntropyPeriod)
      return 0;

   //--- Ensure arrays are large enough
   ArrayResize(states, rates_total);
   ArrayResize(regime, rates_total);
   ArrayResize(compressionState, rates_total);
   ArrayResize(compressionLevel, rates_total);
   ArrayResize(decompressionLevel, rates_total);

   int start = prev_calculated > 0 ? prev_calculated - 1 : 0;
   if(start < 0)
      start = 0;

   //--- Process bars
   for(int i = start; i < rates_total; i++)
     {
      UpdateDailyReset(i, time);
      ClassifyPriceMovement(i, close, time);
      CalculateAllEntropy(i);
      CalculateDivergenceAndMomentum(i);
      DetectCompression(i);

      if(ShowSignals)
        {
         DrawCompressionArrows(i, time, high, low);
         DrawTradingSignal(i, time, high, low);
        }

      UpdateMarkers(i);
      CalculateSmoothedEntropy(i);
     }

   UpdateRegimeLabel(time, rates_total);

   return rates_total;
  }

//+------------------------------------------------------------------+
//|  Update daily reset and manage signal timers                     |
//+------------------------------------------------------------------+
void UpdateDailyReset(int i, const datetime &time[])
  {
   if(!UseDailyReset)
      return;

   MqlDateTime dt;
   TimeToStruct(time[i], dt);
   datetime barDate = dt.year * 10000 + dt.mon * 100 + dt.day;

   if(barDate != currentDay)
     {
      currentDay = barDate;
      dailyUp = dailyDown = dailyFlat = dailyBars = 0;
      prevDailyEntropy = EMPTY_VALUE;

      if(ShowSignals)
        {
         ObjectsDeleteAll(0, objPrefix);
         ResetSignalTimers();
        }
     }
  }

//+------------------------------------------------------------------+
//|  Reset all signal timers                                         |
//+------------------------------------------------------------------+
void ResetSignalTimers()
  {
   lastBuySignalTime = 0;
   lastSellSignalTime = 0;
   lastCompressionStartTime = 0;
   lastDecompressionStartTime = 0;
   lastBuyBar = -MinSignalGap;
   lastSellBar = -MinSignalGap;
   lastCompressionBar = -MinSignalGap;
   lastDecompressionBar = -MinSignalGap;
  }
We structure the main calculation loop to process market data efficiently by first ensuring there are enough bars for meaningful entropy analysis, then dynamically resizing all working arrays to match the incoming data. From the calculated starting point, we iterate through each bar and apply a sequence of modular functions that break down the logic into clear steps: resetting daily statistics when needed, classifying price movements into states, computing entropy across multiple periods, and deriving higher-level features such as momentum and divergence. We also detect compression phases and, when enabled, render visual signals like arrows for compression events and trading opportunities. Finally, we update visual markers and compute a smoothed entropy line to maintain a clean and interpretable representation of the market’s informational structure.
Alongside this, we implement a daily reset mechanism to ensure the indicator adapts to intraday conditions by clearing accumulated statistics and resetting entropy tracking at the start of each new trading day. This process also removes previously drawn chart objects and resets all signal timers to prevent outdated or duplicate signals from persisting across sessions. The dedicated reset function centralizes the clearing of all timing and bar-tracking variables, ensuring consistency and stability in signal generation.
//+------------------------------------------------------------------+
//|  Classify price movement into states (up/down/flat)              |
//+------------------------------------------------------------------+
void ClassifyPriceMovement(int i, const double &close[], const datetime &time[])
  {
   if(i == 0)
     {
      states[i] = 0;
      return;
     }

   double change = close[i] - close[i-1];
   double threshold = PriceStep * _Point;

   if(change > threshold)
      states[i] = 1;   // up
   else
      if(change < -threshold)
         states[i] = 2;   // down
      else
         states[i] = 0;   // flat

   if(UseDailyReset && time[i] >= time[i-1])
     {
      if(states[i] == 1)
         dailyUp++;
      else
         if(states[i] == 2)
            dailyDown++;
         else
            dailyFlat++;
      dailyBars++;
     }
  }

//+------------------------------------------------------------------+
//|  Calculate entropy for a given period                            |
//+------------------------------------------------------------------+
double CalculateEntropy(int startIdx, int period, const int &statesArray[])
  {
   int up = 0, down = 0, flat = 0;
   for(int j = startIdx - period; j < startIdx; j++)
     {
      if(statesArray[j] == 1)
         up++;
      else
         if(statesArray[j] == 2)
            down++;
         else
            flat++;
     }

   double p_up = (double)up / period;
   double p_down = (double)down / period;
   double p_flat = (double)flat / period;

   double entropy = 0.0;
   if(p_up > 0)
      entropy -= p_up * MathLog(p_up) / M_LN2;
   if(p_down > 0)
      entropy -= p_down * MathLog(p_down) / M_LN2;
   if(p_flat > 0)
      entropy -= p_flat * MathLog(p_flat) / M_LN2;

   return entropy / (MathLog(3) / M_LN2);  // Normalized entropy
  }
In this code section, we transform raw price data into a simplified state-based representation, where each bar is classified as an upward move, downward move, or flat movement. This is done by comparing the current close price to the previous one and applying a threshold to filter out insignificant noise. By doing this, we convert continuous price fluctuations into discrete states (0, 1, 2), which is essential for entropy calculation. At the same time, when daily reset is enabled, we keep track of how many upward, downward, and flat movements occur within the day, allowing us to build a running profile of market behavior and maintain a structured count of price activity over time.
Once price movements are classified, we use this state data to compute entropy over a specified period by counting how frequently each state occurs within a rolling window. These counts are converted into probabilities, which are then applied to the entropy formula to measure the level of uncertainty in the market. The calculation ensures that only valid probabilities contribute to the result, and finally normalizes the entropy so that it remains between 0 and 1. This normalized value becomes a powerful measure of market structure, where lower values indicate more predictable behavior and higher values reflect increasing randomness or disorder.
//+------------------------------------------------------------------+
//|  Calculate fast, slow, and base entropy                          |
//+------------------------------------------------------------------+
void CalculateAllEntropy(int i)
  {
   //--- Fast entropy
   if(i >= FastEntropyPeriod)
      fastEntropyBuffer[i] = CalculateEntropy(i, FastEntropyPeriod, states);
   else
      fastEntropyBuffer[i] = EMPTY_VALUE;

   //--- Slow entropy
   if(i >= SlowEntropyPeriod)
      slowEntropyBuffer[i] = CalculateEntropy(i, SlowEntropyPeriod, states);
   else
      slowEntropyBuffer[i] = EMPTY_VALUE;

   //--- Base entropy
   if(i >= EntropyPeriod)
     {
      entropyBuffer[i] = CalculateEntropy(i, EntropyPeriod, states);
      ClassifyRegime(i);
     }
   else
     {
      entropyBuffer[i] = EMPTY_VALUE;
      regime[i] = -1;
     }
  }

//+------------------------------------------------------------------+
//|  Classify market regime based on entropy value                   |
//+------------------------------------------------------------------+
void ClassifyRegime(int i)
  {
   if(entropyBuffer[i] < 0.35)
     {
      entropyColors[i] = 0;
      regime[i] = 0;  // trend
     }
   else
      if(entropyBuffer[i] < 0.65)
        {
         entropyColors[i] = 1;
         regime[i] = 1;  // transition
        }
      else
        {
         entropyColors[i] = 2;
         regime[i] = 2;  // chaotic
        }
  }
Here, we compute entropy across multiple time horizons to capture both short-term and long-term market behavior, while also establishing a core baseline for analysis. The fast and slow entropy values are calculated only when sufficient data is available, ensuring accuracy and preventing invalid calculations, and are stored in their respective buffers for later comparison. The base entropy, which serves as the primary measure of market uncertainty, is then computed using the main period and immediately passed into a classification step. If there is not enough data, the buffers are safely assigned empty values and the regime is marked as undefined, maintaining data integrity throughout the process.
We then classify the market into distinct regimes based on the normalized entropy value, effectively translating numerical uncertainty into meaningful market states. When entropy is low, the market is labeled as trending and assigned a corresponding color, indicating structured and predictable behavior. As entropy increases, the market transitions into a mixed state and eventually into a chaotic regime, where randomness dominates. This classification not only drives the visual representation through color coding but also provides a foundational layer for higher-level analysis, allowing the indicator to interpret and communicate the underlying informational state of the market in a clear and actionable way.
//+------------------------------------------------------------------+
//|  Calculate divergence and momentum                               |
//+------------------------------------------------------------------+
void CalculateDivergenceAndMomentum(int i)
  {
   //--- Divergence (fast - slow)
   if(fastEntropyBuffer[i] != EMPTY_VALUE && slowEntropyBuffer[i] != EMPTY_VALUE)
      divergenceBuffer[i] = fastEntropyBuffer[i] - slowEntropyBuffer[i];
   else
      divergenceBuffer[i] = EMPTY_VALUE;

   //--- Momentum
   if(i >= EntropyPeriod + MomentumPeriod &&
      entropyBuffer[i] != EMPTY_VALUE &&
      entropyBuffer[i - MomentumPeriod] != EMPTY_VALUE)
      momentumBuffer[i] = entropyBuffer[i] - entropyBuffer[i - MomentumPeriod];
   else
      momentumBuffer[i] = EMPTY_VALUE;
  }

//+------------------------------------------------------------------+
//|  Detect compression/decompression states                         |
//+------------------------------------------------------------------+
void DetectCompression(int i)
  {
   if(entropyBuffer[i] == EMPTY_VALUE)
     {
      compressionIndicator[i] = EMPTY_VALUE;
      return;
     }

   //--- Track levels
   compressionLevel[i] = entropyBuffer[i];
   decompressionLevel[i] = entropyBuffer[i];

   //--- Find local minima for compression
   if(i >= CompressionBars)
     {
      compressionLevel[i] = entropyBuffer[i];
      for(int j = i - CompressionBars; j <= i; j++)
        {
         if(entropyBuffer[j] != EMPTY_VALUE && entropyBuffer[j] < compressionLevel[i])
            compressionLevel[i] = entropyBuffer[j];
        }
     }

   //--- Find local maxima for decompression
   if(i >= CompressionBars)
     {
      decompressionLevel[i] = entropyBuffer[i];
      for(int j = i - CompressionBars; j <= i; j++)
        {
         if(entropyBuffer[j] != EMPTY_VALUE && entropyBuffer[j] > decompressionLevel[i])
            decompressionLevel[i] = entropyBuffer[j];
        }
     }

   //--- Determine state
   compressionState[i] = 0;  // neutral

   if(i > 0 && entropyBuffer[i-1] != EMPTY_VALUE)
     {
      if(entropyBuffer[i] < entropyBuffer[i-1] && entropyBuffer[i] < CompressionZone)
         compressionState[i] = -1;  // compressing
      else
         if(entropyBuffer[i] > entropyBuffer[i-1] && entropyBuffer[i] > DecompressionZone)
            compressionState[i] = 1;   // decompressing
     }

   //--- Set indicator buffer and colors
   if(compressionState[i] == -1)
     {
      compressionIndicator[i] = entropyBuffer[i];
      compressionColors[i] = 0;  // Blue
     }
   else
      if(compressionState[i] == 1)
        {
         compressionIndicator[i] = entropyBuffer[i];
         compressionColors[i] = 1;  // Red
        }
      else
         if(compressionState[i] == 0 && entropyBuffer[i] < CompressionZone)
           {
            compressionIndicator[i] = entropyBuffer[i];
            compressionColors[i] = 2;  // Gray
           }
         else
           {
            compressionIndicator[i] = EMPTY_VALUE;
           }
  }
In this code section, we derive higher-level insights from the entropy data by calculating both divergence and momentum, which help us understand how information is evolving across different time scales. Divergence is computed as the difference between fast and slow entropy, highlighting whether short-term market behavior is deviating from the long-term structure, while momentum measures the rate of change in entropy over a defined period, indicating whether the market is becoming more ordered or more chaotic. Alongside this, we implement a compression and decompression detection mechanism by scanning recent entropy values to identify local minima and maxima, effectively capturing zones where information is either contracting (building up) or expanding.
We then translate these observations into actionable states by classifying each bar as compressing, decompressing, or neutral based on both the direction of entropy change and predefined threshold zones. When entropy is decreasing and below the compression threshold, the market is considered to be compressing, signaling potential buildup before a move, whereas increasing entropy above the decompression threshold indicates expansion and rising disorder. These states are then visualized using a color-coded histogram, where different colors represent compression, decompression, or low-activity conditions, allowing us to clearly see how information density shifts over time and identify key phases in the market’s structural cycle.
//+------------------------------------------------------------------+
//|  Draw compression/decompression circles                          |
//+------------------------------------------------------------------+
void DrawCompressionArrows(int i, const datetime &time[], const double &high[], const double &low[])
  {
   if(!ShowSignals || i == 0 || compressionState[i] == 0)
      return;

   //--- Compression start
   if(compressionState[i] == -1 && compressionState[i-1] != -1)
     {
      if(i - lastCompressionBar >= MinSignalGap &&
         (lastCompressionStartTime == 0 || time[i] - lastCompressionStartTime > MinSignalGap * PeriodSeconds()))
        {
         double arrowY = low[i] - SignalArrowOffset * _Point * 2;
         string objName = objPrefix + "compress_" + IntegerToString(i);

         ObjectDelete(0, objName);

         if(ObjectCreate(0, objName, OBJ_ARROW, 0, time[i], arrowY))
           {
            ObjectSetInteger(0, objName, OBJPROP_ARROWCODE, 108);
            ObjectSetInteger(0, objName, OBJPROP_COLOR, clrBlue);
            ObjectSetInteger(0, objName, OBJPROP_WIDTH, 2);
            ObjectSetInteger(0, objName, OBJPROP_BACK, false);
            ObjectSetInteger(0, objName, OBJPROP_SELECTABLE, false);
            ObjectSetInteger(0, objName, OBJPROP_HIDDEN, true);

            lastCompressionStartTime = time[i];
            lastCompressionBar = i;
           }
        }
     }
   //--- Decompression start
   else
      if(compressionState[i] == 1 && compressionState[i-1] != 1)
        {
         if(i - lastDecompressionBar >= MinSignalGap &&
            (lastDecompressionStartTime == 0 || time[i] - lastDecompressionStartTime > MinSignalGap * PeriodSeconds()))
           {
            double arrowY = high[i] + SignalArrowOffset * _Point * 2;
            string objName = objPrefix + "decompress_" + IntegerToString(i);

            ObjectDelete(0, objName);

            if(ObjectCreate(0, objName, OBJ_ARROW, 0, time[i], arrowY))
              {
               ObjectSetInteger(0, objName, OBJPROP_ARROWCODE, 108);
               ObjectSetInteger(0, objName, OBJPROP_COLOR, clrOrange);
               ObjectSetInteger(0, objName, OBJPROP_WIDTH, 2);
               ObjectSetInteger(0, objName, OBJPROP_BACK, false);
               ObjectSetInteger(0, objName, OBJPROP_SELECTABLE, false);
               ObjectSetInteger(0, objName, OBJPROP_HIDDEN, true);

               lastDecompressionStartTime = time[i];
               lastDecompressionBar = i;
              }
           }
        }
  }

//+------------------------------------------------------------------+
//|  Check buy signal conditions                                     |
//+------------------------------------------------------------------+
bool IsBuySignal(int i)
  {
   bool buyCondition1 = (fastEntropyBuffer[i] > slowEntropyBuffer[i] &&
                         fastEntropyBuffer[i-1] <= slowEntropyBuffer[i-1]);

   bool buyCondition2 = (entropyBuffer[i] < 0.65);

   bool buyCondition3 = (momentumBuffer[i] > 0 && momentumBuffer[i] > momentumBuffer[i-1]);

   bool buyCondition4 = (divergenceBuffer[i] > -SignalThreshold);

   bool buyCondition5 = (regime[i] != 2);

   bool buyCondition6 = (compressionState[i] == 1 &&
                         entropyBuffer[i] > 0.25 && entropyBuffer[i] < 0.45);

   bool buyCondition7 = (compressionState[i-1] == -1 && compressionState[i] != -1 &&
                         momentumBuffer[i] > 0);

   return ((buyCondition1 && buyCondition2 && buyCondition3 && buyCondition4) ||
           buyCondition6 || buyCondition7);
  }

//+------------------------------------------------------------------+
//|  Check sell signal conditions                                    |
//+------------------------------------------------------------------+
bool IsSellSignal(int i)
  {
   bool sellCondition1 = (fastEntropyBuffer[i] < slowEntropyBuffer[i] &&
                          fastEntropyBuffer[i-1] >= slowEntropyBuffer[i-1]);

   bool sellCondition2 = (entropyBuffer[i] > 0.55);

   bool sellCondition3 = (momentumBuffer[i] < 0 && momentumBuffer[i] < momentumBuffer[i-1]);

   bool sellCondition4 = (divergenceBuffer[i] < SignalThreshold);

   bool sellCondition5 = (regime[i] == 2 && regime[i-1] != 2);

   bool sellCondition6 = (divergenceBuffer[i] < -SignalThreshold &&
                          MathAbs(divergenceBuffer[i]) > MathAbs(divergenceBuffer[i-1]));

   bool sellCondition7 = (compressionState[i-1] == 1 && compressionState[i] != 1 &&
                          momentumBuffer[i] < 0);

   return ((sellCondition1 && sellCondition2 && sellCondition3) ||
           sellCondition5 || sellCondition6 || sellCondition7);
  }
In the DrawCompressionArrows function, we visualize key structural events in the market by drawing markers that mark the beginning of compression and decompression phases. When the system detects a transition into compression (decreasing entropy), it places a circular blue marker below the candlestick, signaling that the market is entering a phase of information buildup. Conversely, when decompression begins (increasing entropy), an orange marker is drawn above the candlestick to indicate the start of expansion or release of information. To maintain clarity and avoid clutter, we enforce spacing rules using time and bar gaps, ensuring that signals are not duplicated too frequently, while also managing chart objects dynamically through unique naming and controlled deletion.
Building on these visual cues, we define structured conditions for generating buy and sell signals based on the interaction of entropy across multiple dimensions. Buy signals are triggered when short-term entropy overtakes long-term entropy, momentum is strengthening, and the market is not in a chaotic regime, with additional emphasis on transitions from compression to expansion. Sell signals, on the other hand, are generated when the opposite conditions occur—such as weakening momentum, increasing disorder, or transitions into chaotic states—along with strong divergence shifts and breakdowns from expansion phases.
//+------------------------------------------------------------------+
//|  Draw buy/sell arrows                                            |
//+------------------------------------------------------------------+
void DrawTradingSignal(int i, const datetime &time[], const double &high[], const double &low[])
  {
   if(!ShowSignals || i < SlowEntropyPeriod ||
      fastEntropyBuffer[i] == EMPTY_VALUE || slowEntropyBuffer[i] == EMPTY_VALUE ||
      entropyBuffer[i] == EMPTY_VALUE || momentumBuffer[i] == EMPTY_VALUE)
      return;

   //--- Buy signal
   if(IsBuySignal(i))
     {
      if(i - lastBuyBar >= MinSignalGap &&
         (lastBuySignalTime == 0 || time[i] - lastBuySignalTime > MinSignalGap * PeriodSeconds()))
        {
         double arrowY = low[i] - SignalArrowOffset * _Point;
         string objName = objPrefix + "buy_" + IntegerToString(i);

         ObjectDelete(0, objName);

         if(ObjectCreate(0, objName, OBJ_ARROW, 0, time[i], arrowY))
           {
            ObjectSetInteger(0, objName, OBJPROP_ARROWCODE, 233);
            ObjectSetInteger(0, objName, OBJPROP_COLOR, clrGreen);
            ObjectSetInteger(0, objName, OBJPROP_WIDTH, 2);
            ObjectSetInteger(0, objName, OBJPROP_BACK, false);
            ObjectSetInteger(0, objName, OBJPROP_SELECTABLE, false);
            ObjectSetInteger(0, objName, OBJPROP_HIDDEN, true);

            buySignalBuffer[i] = low[i] - SignalArrowOffset * _Point;
            lastBuySignalTime = time[i];
            lastBuyBar = i;
           }
        }
     }

   //--- Sell signal
   if(IsSellSignal(i))
     {
      if(i - lastSellBar >= MinSignalGap &&
         (lastSellSignalTime == 0 || time[i] - lastSellSignalTime > MinSignalGap * PeriodSeconds()))
        {
         double arrowY = high[i] + SignalArrowOffset * _Point;
         string objName = objPrefix + "sell_" + IntegerToString(i);

         ObjectDelete(0, objName);

         if(ObjectCreate(0, objName, OBJ_ARROW, 0, time[i], arrowY))
           {
            ObjectSetInteger(0, objName, OBJPROP_ARROWCODE, 234);
            ObjectSetInteger(0, objName, OBJPROP_COLOR, clrRed);
            ObjectSetInteger(0, objName, OBJPROP_WIDTH, 2);
            ObjectSetInteger(0, objName, OBJPROP_ANCHOR, ANCHOR_BOTTOM);
            ObjectSetInteger(0, objName, OBJPROP_BACK, false);
            ObjectSetInteger(0, objName, OBJPROP_SELECTABLE, false);
            ObjectSetInteger(0, objName, OBJPROP_HIDDEN, true);

            sellSignalBuffer[i] = high[i] + SignalArrowOffset * _Point;
            lastSellSignalTime = time[i];
            lastSellBar = i;
           }
        }
     }
  }

//+------------------------------------------------------------------+
//|  Update flow arrows, shock, and regime shift markers             |
//+------------------------------------------------------------------+
void UpdateMarkers(int i)
  {
   //--- Flow arrows
   if(i > 0 && entropyBuffer[i] != EMPTY_VALUE && entropyBuffer[i-1] != EMPTY_VALUE)
     {
      double delta = entropyBuffer[i] - entropyBuffer[i-1];
      if(delta > 0.03)
        {
         flowBuffer[i] = 1.05;
         flowColors[i] = 0;
        }
      else
         if(delta < -0.03)
           {
            flowBuffer[i] = -0.05;
            flowColors[i] = 1;
           }
         else
            flowBuffer[i] = EMPTY_VALUE;
     }

   //--- Information shock
   if(i > 0 && entropyBuffer[i] != EMPTY_VALUE && entropyBuffer[i-1] != EMPTY_VALUE)
     {
      if(entropyBuffer[i] > entropyBuffer[i-1] * 1.25)
         shockBuffer[i] = 1.1;
      else
         shockBuffer[i] = EMPTY_VALUE;
     }

   //--- Regime shifts
   if(i > 0 && regime[i] != -1 && regime[i-1] != -1 && regime[i] != regime[i-1])
      regimeShiftBuffer[i] = 0.9;
   else
      regimeShiftBuffer[i] = EMPTY_VALUE;
  }
This code translates the entropy model outputs into visual signals on the chart. The DrawTradingSignal function evaluates whether valid buy or sell conditions are met using precomputed entropy, momentum, and divergence data. When a buy signal is confirmed, a green upward arrow is plotted below the candle, while a sell signal produces a red downward arrow above the candle. To maintain signal quality and avoid overplotting, the function enforces spacing constraints using both bar index gaps and time delays, ensuring that signals are not repeatedly triggered in close succession. Additionally, each signal is stored in its respective buffer and tracked using timestamps and bar indices, allowing for consistent state management and preventing duplicate entries.
The UpdateMarkers function enhances the visualization layer by providing more profound insight into how market information evolves. It tracks the rate of change in entropy to display “flow” arrows, indicating whether uncertainty is increasing or decreasing, which helps traders understand the directional pressure of information. It also detects sudden spikes in entropy, marking them as “information shocks,” which often precede volatile market moves. Finally, it identifies regime shifts—transitions between trending, transitional, and chaotic states—and marks them visually, allowing traders to quickly recognize structural changes in market behavior.
//+------------------------------------------------------------------+
//|  Calculate smoothed entropy                                      |
//+------------------------------------------------------------------+
void CalculateSmoothedEntropy(int i)
  {
   if(i < SmoothingPeriod)
     {
      smoothBuffer[i] = EMPTY_VALUE;
      return;
     }

   double sum = 0.0;
   int cnt = 0;
   for(int j = i - SmoothingPeriod + 1; j <= i; j++)
     {
      if(entropyBuffer[j] != EMPTY_VALUE)
        {
         sum += entropyBuffer[j];
         cnt++;
        }
     }
   smoothBuffer[i] = (cnt > 0) ? sum / cnt : EMPTY_VALUE;
  }

//+------------------------------------------------------------------+
//|  Update regime label                                             |
//+------------------------------------------------------------------+
void UpdateRegimeLabel(const datetime &time[], int rates_total)
  {
   string labelText = "";
   color labelColor = clrNONE;
   double lastEntropy = entropyBuffer[rates_total-1];
   double lastFast = fastEntropyBuffer[rates_total-1];
   double lastSlow = slowEntropyBuffer[rates_total-1];
   double lastDiv = divergenceBuffer[rates_total-1];
   int lastCompress = (rates_total-1 >= 0) ? compressionState[rates_total-1] : 0;

   if(lastEntropy != EMPTY_VALUE)
     {
      if(lastEntropy < 0.35)
         labelText = "TREND MODE  (" + DoubleToString(lastEntropy, 2) + ")";
      else
         if(lastEntropy < 0.65)
            labelText = "TRANSITION MODE  (" + DoubleToString(lastEntropy, 2) + ")";
         else
            labelText = "CHAOTIC MODE  (" + DoubleToString(lastEntropy, 2) + ")";

      if(lastCompress == -1)
         labelText += " | COMPRESSING";
      else
         if(lastCompress == 1)
            labelText += " | DECOMPRESSING";

      if(lastDiv != EMPTY_VALUE)
        {
         labelText += " | Div: " + DoubleToString(lastDiv, 2);
         if(lastFast != EMPTY_VALUE && lastSlow != EMPTY_VALUE)
           {
            if(lastFast > lastSlow)
               labelText += " (Bull)";
            else
               labelText += " (Bear)";
           }
        }

      labelColor = (lastEntropy < 0.35) ? clrGreen : (lastEntropy < 0.65) ? clrYellow : clrRed;
     }
   else
     {
      labelText = "MODE: WAITING FOR DATA";
      labelColor = clrGray;
     }

   ObjectCreate(0, objPrefix + "regimeLabel", OBJ_LABEL, 0, 0, 0);
   ObjectSetInteger(0, objPrefix + "regimeLabel", OBJPROP_XDISTANCE, 10);
   ObjectSetInteger(0, objPrefix + "regimeLabel", OBJPROP_YDISTANCE, 10);
   ObjectSetInteger(0, objPrefix + "regimeLabel", OBJPROP_CORNER, 0);
   ObjectSetString(0, objPrefix + "regimeLabel", OBJPROP_TEXT, labelText);
   ObjectSetInteger(0, objPrefix + "regimeLabel", OBJPROP_COLOR, labelColor);
   ObjectSetInteger(0, objPrefix + "regimeLabel", OBJPROP_FONTSIZE, 11);
   ObjectSetInteger(0, objPrefix + "regimeLabel", OBJPROP_BACK, false);
  }
//+------------------------------------------------------------------+
This portion of the code focuses on refining the raw entropy readings to make them more actionable and visually interpretable. The CalculateSmoothedEntropy function applies a simple moving average over a defined SmoothingPeriod to the base entropy values, reducing noise and short-term fluctuations. By averaging only valid entropy values within the period, it ensures that the smoothed line accurately reflects the underlying trend in market uncertainty. This helps traders better identify persistent regimes or shifts, rather than reacting to every small fluctuation in the raw entropy.
The UpdateRegimeLabel function builds on this by summarizing the current market state in a single, easy-to-read chart label. It evaluates the most recent entropy, fast/slow entropy, divergence, and compression state to determine whether the market is in a trend, transition, or chaotic mode, and whether it is compressing or decompressing. The label also indicates bullish or bearish tendencies based on the fast vs. slow entropy comparison and includes numeric values for quick reference. By dynamically updating the label’s text and color, this function provides traders with an at-a-glance snapshot of market conditions, combining multiple entropy-based metrics into a concise visual summary.
Indicator Demo
To demonstrate the effectiveness of this indicator, we used the default settings and conducted testing on the XAUUSD H1 timeframe, allowing us to clearly observe how entropy-driven signals behave in a structured market environment. However, the indicator is highly flexible and not limited to a single instrument or timeframe—it can be applied to any chart symbol of your choice, adapting dynamically to different market conditions.
In terms of practical usage, simple trade rules can be defined as follows: trade only when the market is in trend or transition mode with supportive momentum and divergence, and avoid trading during chaotic conditions. For example, buy trades are favored when fast entropy crosses above slow entropy with positive momentum and decompression, while sell trades are favored when the opposite occurs alongside increasing disorder. On the other hand, do not trade when entropy is high (chaotic mode), as this eliminates false breakout entries and erratic price behavior; similarly, compression zones help avoid premature entries, reducing the risk of entering before a breakout occurs. Specifically, trend mode helps eliminate false reversals, transition mode filters out weak continuation signals, and chaotic mode prevents trades during high randomness.
Conclusion
This work converts the abstract idea "markets are more or less random" into a concrete, implementable framework and practical MQL5 artifact. By discretizing bars, calculating normalized Shannon entropy, and applying well-defined thresholds (for example, entropy < 0.35 → TREND, 0.35–0.65 → TRANSITION, > 0.65 → CHAOTIC), the indicator gives you deterministic regime labels rather than vague impressions. Added layers—fast vs. slow entropy, entropy momentum, divergence, and local compression/decompression—help detect structural build-up, breakouts, and sudden information shocks.
Practically, after reading and using this indicator, you will be able to:
- mark market mode (TREND/TRANSITION/CHAOTIC) and use it as a trading filter;
- detect compression (low entropy) and decompression (rising entropy) as setup and breakdown cues;
- generate and sparsify buy/sell signals via fast/slow crossings plus momentum/divergence checks;
- flag information shocks and regime shifts for risk control or automated halting of trades.
In short, integrating entropy into your system shifts decision-making from reactive price-chasing to proactive information analysis—reducing false entries, improving timing, and providing a verifiable, code-ready filter that can be incorporated into MQL5 strategies and risk management workflows.
Warning: All rights to these materials are reserved by MetaQuotes Ltd. Copying or reprinting of these materials in whole or in part is prohibited.
This article was written by a user of the site and reflects their personal views. MetaQuotes Ltd is not responsible for the accuracy of the information presented, nor for any consequences resulting from the use of the solutions, strategies or recommendations described.

- Free trading apps
- Over 8,000 signals for copying
- Economic news for exploring financial markets
You agree to website policy and terms of use