
Price Action Analysis Toolkit Development (Part 68): Price-Attached RSI Panel in MQL5

Introduction
Traders and MQL5 developers frequently use RSI to confirm price action, yet its standard placement in a separate subwindow disrupts the critical point of decision. The need to shift focus away from the price chart introduces a delay in interpretation, which becomes costly in fast-paced environments such as scalping, manual trade management, or high-frequency setups. This article addresses a clear objective: to design an RSI representation that remains aligned with the current price level, updates in real time, and adapts automatically to chart interactions such as scrolling, zooming, and timeframe changes.
To achieve this, the article introduces a compact RSI panel embedded directly on the chart. Positioned at the active price level, the panel displays three key elements at the moment of decision: the current RSI value, its categorical state (OVERBOUGHT, OVERSOLD, or NEUTRAL), and signal strength (WEAK, STRONG, or EXTREME), with optional anchoring to either Bid or Ask. The implementation is built around practical constraints, including continuous tick-based updates, accurate coordinate transformation using ChartTimePriceToXY, boundary control to prevent off-screen rendering, and slope-based classification for momentum evaluation. The result is a responsive, chart-integrated RSI component that keeps confirmation within immediate view while offering a structured foundation for further development.
The article begins with the system design, followed by the MQL5 implementation, and concludes with observed outcomes and key insights. The structure of the article is outlined in the table of contents below.
Design Overview
The Relative Strength Index (RSI) is a momentum oscillator that measures the magnitude of recent price movements on a 0–100 scale. It is commonly used to identify overbought and oversold conditions, typically above 70 and below 30, as well as to confirm potential reversals, continuations, and divergence within price action. In practice, RSI acts as a confirmation layer, validating whether price movements are supported by momentum.
The RSI tool is designed as a floating interface attached directly to live price, ensuring that RSI insights remain within the trader’s immediate focus area at all times. Instead of separating momentum analysis into a different window, this design brings RSI into the same visual space where price action is interpreted. By keeping RSI within the price context, the design removes the need for attention shifts and preserves analysis continuity.

Figure 1: Traditional RSI Window
In the traditional approach, the RSI is displayed in a separate panel below the main price chart. Traders must constantly shift their focus between price action and the RSI window to interpret momentum. This separation can introduce delays, reduce clarity, and occasionally lead to missed trading opportunities. The chart-embedded panel solves this by bringing RSI insights directly to the price level.
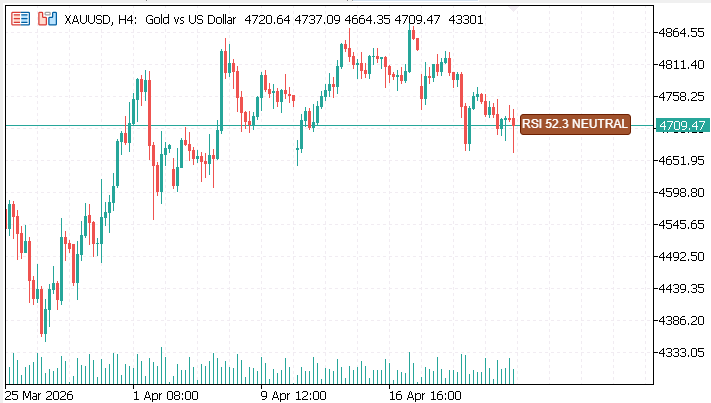
Figure 2: Chart-Embedded RSI Panel
This tool is anchored directly to the current price, providing real-time momentum insights at the point of decision. It displays a three-layer system: the numeric RSI value, the state (overbought, oversold, or neutral), and signal strength (weak, strong, or extreme). A directional arrow points to the price, and color-coded text allows instant recognition. Adaptive positioning ensures the panel remains fully visible, even when the chart is resized or when price moves near the edges.
Core Components 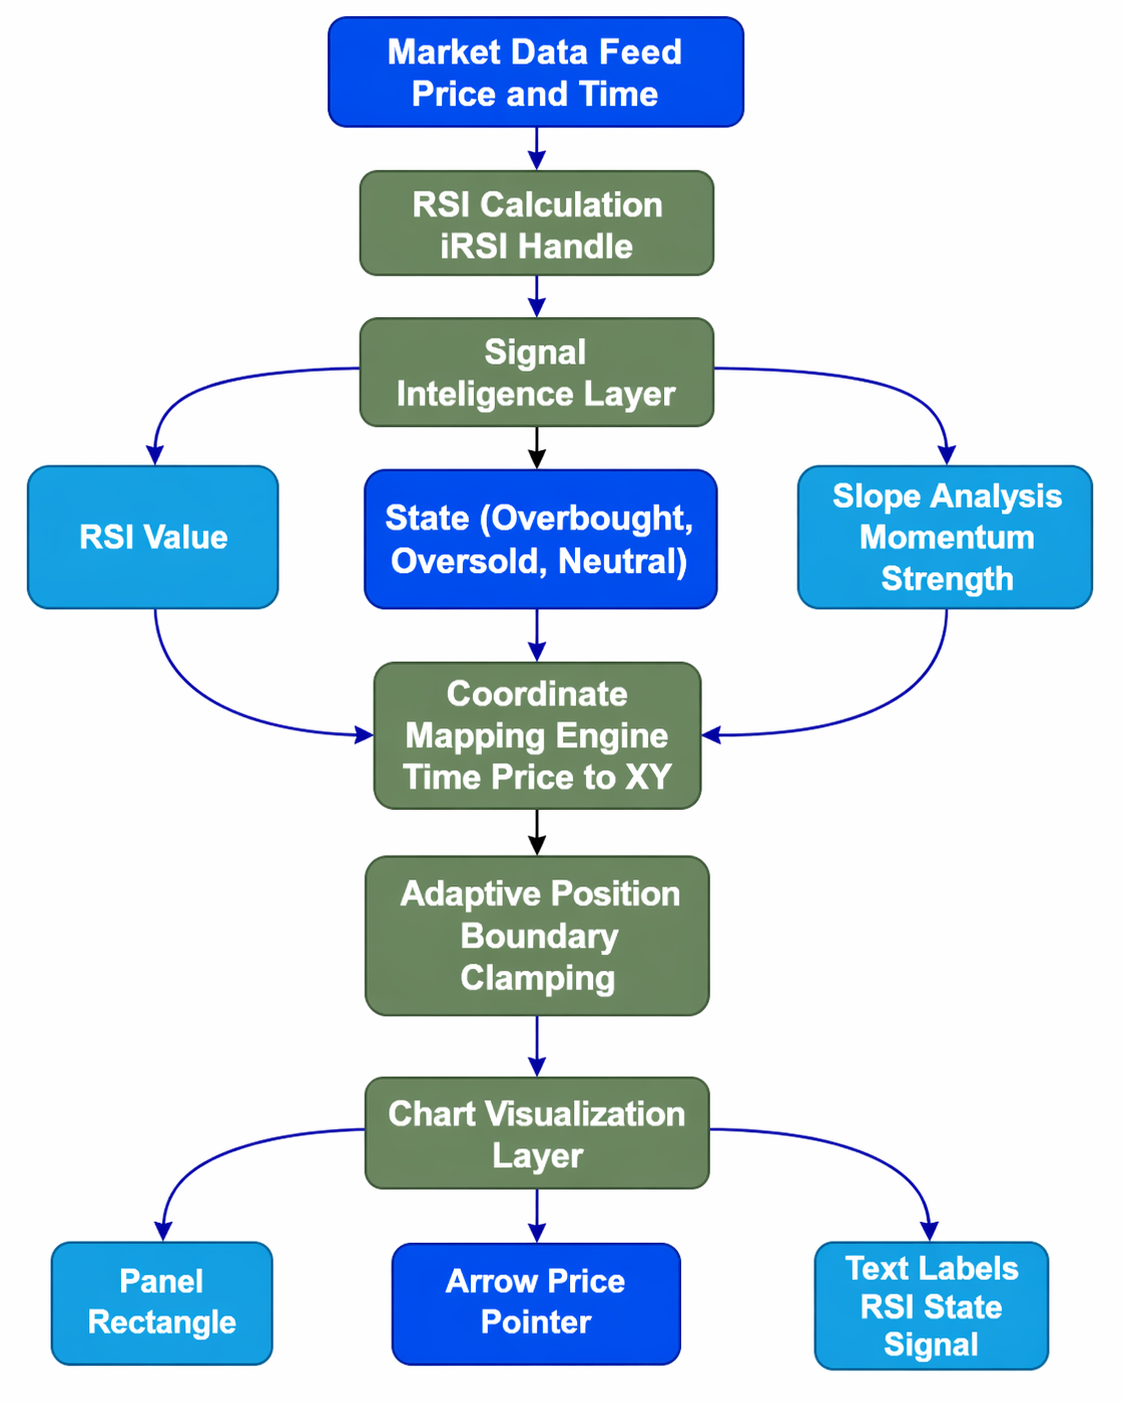
Figure 3: System Flow Architecture
The system is built around the following core components:
1. Dynamic Price Anchoring
The system anchors the panel directly to the current price. This is achieved through chart coordinate mapping, where time and price values are translated into screen positions. As the price moves, the panel follows in real time and maintains a fixed offset relative to the current price. As a result, RSI data is not just visible, but also contextually relevant, always aligned with the most recent price action. Such behavior reinforces the idea that momentum should be interpreted at the point of decision, not separately.
2. Three-Layer Information System
To balance simplicity with functionality, the panel presents information in three structured layers. Each layer serves a distinct purpose while contributing to a unified interpretation.
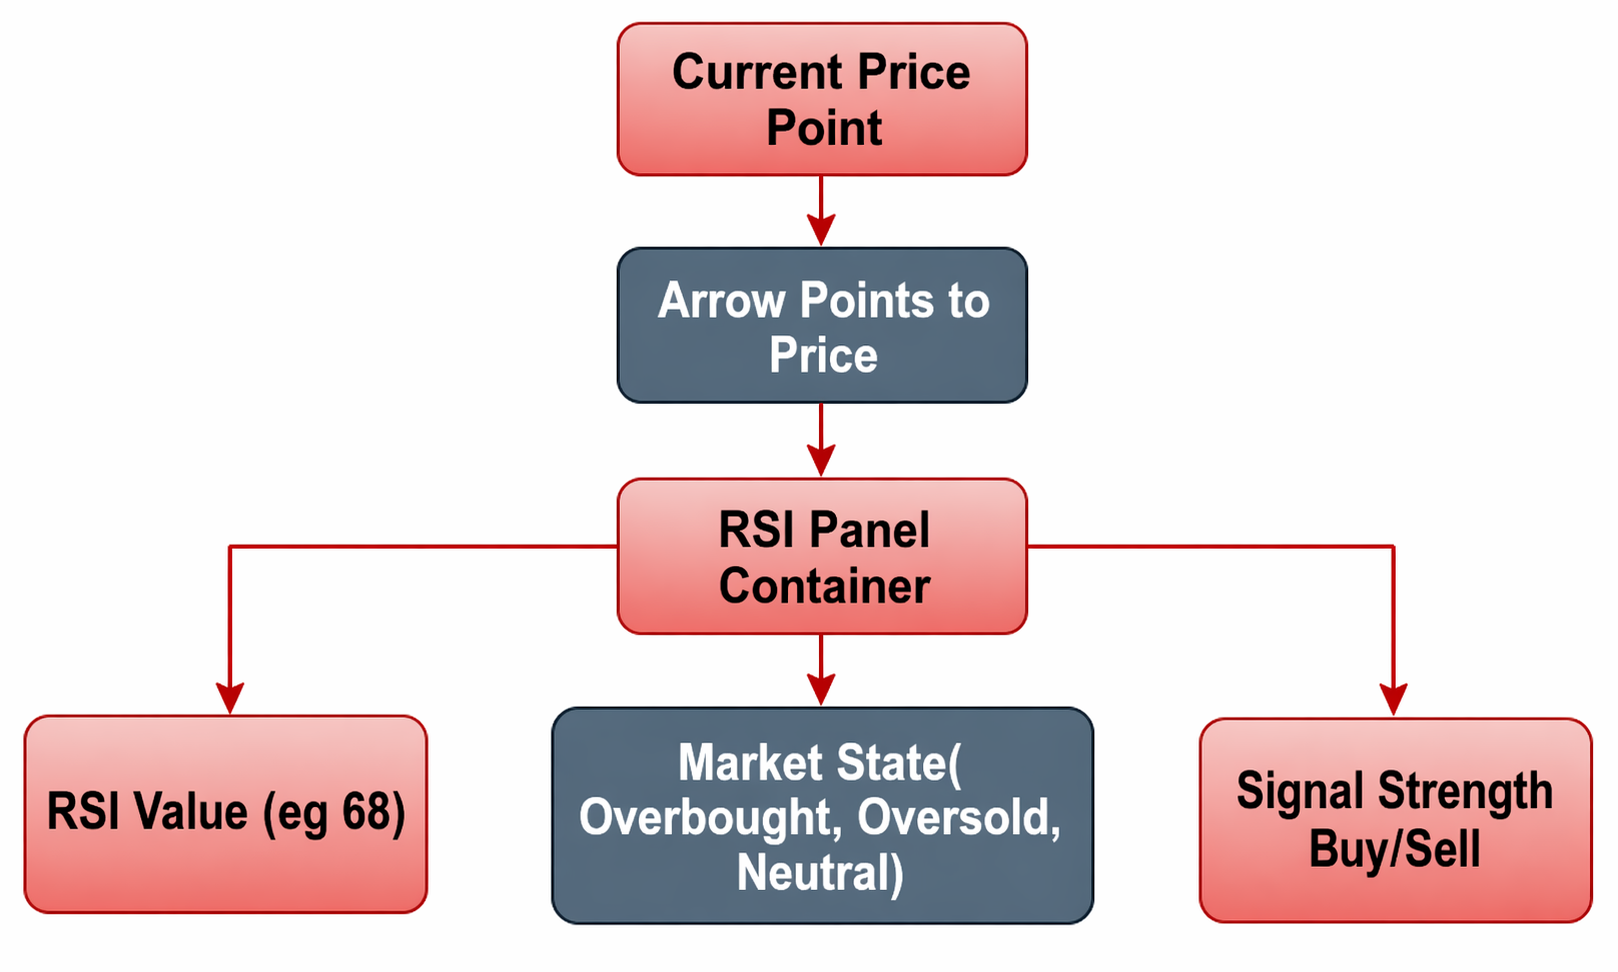
Figure 4: Panel Structure
- RSI Value: The numerical RSI value provides a precise measure of momentum strength. This allows traders to quantify conditions rather than rely solely on visual zones.
- State: The RSI is categorized into Overbought, Oversold, or Neutral. This simplifies interpretation and enables quick recognition of potential reaction zones.
- Signal Strength: Beyond static states, the system introduces a directional signal that reflects the intensity and bias of momentum. This helps traders determine whether the market is likely to continue, slow down, or reverse.
By organizing the data this way, the panel avoids clutter while still delivering actionable insight.
3. Visual Structure
The visual design is intentionally compact and unobtrusive, ensuring that it complements rather than interferes with price action analysis.
The panel consists of:
- A rectangular display area that contains all RSI-related information
- A directional arrow that points toward the current price, reinforcing the connection between the panel and market location
- Color-coded text elements, allowing traders to distinguish conditions instantly without reading each value in detail
Spacing, alignment, and sizing are carefully controlled so that the panel remains readable across different chart zoom levels. The goal is to maintain clarity without distraction, allowing traders to focus primarily on price while still benefiting from momentum confirmation.
4. Signal Intelligence
Traditional RSI usage often relies on fixed threshold levels, such as 70 for overbought and 30 for oversold conditions. While useful, these levels alone do not capture the full behavior of momentum. To improve this, the system incorporates RSI slope analysis, which measures the rate of change between consecutive values. This allows the panel to differentiate between:
- Weak signals: Momentum is present but lacks conviction
- Strong signals: Momentum is clearly directional and active
- Extreme signals: Conditions suggest potential exhaustion or sharp reversals
These classifications are derived from the rate of change (slope) between consecutive RSI values. This extends RSI from a static indicator to a dynamic momentum measure.
5. Adaptive Positioning
A critical aspect of the design is ensuring that the panel remains visible and usable under all chart conditions. To achieve this, the panel position is clamped to the chart boundaries. As the chart is resized, zoomed, or scrolled, the system automatically adjusts the panel’s position to prevent it from moving off-screen or overlapping critical areas excessively.
This ensures:
- Continuous visibility
- Consistent user experience
- Reliable interaction regardless of screen size or layout
The arrow and panel maintain their relative positioning to price while respecting chart boundaries, preserving both functionality and visual integrity.
MQL5 Implementation
The implementation turns RSI into a chart-embedded visual panel using MQL5 objects and real-time data. Instead of a separate indicator window, it uses chart objects and coordinate mapping to display RSI at the current price level. This section explains RSI calculation, signal classification, and dynamic positioning on the chart.
Properties and Indicator Setup
The first step is to define how the indicator will appear and behave within MetaTrader 5. We specify that the indicator should be drawn directly on the main chart window, not in a separate section. Since the goal is to display a visual panel rather than a traditional indicator line, the code doesn’t generate any buffers or plots; instead, it uses graphical objects like rectangles, text labels, and arrows.
//+------------------------------------------------------------------+
//| Indicator properties                                             |
//+------------------------------------------------------------------+
#property indicator_chart_window
#property indicator_buffers 0
#property indicator_plots   0

//--- This indicator renders a chart-embedded RSI panel using objects
This approach makes the display more flexible and visually appealing, allowing us to position and style the elements exactly as we want.
User Inputs and Customization Options
Next, the code defines several input parameters that traders can customize to suit their preferences. The InpRSIPeriod determines how many bars are used to calculate the RSI; the default is 14, a common setting. The InpOverbought and InpOversold levels are thresholds for identifying when the market is overbought or oversold, usually at 70 and 30, respectively. The InpUseAsk option allows traders to choose whether the panel’s position relates to the bid or ask price.
//+------------------------------------------------------------------+
//| Input parameters                                                 |
//+------------------------------------------------------------------+
input int InpRSIPeriod=14;
input double InpOverbought=70.0;
input double InpOversold=30.0;
input bool InpUseAsk=false;
input int InpTimeOffsetSec=90;
input string InpFontName="Segoe UI";
input int InpFontSize=9;
input bool InpShowAlerts=true;
input bool InpLogToExperts=true;

//--- Panel appearance
input color InpPanelBgColor=clrDarkSlateGray;
input color InpBorderColor=clrGoldenrod;
input int InpPanelWidth=290;
input int InpPanelHeight=36;
The InpTimeOffsetSec adds a delay or offset in seconds for the panel’s horizontal placement, which can help in visual analysis. Font name and size (InpFontName and InpFontSize) are customizable, ensuring readability and aesthetic integration. The alert options (InpShowAlerts and InpLogToExperts) control whether notifications are shown or logged when certain market conditions occur. Finally, colors and sizes for the panel background, border, and dimensions are adjustable to match individual preferences, making the visual appearance flexible.
//+------------------------------------------------------------------+
//| Global variables                                                 |
//+------------------------------------------------------------------+
string g_PanelName="RSI_Panel";
string g_ArrowName="RSI_ArrowChar";
string g_TextValue="RSI_Val";
string g_TextState="RSI_State";
string g_TextSignal="RSI_Signal";

int g_RSIHandle=INVALID_HANDLE;
double g_PrevRSI=EMPTY_VALUE;
bool g_AlertOB=false;
bool g_AlertOS=false;
Initialization (OnInit()): Preparing Data and Visual Elements
When the indicator loads, the OnInit() function runs to prepare everything needed for real-time display. It begins by creating an RSI handle via the iRSI() function, which calculates RSI values based on the specified period and close prices. This handle is used repeatedly to fetch the latest RSI data efficiently. If creation fails, the indicator stops to prevent errors. Then, a rectangular object acts as the panel background—configured with size, border, and background color—so that it stands out clearly on the chart.
//+------------------------------------------------------------------+
//| Initialize indicator                                             |
//+------------------------------------------------------------------+
int OnInit()
{
  //--- Create RSI handle
  g_RSIHandle=iRSI(_Symbol,PERIOD_CURRENT,InpRSIPeriod,PRICE_CLOSE);
  if(g_RSIHandle==INVALID_HANDLE)
    return(INIT_FAILED);

  //--- Create panel background
  if(!ObjectCreate(0,g_PanelName,OBJ_RECTANGLE_LABEL,0,0,0))
    return(INIT_FAILED);

  ObjectSetInteger(0,g_PanelName,OBJPROP_CORNER,CORNER_LEFT_UPPER);
  ObjectSetInteger(0,g_PanelName,OBJPROP_XSIZE,InpPanelWidth);
  ObjectSetInteger(0,g_PanelName,OBJPROP_YSIZE,InpPanelHeight);
  ObjectSetInteger(0,g_PanelName,OBJPROP_BORDER_COLOR,InpBorderColor);
  ObjectSetInteger(0,g_PanelName,OBJPROP_BGCOLOR,InpPanelBgColor);
  ObjectSetInteger(0,g_PanelName,OBJPROP_SELECTABLE,false);
  ObjectSetInteger(0,g_PanelName,OBJPROP_HIDDEN,true);

  //--- Create arrow
  if(!ObjectCreate(0,g_ArrowName,OBJ_TEXT,0,0,0))
    return(INIT_FAILED);

  ObjectSetString(0,g_ArrowName,OBJPROP_TEXT,"<");
  ObjectSetString(0,g_ArrowName,OBJPROP_FONT,"Arial");
  ObjectSetInteger(0,g_ArrowName,OBJPROP_FONTSIZE,14);
  ObjectSetInteger(0,g_ArrowName,OBJPROP_COLOR,clrYellow);

  //--- Create labels
  UpdateLabel(g_TextValue,0,0,"",clrWhite);
  UpdateLabel(g_TextState,0,0,"",clrWhite);
  UpdateLabel(g_TextSignal,0,0,"",clrWhite);

  return(INIT_SUCCEEDED);
}
//+------------------------------------------------------------------+
The rectangle is set to be non-interactive so traders cannot accidentally move it. An arrow object is also created to point toward the current price; its font size and color are chosen for visibility. To display information dynamically, three text labels are initialized within the panel: one for the RSI value, one for the market state (overbought, oversold, or neutral), and one for signal classification (buy/sell strength). These labels are created with the help of a dedicated function that manages their position, font, and color. Once all visual objects are set up, a confirmation message is printed to the logs, indicating that the panel is ready to display real-time data.
Cleanup (OnDeinit()): Removing Objects and Freeing Resources
When the indicator is removed or the chart is closed, the OnDeinit() function runs to clean up resources. It releases the RSI handle created earlier using IndicatorRelease(), freeing system resources.
//+------------------------------------------------------------------+
//| Deinitialize indicator                                           |
//+------------------------------------------------------------------+
void OnDeinit(const int reason)
{
  //--- Release handle
  if(g_RSIHandle!=INVALID_HANDLE)
    IndicatorRelease(g_RSIHandle);

  //--- Delete objects
  ObjectDelete(0,g_PanelName);
  ObjectDelete(0,g_ArrowName);
  ObjectDelete(0,g_TextValue);
  ObjectDelete(0,g_TextState);
  ObjectDelete(0,g_TextSignal);
}
//+------------------------------------------------------------------+
It then deletes all graphical objects—such as the panel rectangle, arrow, and labels—using ObjectDelete(). This ensures the chart remains tidy and free of artifacts that could interfere with other analysis or cause performance issues. Proper cleanup helps keep the system efficient and prevents clutter from lingering after the indicator is no longer needed.
Main Calculation (OnCalculate()): Fetching Data and Updating the Display
The core logic happens inside the OnCalculate() function. This function runs each time new market data arrives, updating the display in real-time. It first retrieves the latest RSI value from the indicator buffer with CopyBuffer(). Error handling checks ensure the RSI value is valid; if not, the function exits early. Next, the current market price is obtained—either bid or ask—based on user preference. This price is used as the reference point for positioning the panel and arrow on the chart. The code then classifies the current market condition: if RSI exceeds the overbought threshold, it’s marked as overbought; if it falls below the oversold level, it’s marked as oversold; otherwise, it’s neutral. This classification is displayed as clear text labels for quick recognition.
//+------------------------------------------------------------------+
//| Main calculation                                                 |
//+------------------------------------------------------------------+
int OnCalculate(const int rates_total,const int prev_calculated,
                const datetime &time[],const double &open[],
                const double &high[],const double &low[],
                const double &close[],const long &tick_volume[],
                const long &volume[],const int &spread[])
{
  double rsiBuf[1];

  //--- Get RSI value
  if(CopyBuffer(g_RSIHandle,0,0,1,rsiBuf)!=1)
    return(rates_total);

  double rsi=rsiBuf[0];
  if(rsi<=0 || rsi>100)
    return(rates_total);

  //--- Get current price
  double price=InpUseAsk ?
               SymbolInfoDouble(_Symbol,SYMBOL_ASK) :
               SymbolInfoDouble(_Symbol,SYMBOL_BID);

  if(price<=0)
    return(rates_total);

  //--- Determine state
  bool isOB=(rsi>=InpOverbought);
  bool isOS=(rsi<=InpOversold);

  string stateText=GetStateText(rsi);
  color stateColor=isOB ? clrOrangeRed :
                    (isOS ? clrDodgerBlue : clrSilver);

  //--- Determine signal
  color signalColor;
  string signal=GetSignalClassification(rsi,g_PrevRSI,isOB,isOS,signalColor);

  //--- Convert price to screen coordinates
  datetime lastTime=time[rates_total-1];
  datetime anchorTime=lastTime+InpTimeOffsetSec;

  int priceX,priceY;
  if(!ChartTimePriceToXY(0,0,anchorTime,price,priceX,priceY))
    return(rates_total);

  //--- Position elements
  int arrowX=priceX-45;
  int arrowY=priceY-2;
  int panelX=priceX+20;
  int panelY=priceY-(InpPanelHeight/2);

  ClampPanelPosition(panelX,panelY,arrowX,arrowY,priceX,priceY);

  //--- Apply positions
  ObjectSetInteger(0,g_ArrowName,OBJPROP_XDISTANCE,arrowX);
  ObjectSetInteger(0,g_ArrowName,OBJPROP_YDISTANCE,arrowY);
  ObjectSetInteger(0,g_PanelName,OBJPROP_XDISTANCE,panelX);
  ObjectSetInteger(0,g_PanelName,OBJPROP_YDISTANCE,panelY);

  //--- Update text
  int textY=(InpPanelHeight-InpFontSize)/2;

  UpdateLabel(g_TextValue,panelX+8,panelY+textY,
              StringFormat("RSI: %.1f",rsi),clrWhite);

  UpdateLabel(g_TextState,panelX+85,panelY+textY,
              stateText,stateColor);

  UpdateLabel(g_TextSignal,panelX+185,panelY+textY,
              signal,signalColor);

  //--- Store previous RSI
  g_PrevRSI=rsi;

  ChartRedraw();
  return(rates_total);
}
//+------------------------------------------------------------------+
The RSI change (delta)—how much it has changed since the last update—is calculated to assess whether the market is strengthening or weakening, generating signals like "Strong Buy" or "Weak Sell." The panel and arrow positions are derived from time and price and then converted to chart pixel coordinates. To keep the display visible at all times, a boundary check adjusts the positions if they are near the edges of the chart. The arrow and panel are moved accordingly, and the text labels inside the panel are updated with the latest RSI value, market state, and signals, each styled with appropriate colors for clarity. When RSI enters the overbought/oversold zone, the indicator triggers an alert (if enabled). Flags prevent repeated alerts. The previous RSI value is stored for the next update, and the chart is redrawn.
Utility Functions—Supporting the Main Logic
Signal strength is determined using RSI slope magnitude thresholds, where larger absolute slope values indicate stronger momentum.
//+------------------------------------------------------------------+
//| Classify RSI signal                                              |
//+------------------------------------------------------------------+
string GetSignalClassification(double rsi,double prevRSI,
                               bool isOB,bool isOS,color &textColor)
{
  double slope=(prevRSI!=EMPTY_VALUE) ? (rsi-prevRSI) : 0;
  string signal="";

  if(isOB)
  {
    if(rsi>=80)
      signal="EXTREME SELL";
    else if(slope<-1.5)
      signal="STRONG SELL";
    else if(slope>0)
      signal="WEAK SELL";
    else
      signal="SELL";

    textColor=clrOrangeRed;
  }
  else if(isOS)
  {
    if(rsi<=20)
      signal="EXTREME BUY";
    else if(slope>1.5)
      signal="STRONG BUY";
    else if(slope<0)
      signal="WEAK BUY";
    else
      signal="BUY";

    textColor=clrDodgerBlue;
  }
  else
  {
    signal="NEUTRAL";
    textColor=clrSilver;
  }

  return signal;
}
//+------------------------------------------------------------------+
The implementation employs several utility functions that simplify common tasks. GetSignalClassification() analyzes the RSI’s recent slope and thresholds to produce clear buy or sell signals, indicating market strength and direction with textual cues and colors.
//+------------------------------------------------------------------+
//| Return RSI state text                                            |
//+------------------------------------------------------------------+
string GetStateText(double rsi)
{
  if(rsi>=InpOverbought)
    return "OVERBOUGHT";

  if(rsi<=InpOversold)
    return "OVERSOLD";

  return "NEUTRAL";
}
//+------------------------------------------------------------------+
GetStateText() provides a simple categorical indicator of market condition (overbought, oversold, or neutral), allowing traders to interpret conditions at a glance.
//+------------------------------------------------------------------+
//| Update label                                                     |
//+------------------------------------------------------------------+
void UpdateLabel(string name,int x,int y,
                 string text,color clr,int fontSize=-1)
{
  if(fontSize==-1)
    fontSize=InpFontSize;

  if(!ObjectCreate(0,name,OBJ_LABEL,0,0,0))
  {
    ObjectSetString(0,name,OBJPROP_TEXT,text);
  }

  ObjectSetInteger(0,name,OBJPROP_XDISTANCE,x);
  ObjectSetInteger(0,name,OBJPROP_YDISTANCE,y);
  ObjectSetInteger(0,name,OBJPROP_CORNER,CORNER_LEFT_UPPER);
  ObjectSetString(0,name,OBJPROP_TEXT,text);
  ObjectSetString(0,name,OBJPROP_FONT,InpFontName);
  ObjectSetInteger(0,name,OBJPROP_FONTSIZE,fontSize);
  ObjectSetInteger(0,name,OBJPROP_COLOR,clr);
  ObjectSetInteger(0,name,OBJPROP_SELECTABLE,false);
}
//+------------------------------------------------------------------+
The UpdateLabel() function creates or updates text labels within the panel, setting their position, font, size, and color consistently. ClampPanelPosition() checks the chart edges and adjusts the panel and arrow positions to ensure they remain fully visible, preventing parts from being cut off or hidden outside the chart area. These functions encapsulate repeated tasks and simplify the main calculation logic.
//+------------------------------------------------------------------+
//| Keep panel inside chart                                          |
//+------------------------------------------------------------------+
void ClampPanelPosition(int &panelX,int &panelY,
                        int &arrowX,int &arrowY,
                        int priceX,int priceY)
{
  int chartWidth=(int)ChartGetInteger(0,CHART_WIDTH_IN_PIXELS);
  int chartHeight=(int)ChartGetInteger(0,CHART_HEIGHT_IN_PIXELS);

  //--- Clamp panel X
  if(panelX+InpPanelWidth>chartWidth)
    panelX=chartWidth-InpPanelWidth-5;

  if(panelX<5)
    panelX=5;

  //--- Clamp panel Y
  if(panelY<5)
    panelY=5;

  if(panelY+InpPanelHeight>chartHeight)
    panelY=chartHeight-InpPanelHeight-5;

  //--- Arrow position
  arrowX=priceX-45;
  arrowY=priceY-2;
}
//+------------------------------------------------------------------+
Design Considerations—Building a User-Friendly and Efficient Tool
The indicator’s design balances technical efficiency with ease of use. Handles for the RSI calculation are created once during OnInit() and released during OnDeinit(), avoiding unnecessary resource consumption. The visual elements—panel, arrow, and labels—are designed with customizable colors and fonts, allowing traders to match their preferred chart themes. Position calculations are dynamic, ensuring the panel stays within the visible chart area regardless of market movement or zoom level. Alerts are carefully managed with flags to prevent repetitive notifications, providing timely signals without being intrusive. The indicator’s parameters are fully customizable, enabling traders to fine-tune sensitivity, thresholds, and appearance to match their trading strategies. Overall, the design aims to deliver a clear, informative, and unobtrusive visual aid that enhances technical analysis without cluttering the chart.
This step-by-step implementation offers a comprehensive method to create a visual RSI indicator that provides instant insights into market conditions. By combining handle management, graphical objects, and intelligent market analysis, the panel delivers real-time updates in a clear and attractive format. Its modular structure, utility functions, and boundary checks make it easy to customize and extend, offering traders a powerful tool to support their decision-making. The result is a user-friendly, visually appealing indicator that can be adapted to various trading styles and preferences, making RSI analysis more accessible and effective within MetaTrader 5.
Outcomes
The effectiveness of the RSI Price Action Panel is best understood through its real-time behavior on the chart. The following diagrams demonstrate how the system performs under live market conditions, focusing on movement, adaptability, and responsiveness rather than static comparison.
Real-Time Price Anchoring and Movement
The diagram below illustrates the panel actively attached to price as the market evolves. As new candles form and price shifts, the panel continuously repositions itself to maintain a fixed spatial relationship with the current price level.
Figure 5: Testing Performance
The panel maintains alignment with price using real-time coordinate mapping. The arrow stays anchored to the price point, and the panel repositions itself to remain visible during zooming and resizing. It recalculates coordinates using the updated chart dimensions. The result is a responsive interface where RSI data remains directly aligned with price.
Multi-Timeframe Adaptability
Figure 6: Switching Across Timeframes
The diagram above demonstrates how the system behaves across different chart contexts, particularly when switching between timeframes. As the timeframe changes, the panel automatically adapts to the new data environment. The RSI values are recalculated based on the active timeframe, and the panel continues to anchor itself to the latest price point without requiring reinitialization or manual adjustment.
This confirms that the system remains stable across timeframe changes. RSI values are recalculated dynamically while the panel structure and positioning remain consistent. This ensures continuity in analysis, allowing traders to move between timeframes without losing interpretability.
From these observations, several practical outcomes emerge:
- Continuous alignment with price: The panel maintains real-time attachment to the current market level
- Adaptive positioning: It intelligently adjusts to chart zooming, resizing, and shifting
- Timeframe independence: The system remains stable and functional across multiple timeframes
- Consistent visual structure: Information layout remains unchanged while data updates dynamically
These results show that the RSI panel is not just a visual overlay but a fully adaptive, chart-embedded system. Its ability to follow price, adjust to chart transformations, and remain consistent across timeframes ensures that RSI-based confirmation is always delivered in the most relevant context. Rather than acting as a separate analytical tool, the system becomes part of the price action itself—continuously updating, repositioning, and aligning with the trader’s focus in real time.
Conclusion
The implemented solution transforms RSI from a separate confirmation tool into an integrated chart object that lives at the point of execution. Concretely, the article delivers a working MQL5 scaffold that:
- computes RSI via an iRSI handle and updates on each tick;
- renders a compact panel (OBJ RECTANGLE LABEL), an arrow (OBJ TEXT), and labels (OBJ LABEL) positioned by ChartTimePriceToXY;
- prevents off-screen placement with a ClampPanelPosition routine and adapts automatically to zoom, scroll, and timeframe changes;
- classifies market state (OVERBOUGHT/OVERSOLD/NEUTRAL) and derives signal strength from RSI slope with configurable thresholds;
- manages resources and alerts cleanly (IndicatorRelease, alert flags) so it is safe to run and remove.
As a result, you obtain a portable MT5 indicator template: drop it on a chart and you immediately get continuous alignment with price, adaptive positioning, timeframe independence, and a consistent visual layout that can be extended with custom signal logic or notification rules. The artifact is both a practical tool for faster, less fragmented decision-making and a reusable pattern for building other chart-anchored momentum panels.
Warning: All rights to these materials are reserved by MetaQuotes Ltd. Copying or reprinting of these materials in whole or in part is prohibited.
This article was written by a user of the site and reflects their personal views. MetaQuotes Ltd is not responsible for the accuracy of the information presented, nor for any consequences resulting from the use of the solutions, strategies or recommendations described.

- Free trading apps
- Over 8,000 signals for copying
- Economic news for exploring financial markets
You agree to website policy and terms of use